- Protocols

- Articles and Issues
- For Authors
- About
- Become a Reviewer

In vitro Time-lapse Imaging of Primary Cilium in Migrating Neuroblasts
Published: Vol 10, Iss 22, Nov 20, 2020 DOI: 10.21769/BioProtoc.3823 Views: 4911
Reviewed by: Bihe HuAllan-Hermann PoolAnonymous reviewer(s)
Original research article
The authors used this protocol in:
Dec 2019
Advertisement


Protocol Collections
Comprehensive collections of detailed, peer-reviewed protocols focusing on specific topics


Related protocols
Abstract
Neuronal migration is a critical step for the development of neuronal circuits in the brain. Immature new neurons (neuroblasts) generated in the postnatal ventricular-subventricular zone (V-SVZ) show a remarkable potential to migrate for a long distance at a high speed in the postnatal mammalian brain, and are thus a powerful model to analyze the molecular and cellular mechanisms of neuronal migration. Here we describe a methodology for in vitro time-lapse imaging of the primary cilium and its related structures in migrating V-SVZ-derived neuroblasts using confocal or superresolution laser-scanning microscopy. The V-SVZ tissues are dissected from postnatal day 0-1 (P0-1) mouse brains and dissociated into single cells by trypsinization and gentle pipetting. These cells are then transduced with a plasmid(s) encoding a gene(s) of interest, aggregated by centrifugation, and cultured for 2 days in Matrigel. Time-lapse images of migratory behaviors of cultured neuroblasts and their ciliary structures, including the ciliary membrane and basal body, are acquired by confocal or superresolution laser-scanning microscopy. This method provides information about the spatiotemporal dynamics of neuroblasts’ morphology and ciliary structures, and is widely applicable to various types of migrating neuronal and nonneuronal cells in various species.
Keywords: Postnatal neurogenesisBackground
In the postnatal brain, neural stem cells reside in the ventricular-subventricular zone (V-SVZ) lining the lateral walls of lateral ventricles, and continuously generate immature new neurons (neuroblasts) (Obernier and Alvarez-Buylla, 2019). These neuroblasts form chain-like cell aggregates and migrate along each other through the rostral migratory stream (RMS) toward the olfactory bulb (OB) (Luskin, 1993; Lois and Alvarez-Buylla, 1994; Lois et al., 1996), where they are integrated into the neuronal circuits and involved in the processing of odor information (Gheusi et al., 2000; Breton-Provencher et al., 2009; Moreno et al., 2009; Sakamoto et al., 2011 and 2014). Following brain injuries such as stroke and trauma, V-SVZ-derived neuroblasts migrate toward the lesion and differentiate into mature neurons, contributing to the recovery of impaired gait behaviors (Arvidsson et al., 2002; Parent et al., 2002; Yamashita et al., 2006; Yang et al., 2007 and 2008; Kreuzberg et al., 2010; Jinnou et al., 2018; Kaneko et al., 2018). Altering the migration of neuroblasts affects their final positioning and functions in the postnatal brain under both physiological and pathological conditions (Belvindrah et al., 2011; Ota et al., 2014; Petri et al., 2017; Kaneko et al., 2018; Sawada et al., 2018), suggesting that regulation of neuroblast migration is critical for the plasticity of postnatal neuronal circuits.
V-SVZ-derived migrating neuroblasts show typical immature morphology, with a long leading process and a short trailing process (Schaar and McConnell, 2005). These neuroblasts show saltatory migration, which is executed by repeated extension of a leading process and subsequent somal translocation (Schaar and McConnell, 2005). Recently, accumulating evidence suggests that the primary cilium, a tiny cellular protrusion (Guemez-Gamboa et al., 2014; Malicki and Johnson, 2017), and its associated cytoskeletal network play pivotal roles in neuronal migration (Baudoin et al., 2012; Higginbotham et al., 2012; Trivedi et al., 2014; Guo et al., 2017). Therefore, time-lapse imaging of these components is useful for analyzing their subcellular localization and understanding the mechanisms of neuroblast migration (Trivedi et al., 2014 and 2017; Matsumoto et al., 2019).
Here, we describe a detailed protocol that we have recently used for in vitro time-lapse confocal/superresolution imaging of the primary cilium in migrating neuroblasts (Matsumoto et al., 2019). Images of whole-cell morphology and the primary cilium in cultured V-SVZ-derived neuroblasts could be recorded in a four-dimensional (x, y, z, and time) manner. This technique is widely applicable not only to migrating immature neurons but also to migrating nonneuronal cells in various species.
Materials and Reagents
70 µm Cell Strainer (BD, Falcon, catalog number: 352350 )
35 mm multiwell glass bottom dish (Matsunami, catalog number: D141400 )
35 mm tissue culture dish (BD, Falcon, catalog number: 353001 )
50 ml centrifuge tube (Thermo, catalog number: 339652 )
1.5 ml microtube (BIO-BIK, catalog number: CF-0150 )
0.6 ml microtube (QSP, catalog number: 502-PLN-Q )
Postnatal day 0-1 C57BL/6J mice (Japan SLC)
Postnatal day 0-1 GFP::Cent2 mice (Higginbotham et al., 2004)
CSII-CMV-Arl13b::Venus (Matsumoto et al., 2019)
pdTomato-C1-Cent2 (dTomato::Cent2) (Matsumoto et al., 2019)
pCAGGS-dnKif3A (Matsumoto et al., 2019)
pcDNA3.1-EB3-mEGFP (EB3::GFP) (Watanabe et al., 2015) (provided by Dr Kozo Kaibuchi at Fujita Health University)
Leibovitz’s L-15 medium (GIBCO, catalog number: 11415-064 )
Neurobasal medium (GIBCO, catalog number: 21103 )
Penicillin-streptomycin (GIBCO, catalog number: 15140-122 )
L-glutamine (GIBCO, catalog number: 25030 )
NeuroBrew-21 (MACS Miltenyi Biotec, catalog number: 130-093-566 )
DNase I (Roche, catalog number: 10-104-159-001 )
0.25% (w/v%) Trypsin-1 mmol/L EDTA·4Na Solution with phenol red 500 ml (WAKO, catalog number: 201-16945 )
RPMI-1640 medium (WAKO, catalog number: 189-02145 )
Amaxa Mouse Neural Stem Cell Nucleofector Kit (Lonza, catalog number: VPG-1004 )
BD Matrigel matrix 10 ml (BD Biosciences, catalog number: 354234 )
Fetal bovine serum (FBS)
KE-106 (Shin-Etsu Silicone)
CAT-RG (Shin-Etsu Silicone)
India ink
Neurobasal final medium (see Recipes)
60% Matrigel/L15 (see Recipes)
DNase I solution (see Recipes)
10% FBS/L15 (see Recipes)
Note: Plasmids used in this study (9.-11.) are available on request.
Equipment
Stereomicroscope (Olympus, model: SZ61 )
Light source and fibers (Olympus, model: LG-PS2 )
Microscopic scissors (Karl Hammacher GmbH, model: HSB014-11 )
Forceps (Natsume Seisakusyo Co., Ltd., NAPOX A-1)
Ultrafine forceps (Dumont, model: DU-5/45 )
Ophthalmic knife (MANI, model: MST15 )
P1000 micropipet (Nichiryo, catalog number: NPX-1000 )
P200 micropipet (Nichiryo, catalog number: NPX-200 )
P20 micropipet (Nichiryo, catalog number: NPX-20 )
P2 micropipet (GILSON, catalog number: F144801 )
Amaxa NucleofectorTM II (Lonza)
Centrifuge (TOMY, model: PMC-060 )
Confocal/superresolution laser-scanning microscope system (Carl Zeiss, model: LSM880 with Airyscan )
Laser line 561 nm (Carl Zeiss, catalog number: 000000-1410-117 )
RE Argon Laser LGK7812 ML5 (Carl Zeiss, catalog number: 000000-2158-591 )
Stage-top incubation chamber (Tokai Hit Co., Ltd., INUG2-WSKM)
CO2 gas tank
CO2 incubator (SANYO, model: MCO-18AIC )
Incubator (EYELA, model: NDS-500 )
Water bath
Software
ZEN (Carl Zeiss)
FIJI (https://fiji.sc) (Schindelin et al., 2012)
IMARIS (https://imaris.oxinst.com) (Bitplane, version 7.5.2)
EZR (https://www.softpedia.com/get/Science-CAD/EZR.shtml) (Kanda, 2013)
Procedure
Preparation of 35 mm dissection dish
Add KE-106 23 ml, CAT-RG 2.3 ml, and India ink 0.6 ml into a 50 ml tube, and mix them using a stirring rod until the silicone solution becomes homogeneous.
Centrifuge the tube at 3,300 x g for 1 min to remove bubbles in the silicone solution.
Add an appropriate amount of the silicone solution to a 35 mm dish.
Polymerize the silicone solution by incubation at 60 °C for 3 h in an incubator.
Dissection of V-SVZ tissues from postnatal day 0-1 (P0-1) mouse brains
A video and detailed procedure for dissection of V-SVZ tissue in the adult brain have been published previously (Mirzadeh et al., 2010). Our method is modified from that of (Mirzadeh et al., 2010) to increase the relative proportion of neuroblasts in the neonatal V-SVZ- tissues. For in vitro time-lapse imaging of migrating V-SVZ-derived neuroblasts, use P0-1 mouse brains. Older brains contain fewer migrating neuroblasts in the V-SVZ.
Anesthetize a P0-1 pup by hypothermia (1-2 min) and sacrifice it by cervical dislocation. Use 3-5 pups per experimental group. Tissue dissection (3.-10.) should be performed at 4 °C and within 10 min per pup.
Make an incision in both the scalp and skull along the midline of the head using scissors, and remove the dorsal part of the scalp and skull using forceps.
Extract the brain into L15 medium (2-3 ml) in a 35 mm dissection dish.
Divide the brain into two hemispheres by cutting along the midline under a stereomicroscope with a light source (Figure 1, Step 4).
View the brain hemisphere from the dorsal view, and remove the septum and the medial part of the OB (Figure 1, Step 5). This cutting enables one to visualize the anterior lateral wall of the lateral ventricle.
View the lateral wall from the en face view, and remove the cerebral cortex by cutting along the corpus callosum (Figure 1, Step 6).
View the brain from the dorsal view, and remove the hippocampus by cutting along the posterior part of the lateral ventricle, which is visualized as a cleft (Figure 1, Step 7).
View the lateral wall from the en face view, and remove the thalamus and olfactory bulb (Figure 1, Step 8). As a result, the whole lateral wall of the lateral ventricle can now be visualized.
View the brain from the ventral or dorsal view, and collect the V-SVZ tissue by cutting along the border between the V-SVZ and striatum (Figure 1, Step 9). Collected V-SVZ tissue should be semi-transparent. Contamination by a large amount of striatal tissue will decrease the number of neuroblasts migrating out from the cell aggregates embedded in Matrigel.
Trim the collected V-SVZ tissue by removing the ventral and posterior V-SVZ (Figure 1, Step 10), to increase the relative proportion of neuroblasts in the V-SVZ tissue (Doetsch and Alvarez-Buylla, 1996).
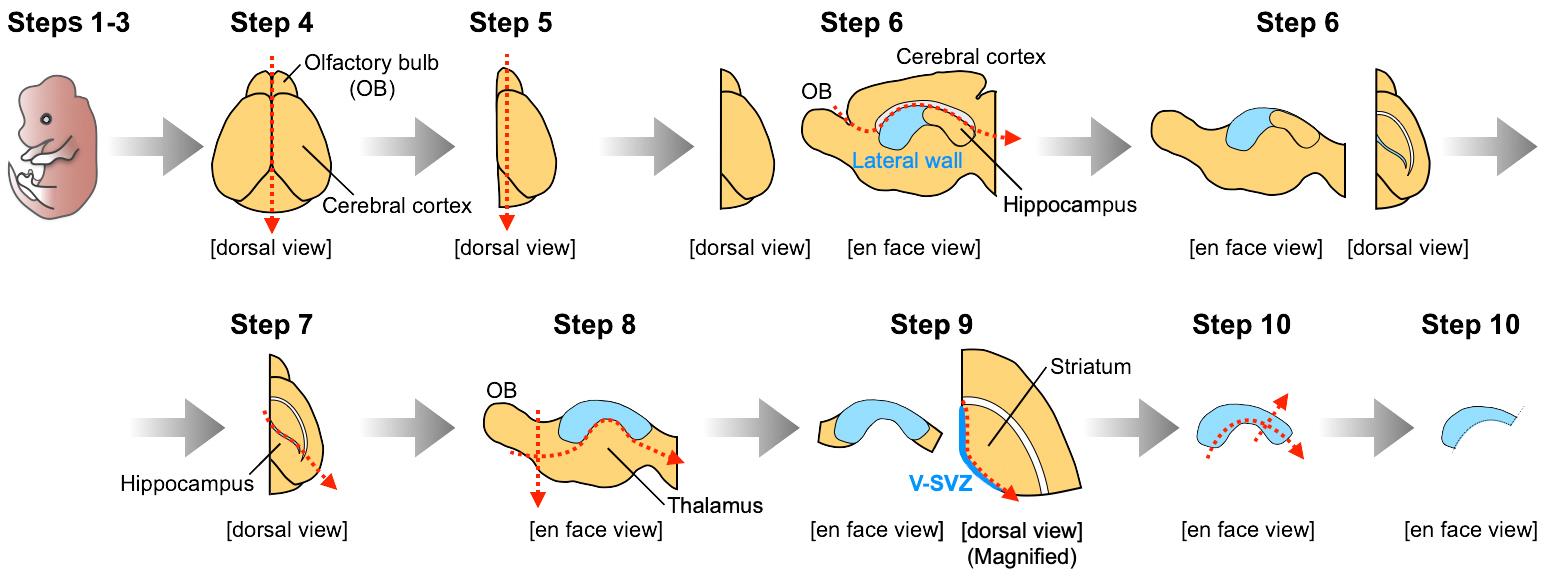
Figure 1. Dissection of V-SVZ tissues from postnatal mouse brains. Illustrations for steps 1-10 correspond to the descriptions in Procedure B Steps 1-10, respectively. Red arrows indicate lines of cutting. A video of the original procedure for dissection of V-SVZ tissues is shown in Mirzadeh et al. (2010).
Dissociation of V-SVZ cells
Incubate the V-SVZ tissues with 200 µl of pre-warmed trypsin-EDTA (37 °C) at room temperature (RT) for 3-4 min without pipetting in a 1.5 ml microtube.
Briefly centrifuge the tube and remove the trypsin-EDTA.
Add 200 µl of 10% FBS/L15 medium (for trypsin inactivation) and 8 µl of 2 mg/ml DNase, and dissociate the V-SVZ tissues into single cells by pipetting using a P200 micropipet.
Pass the cell suspension through a 70-µm cell strainer to remove tissue debris.
Add 800 µl of DNase I solution with gentle pipetting.
Centrifuge the tube for 1 min at RT, and remove the supernatant.
Wash the cells with 800 µl of DNase I solution with gentle pipetting.
Centrifuge the tube for 1 min at RT, and remove the supernatant.
Proceed to Procedure D (Nucleofection and Matrigel embedding). When using a transgenic mouse line that labels specific cells and/or subcellular organs by fluorescent proteins (e.g., GFP::Cent2 mice), skip the steps for plasmid transduction (Steps D1-D8).
Nucleofection and Matrigel embedding
Prepare Mouse Neural Stem Cell Solution (Lonza, see manufacturer’s instructions).
Resuspend the cells with 100 µl of Mouse Neural Stem Cell Solution with gentle pipetting.
Add ~2.0 µg of plasmid(s) to the cell suspension. If two or more plasmids are introduced, the total amount of those plasmids should be ~2.0 µg.
For labeling of the primary cilium, we use a plasmid encoding Arl13b::Venus (Matsumoto et al., 2019). For labeling of the basal body, we use a plasmid encoding dTomato::Cent2 (Matsumoto et al., 2019). A GFP::Cent2 transgenic mouse line (Higginbotham et al., 2004) is also useful for time-lapse imaging because all neuroblasts express GFP::Cent2. For labeling of the microtubule plus-end, we use a plasmid encoding EB3::GFP (Watanabe et al., 2015).
Transfer the cell suspension to a cuvet using a dropper (included in the Amaxa Nucleofector Kit).
Transduce the plasmid(s) into the cells using Amaxa NucleofectorTM II (program: G-013).
Add 400 µl of pre-warmed RPMI-1640 medium (37 °C) to the cuvet.
Transfer the cell suspension (a total of 500 µl) to a 1.5 ml microtube and incubate it at 37 °C (water bath) for 15 min to allow the cells to recover.
Centrifuge the tube for 1 min at RT, and remove the supernatant.
Wash the cells with 200 µl of DNase I solution with gentle pipetting, and transfer the cell suspension to a 0.5 ml PCR tube.
Centrifuge the tube for 2 min at RT.
Carefully transfer the cell pellet (while maintaining its shape) from the PCR tube to L-15 medium in a 35 mm dissection dish by gentle pipetting (Figure 2, Step 1).
Prepare 500 µm x 500 µm x 500 µm cell aggregates from the cell pellet using an ophthalmic knife and ultrafine forceps (Figure 2, Step 2).
Carefully transfer 1-5 cell aggregates into a 1st drop (8 µl) of 60% Matrigel/L15 on a 35 mm dish (4 °C), to replace L-15 medium surrounding the cell aggregates with 60% Matrigel/L15 (Figure 2, Step 3). The percentage of Matrigel will affect the migration behaviors of cultured neuroblasts: individual and chain migration will be observed in 50% and 70-100% Matrigel, respectively. Matrigel concentration less than 50% will result in the failure of gelation (Step D16).
Carefully transfer the cell aggregates from the 1st drop into a 2nd drop (8 µl) of 60% Matrigel/L15 on a 35 mm dish (4 °C) (Figure 2, Step 4). Carrying in an excess volume of the 1st drop with the cell aggregates will result in a decrease of the Matrigel concentration in the 2nd drop and the failure of gelation (Step D16).
Add 60% Matrigel/L15 containing 2-5 cell aggregates to a 35 mm multiwell glass-bottom dish (Figure 2, Step 5).
Incubate the dish for 3 min at 4 °C for sedimentation of cell aggregates within 60% Matrigel/L15, and subsequently for 15 min at 37 °C in the presence of 5% CO2 for Matrigel gelation.
Carefully add 200 µl of Neurobasal final medium and culture the cell aggregates for 2 days at 37 °C in a CO2 incubator in the presence of 5% CO2.
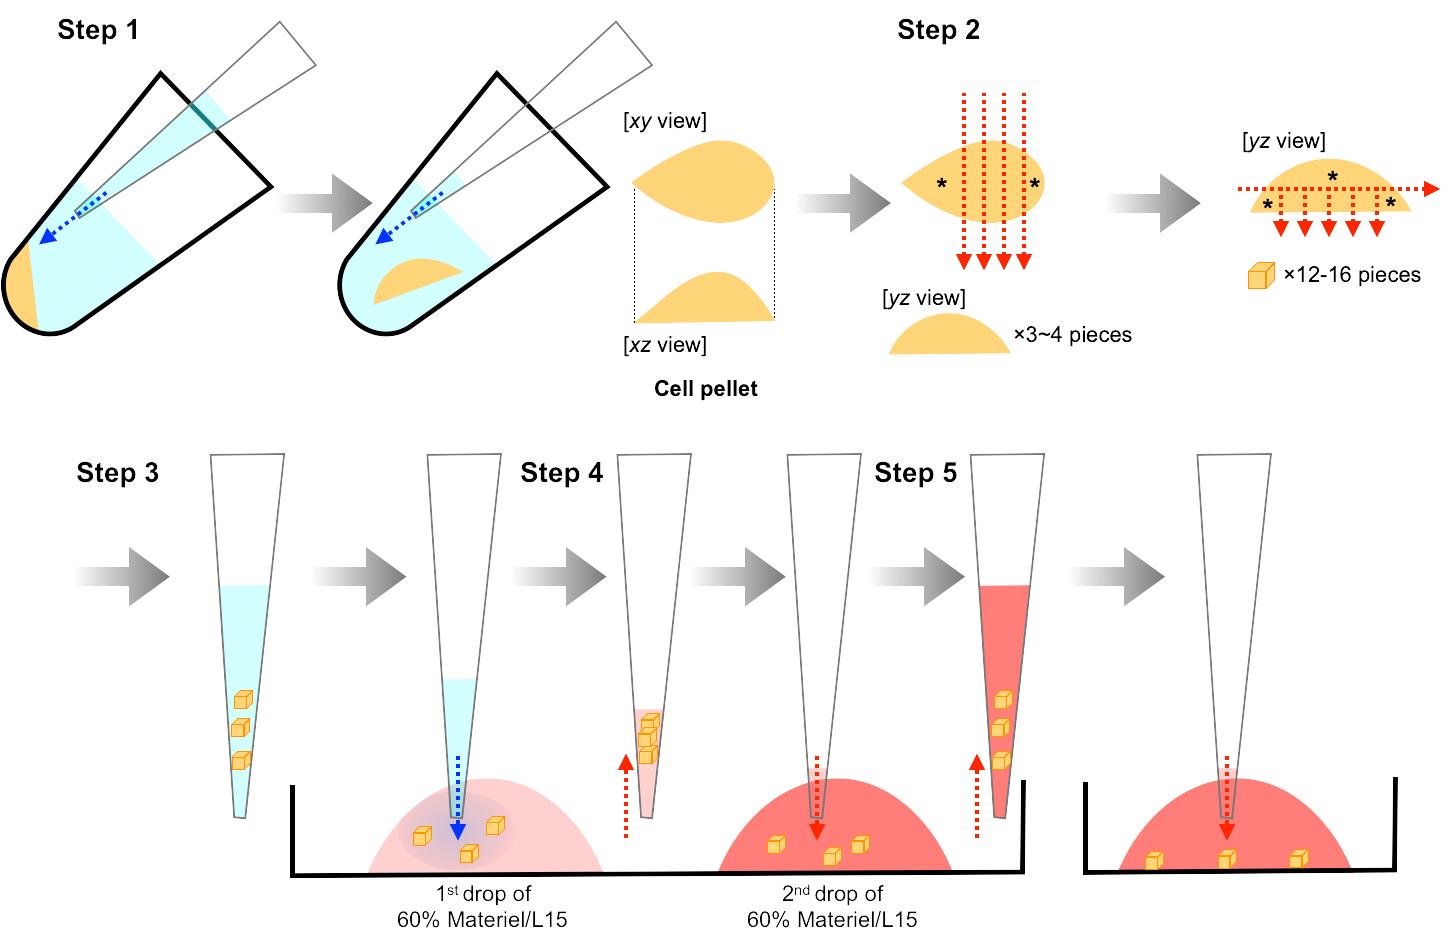
Figure 2. Preparation of V-SVZ cell aggregates. Illustrations for steps 1-5 correspond to the descriptions in Procedure D Steps 11-15, respectively. Blue and red arrows in steps 1 and 3-5 indicate the direction of blowing and aspiration, respectively. Red arrows in step 2 indicate lines of cutting. Cell aggregates indicated by asterisks (step 2) should be discarded. These procedures have been used previously (Hirota et al., 2007).
In vitro time-lapse imaging of migrating neuroblasts
Start up the confocal laser-scanning microscope system and stage-top incubation chamber set at 37 °C. To stabilize the culture environment within the stage-top incubation chamber, incubate the chamber without cells for 1 h at 37 °C in the presence of 5% CO2.
Set a 35 mm glass-bottom dish containing cultured neuroblasts in the stage-top incubation chamber, and incubate it for 2 h at 37 °C in the presence of 5% CO2.
Choose the appropriate objective lens. To perform time-lapse imaging of the basal body and primary cilium, a 63x oil-immersion objective lens is preferable. Lengths of a neuroblast and its primary cilium are typically 0.5-3.0 µm and 60-80 µm, respectively. Since the primary cilium and its associated structures are tiny subcellular components, confocal or superresolution laser-scanning microscopy is highly recommended for time-lapse imaging to understand their spatiotemporal dynamics in migrating neuroblasts. The optical zoom and resolution setting in the confocal laser-scanning microscope system are also useful to increase the imaging resolution.
Set the laser configuration for image acquisition in the confocal laser-scanning microscope system by adjusting the pinhole size, laser intensity, detector gain and offset in all channels. Set the pinhole to 1 Arbitrary Unit for clear image acquisition of the basal body and primary cilium. Excessive laser intensity will induce phototoxicity or photobleaching in targeted neuroblasts and their primary cilium. High-sensitivity GaAsP detectors can be used for brighter time-lapse imaging. Excitation wavelengths used in this study were as follows: 488 nm for GFP/Venus, 561 nm for dTomato.
(Optional) Improve the resolution of time-lapse images by using superresolution methodology. For settings used for superresolution imaging, follow the instructions of the microscope’s supplier. In our EB3::GFP and dTomato::Cent2 imaging, which visualizes microtubule polymerization and centrioles, respectively, we use an LSM880 with Airyscan imaging system (Carl Zeiss), and its image acquisition settings are as follows: 63x (NA 1.4) oil-immersion objective lens, S-R mode, Optical zoom 1.8x, 0.043 µm/pixel, and pixel dwell 2.38 µsec (Matsumoto et al., 2019).
Set time- and z-intervals, which are determined depending on the experimental purpose. In our experiments (Matsumoto et al., 2019), time-lapse images of primary cilium and microtubule polymerization dynamics in neuroblasts are acquired at 1-2 min and 4-sec intervals, respectively. To monitor the dynamics of the basal body and primary cilium in migrating neuroblasts, z-stack images are acquired at 0.6 µm intervals.
Set the imaging period, which is determined depending on the experimental purpose. If photobleaching or phototoxicity is observed, decrease the laser intensity, and/or increase the z-/time-intervals.
Start the image acquisition. After finishing image acquisition, save the imaging file in a format specified by the confocal microscope supplier (e.g., .lsm or .czi format for Carl Zeiss). If necessary, save z-stack projection images as well.
Data analysis
Three-dimensional reconstructions of migrating neuroblasts and their primary cilium
Open the original imaging file (e.g., .lsm or .czi format for Carl Zeiss) to visualize fluorescent objects using IMARIS software.
Select “Surfaces” from the “Surpass” tab to add a new surface (named “Surfaces 1”) in the “Surpass Scene” folder shown in the left upper box of the IMARIS interface (Figure 3, No.1-No.3).
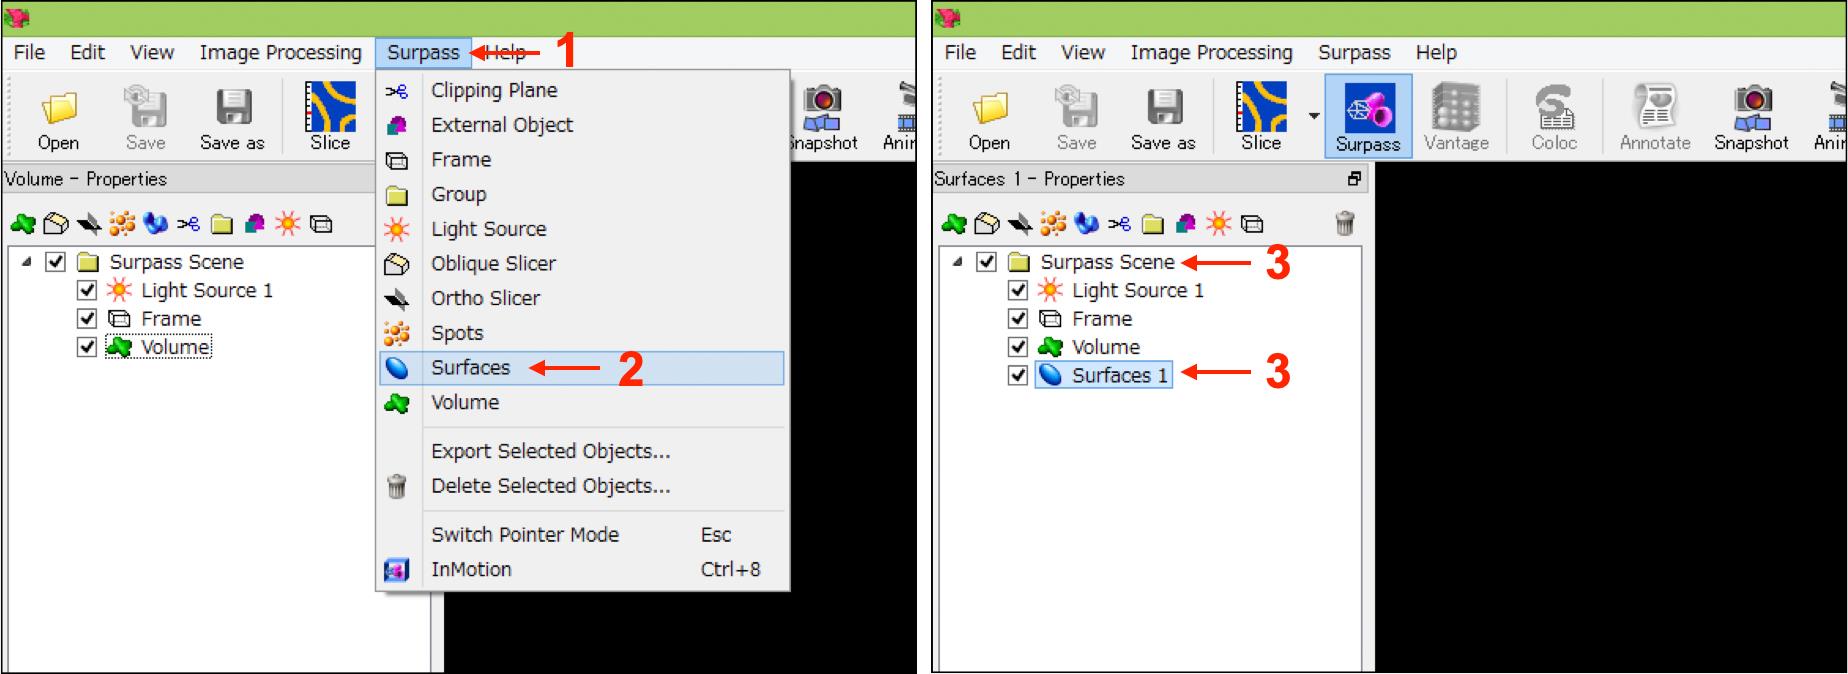
Figure 3. IMARIS interfaces in step A-2. Numbers indicate the sequence of procedures.[Step 1/4 Algorithm] Select “Surfaces 1” in the “Surpass Scene” folder (Figure 3, No.3), and select “Default” in “Load Parameters” in the “Create” tab shown in the bottom box of the IMARIS interface (Figure 4A, No.1 and No.2). Then press the “Next” button (Figure 4A, No.3).
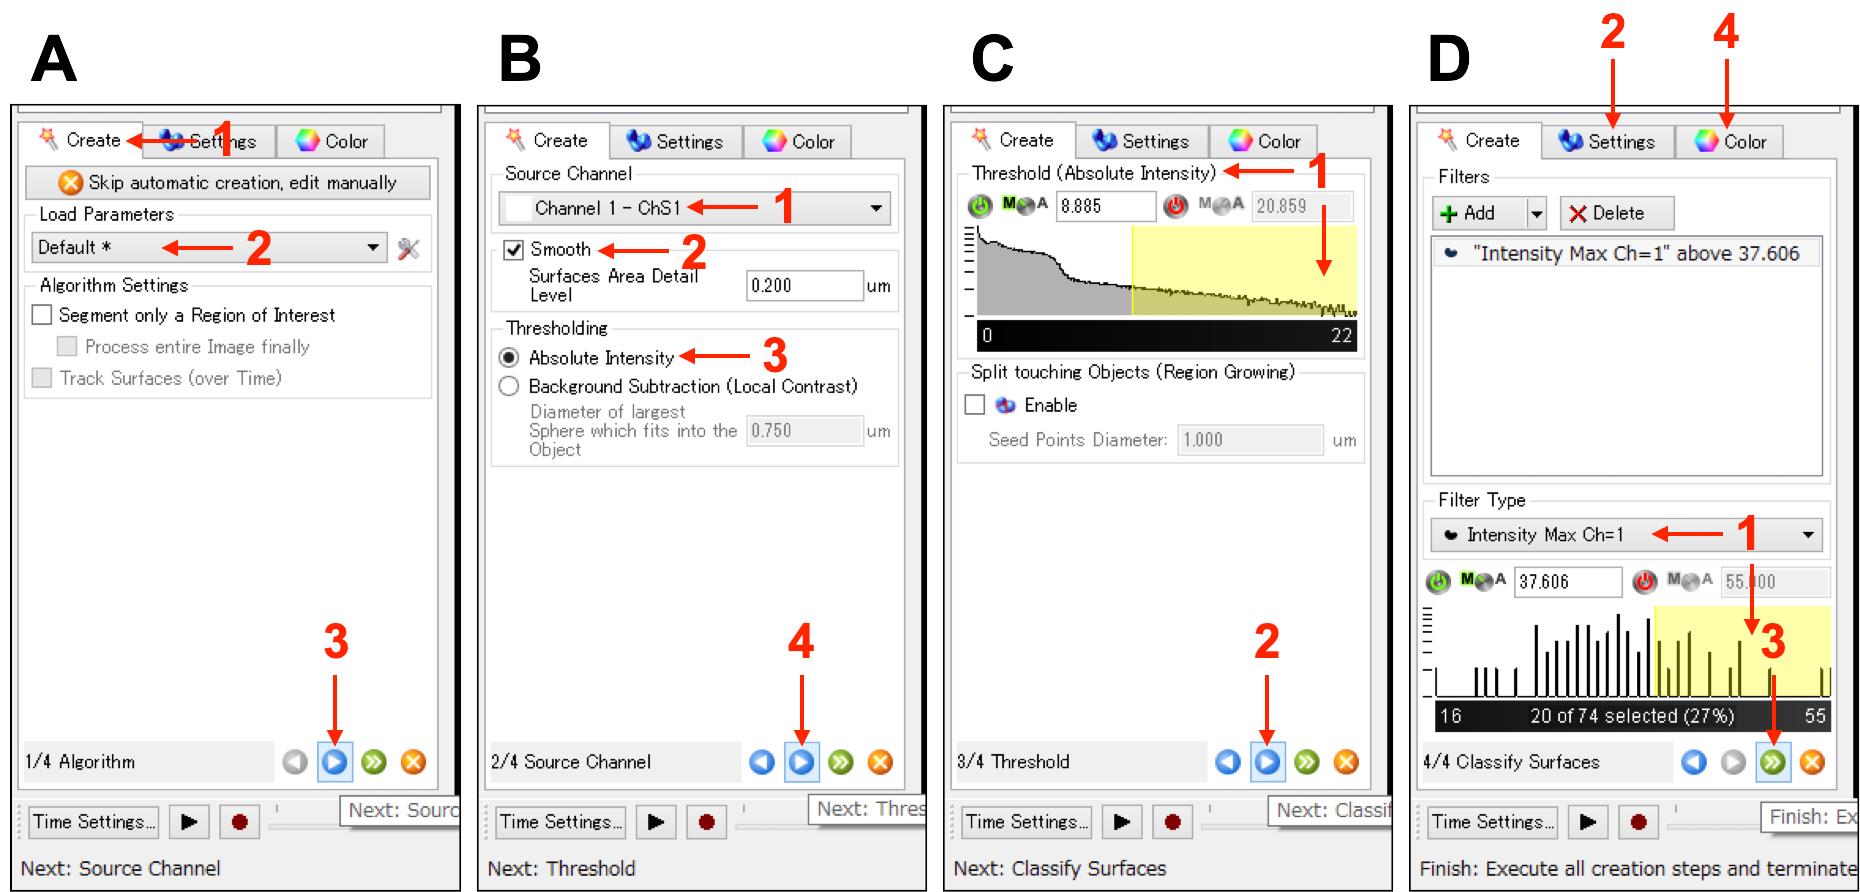
Figure 4. IMARIS interfaces in steps A3-A6. Panels (A-D) indicate the sequence of procedures in steps A3-A6.[Step 2/4 Source Channel] Select the channel of interest from “Source Channel”, and check “Smooth” (Figure 4B, No.1 and No.2) “Surfaces Area Detail Level” is originally set to 0.2 µm, which affects the smooth level of 3D reconstruction. Then select “Absolute Intensity” in “Thresholding”, and press the “Next” button, which will result in generating a 3D reconstruction (Figure 4B, No.3 and No.4).
[Step 3/4 Threshold] Quality of generated 3D reconstruction will be revised by adjusting the upper/lower limit values (active zone is indicated by yellow) of “Threshold”. Then press the “Next” button (Figure 4C, No.1 and No.2).
[Step 4/4 Classify Surfaces] Select the “Filter Type,” and/or adjust the upper/lower limit values of the histogram (active zone is indicated by yellow), to optimize the morphology of the generated 3D reconstruction (Figure 4D, No.1). If the 3D reconstruction is not visible, select “Surface” in “Surfaces Style/Quality” of the “Settings” tab (Figure 4D, No.2). Then press the “Finish” button (Figure 4D, No.3). Colors and transparency can be changed using the “Color” tab shown in the left bottom of the IMARIS interface (Figure 4D, No.4).
Repeat steps A2-A6 until the complete structure of interest is reconstructed.
Select “Show Display Adjustment” from the “Edit” tab, and the uncheck mark in all channels to hide the original fluorescent objects (Figure 5, No.1-No.3).
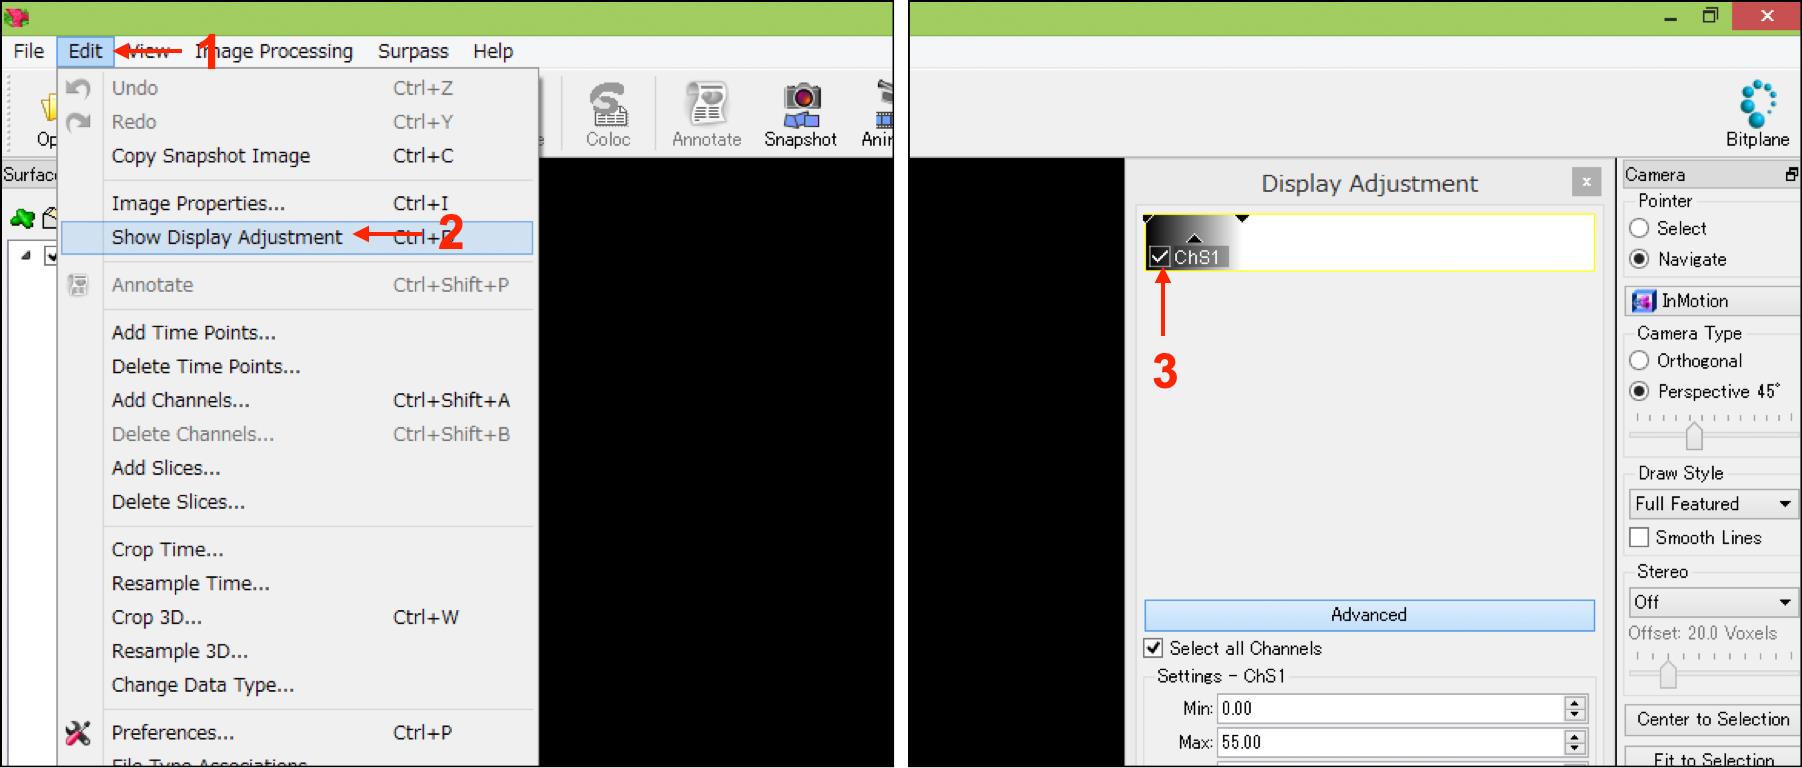
Figure 5. IMARIS interfaces in step A8. Numbers indicate the sequence of procedures.Save the file using bitplane format.
A time-lapse movie file is generated by selecting ”recording (red circle)” shown in the left bottom of the Imaris interface. Examples of time-lapse images and 3D reconstructions of a migrating neuroblast and its primary cilium are shown in Figure 6, and in Matsumoto et al. (2019) .
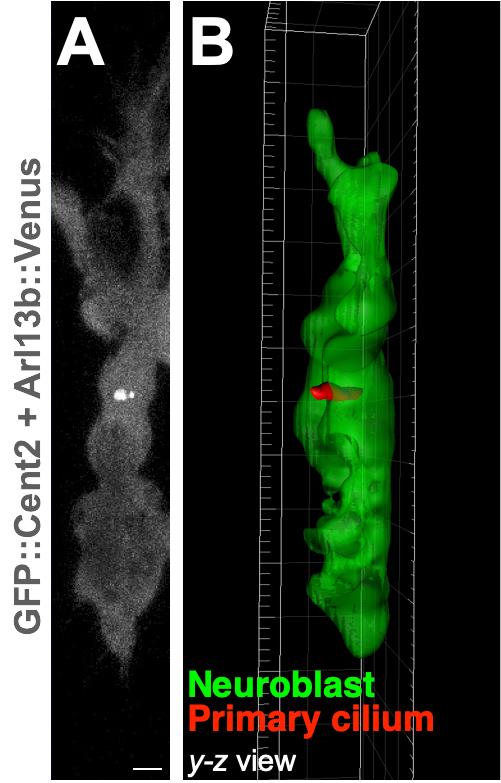
Figure 6. Examples of a time-lapse image and 3D reconstruction of a cultured migrating neuroblast and its primary cilium. Representative time-lapse image of a cultured migrating neuroblast expressing GFP::Cent2 and Arl13b::Venus (A) and its 3D reconstruction (B). Arl13b::Venus+ primary cilium and GFP::Cent2+ basal body are shown in white (A). Green and red colors in (B) indicate cell body and primary cilium of a neuroblast, respectively. Scale bar, 2 µm (A). Images are modified from Matsumoto et al. (2019) with permission.
Analyses of dynamics of migrating neuroblasts and their ciliary structures
Convert the imaging file to an image sequence (e.g., .tif format). In the case of superresolution imaging, first make super-resolution images from the raw data by using the microscope supplier’s software (e.g., ZEN for Carl Zeiss), and then convert it to an image sequence.
Open the image sequence file in FIJI.
Select the “Manual Tracking” plugin from “Plugins” -> “Tracking”.
Enter the parameters for “Time-interval” and “x/y calibration” (resolution) (Figure 7, No.1), which are available in the original imaging files (format for confocal microscope supplier).
Press “Add track” in the Tracking section to start tracking of the structure of interest (cell, basal body, microtubule plus-end, etc.) (Figure 7, No.2). Since the somata change their morphology during saltatory neuronal movement, keep clicking at the center of the soma (center of longitudinal and transverse axes) for analysis of somal movement in migrating neuroblasts. For smaller cellular structures, including basal body and microtubule plus-end proteins, we trace the center of dot-like fluorescent signals.
After tracking several sequential images, press “End track” in the Tracking section to finish tracking (Figure 7, No.3).
Repeat steps B5 and B6 until all of the structure of interest are traced.
After finishing tracking, put a check mark in the box “Show text?” in the Drawing section (Figure 7, No.4), and generate a new file containing all the traces by pressing “Overlay Dots and Lines” in the Drawing section (Figure 7, No.5). Save the generated file as a tif file (Figure 8, Video 1). This file is useful for referring to tracking numbers in step B11.
 Video 1. Manual tracking of neuroblast’s soma (No.2, green) and basal body (No.1, blue)
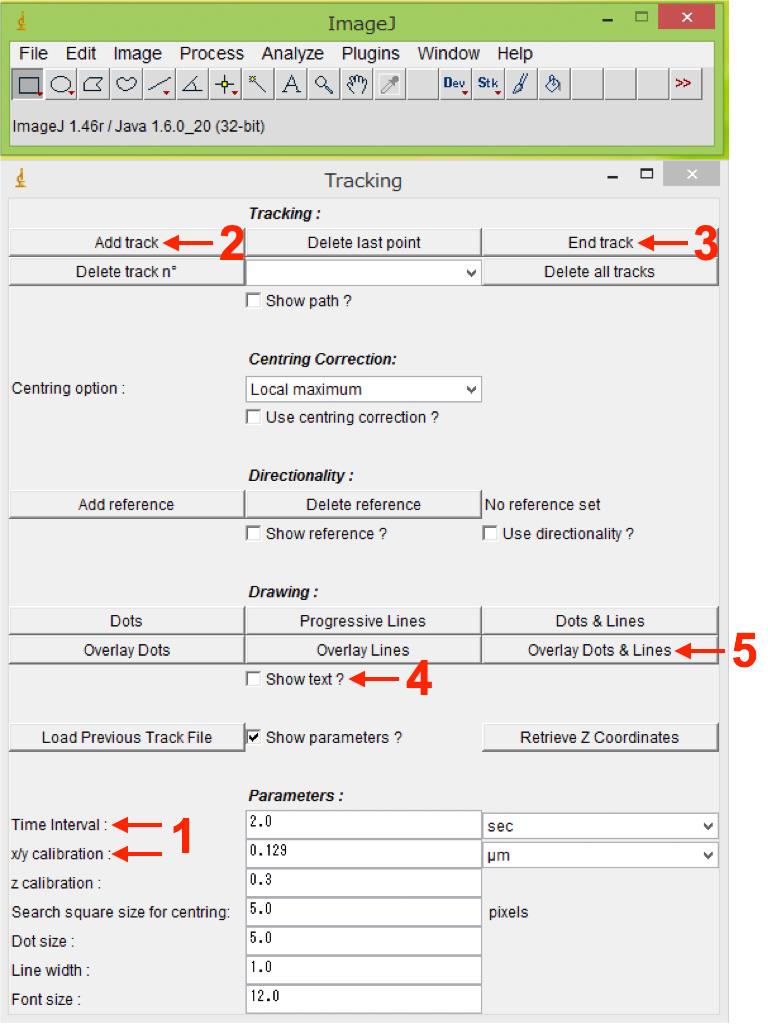
Figure 7. Analysis of dynamics of migrating neuroblasts and their ciliary structures using FIJI. Manual Tracking plugin interface in FIJI is shown. Numbers indicate the sequence of procedures.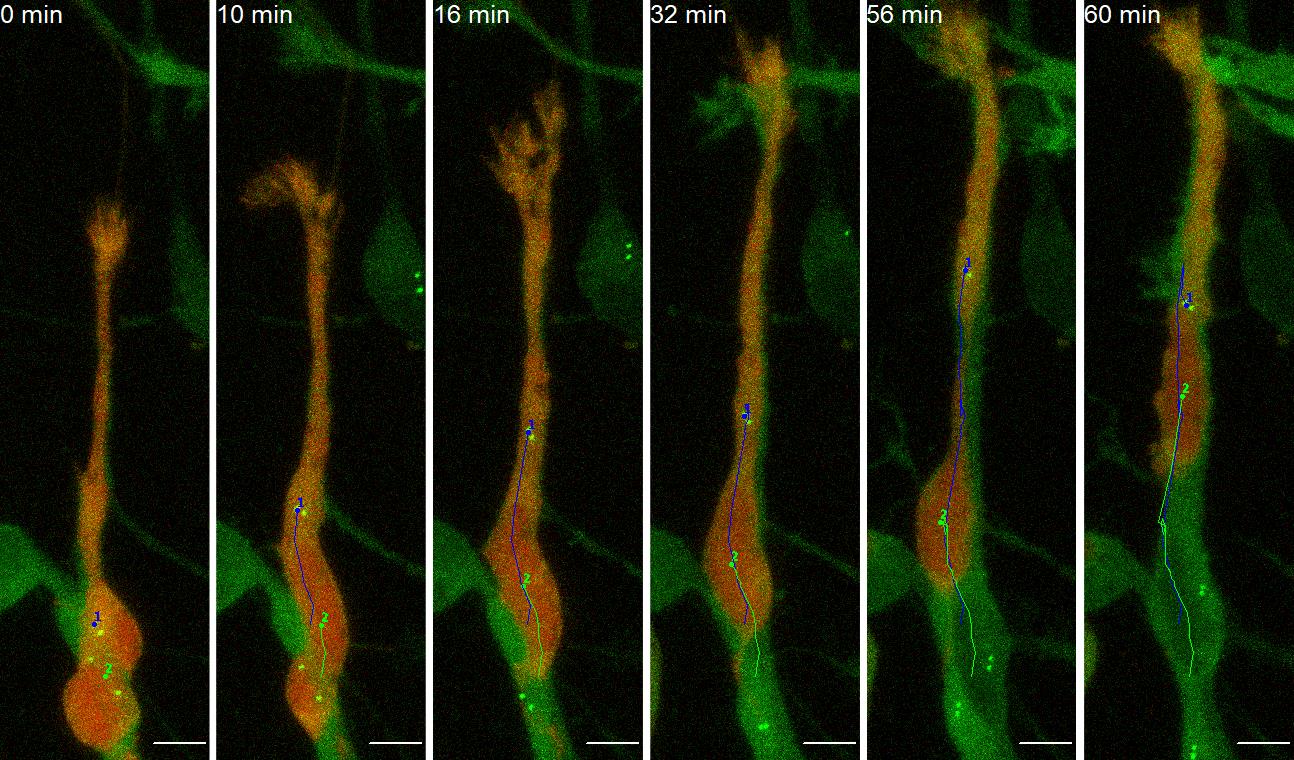
Figure 8. Representative images of manual tracking of neuroblast’s soma (No.2, green) and basal body (No.1, blue). Scale bars, 5 µm. Images are modified from Matsumoto et al. (2019) with permission. Also see Video 1.Save the generated table recording the tracking results as a .csv file.
Open the table file (.csv or .xls) using Microsoft Excel.
Relative coordinates, migration distance, and migration speed in every session of all the tracked structures are shown. Tracking number in the table corresponds to the number in the tif file generated in step B8. Calculate net migration speed by averaging migration speed in every session.
For saltatory migration analysis, migratory behavior of neuroblasts is divided into two phases, resting and migratory phases, based on the speed criterion (12 µm/h) (Matsumoto et al., 2019), which depends on the cell types and experimental conditions. Measure the exact time of resting/migratory phases in one saltatory migration cycle.
For analyses of subcellular structure dynamics (leading process, basal body, microtubule plus-end, etc.), analyze their direction, trajectory, migration distance (stride), and speed based on the numerical data obtained in step B9. Direction, trajectory, and stride of subcellular structures are visualized by making a graph using the relative coordination data. Speed of subcellular structures is analyzed as described in step B11. By combining the information for resting and migratory phases (step B12), dynamics of subcellular structures in those migration phases will also be analyzed. Perform statistical analyses using EZR (Kanda, 2013).
Examples of quantitative analyses of the dynamics of the leading process, basal body, soma, and microtubule polymerization during saltatory movement in cultured migrating neuroblasts are shown in (Matsumoto et al., 2019).
Recipes
Neurobasal final medium (can be stored at 4 °C for up to one week)
Neurobasal medium 10 ml
2% NeuroBrew-21
2 mM L-glutamine
50 U/ml penicillin-streptomycin60% Matrigel/L15 (store at 4 °C, freshly prepared on the day of each experiment)
Matrigel 60 µl
Leibovitz’s L-15 medium 40 µlDNase I solution (can be stored at 4 °C for up to one week)
1 mg/ml DNase 400 µl
Leibovitz’s L-15 medium 10 ml10% FBS/L15 (can be stored at 4 °C for up to one month)
FBS 1 ml
Leibovitz’s L-15 medium 9 ml
Acknowledgments
We thank J. G. Gleeson, M. K. Kaibuchi, and S. Ge for materials; and H. Oishi and H. Takase for technical support. This work was supported by research grants from the Japan Agency for Medical Research and Development (AMED) (JP19bm0704033 [to K.S.], JP19gm1210007 [to K.S.], JP19jm0210060 [to M.S. and K.S.]), Japan Society for the Promotion of Science (JSPS) KAKENHI (17H01392, 19H04757, 19H04785, 18KK0213 [to K.S.], 18K14823 [to M.S.], 16J00373 [to M.M.]), Bilateral Open Partnership Joint Research Projects to K.S.), Grant-in-Aid for Research at Nagoya City University [to K.S.], Cooperative Study Programs of National Institute for Physiological Sciences [to K.S.], the Mitsubishi Foundation [to K.S.], the Canon Foundation [to K.S.], the Uehara Memorial Foundation [to K.S.], the Takeda Science Foundation [to K.S. and M.S.]. M.M. was supported by a JSPS Fellowship. This protocol was originally described by Matsumoto et al. (2019).
Competing interests
The authors declare no competing interests.
Ethics
All experiments involving live animals were performed in accordance with the guidelines and regulations of Nagoya City University (Approval ID, H27M-10; Validity period, April 2015 – March 2020).
References
- Arvidsson, A., Collin, T., Kirik, D., Kokaia, Z. and Lindvall, O. (2002). Neuronal replacement from endogenous precursors in the adult brain after stroke. Nat Med 8(9): 963-970.
- Baudoin, J. P., Viou, L., Launay, P. S., Luccardini, C., Espeso Gil, S., Kiyasova, V., Irinopoulou, T., Alvarez, C., Rio, J. P., Boudier, T., Lechaire, J. P., Kessaris, N., Spassky, N. and Metin, C. (2012). Tangentially migrating neurons assemble a primary cilium that promotes their reorientation to the cortical plate. Neuron 76(6): 1108-1122.
- Belvindrah, R., Nissant, A. and Lledo, P. M. (2011). Abnormal neuronal migration changes the fate of developing neurons in the postnatal olfactory bulb. J Neurosci 31(20): 7551-7562.
- Breton-Provencher, V., Lemasson, M., Peralta, M. R. and Saghatelyan, A. (2009). Interneurons produced in adulthood are required for the normal functioning of the olfactory bulb network and for the execution of selected olfactory behaviors. J Neurosci 29(48): 15245-15257.
- Doetsch, F. and Alvarez-Buylla, A. (1996). Network of tangential pathways for neuronal migration in adult mammalian brain. Proc Natl Acad Sci U S A 93(25): 14895-14900.
- Gheusi, G., Cremer, H., McLean, H., Chazal, G., Vincent, J. D. and Lledo, P. M. (2000). Importance of newly generated neurons in the adult olfactory bulb for odor discrimination. Proc Natl Acad Sci U S A 97(4): 1823-1828.
- Guemez-Gamboa, A., Coufal, N. G. and Gleeson, J. G. (2014). Primary cilia in the developing and mature brain. Neuron 82(3): 511-521.
- Guo, J., Otis, J. M., Higginbotham, H., Monckton, C., Cheng, J., Asokan, A., Mykytyn, K., Caspary, T., Stuber, G. D. and Anton, E. S. (2017). Primary cilia signaling shapes the development of interneuronal connectivity. Dev Cell 42(3): 286-300e284.
- Higginbotham, H., Bielas, S., Tanaka, T. and Gleeson, J. G. (2004). Transgenic mouse line with green-fluorescent protein-labeled Centrin 2 allows visualization of the centrosome in living cells. Transgenic Res 13(2): 155-164.
- Higginbotham, H., Eom, T. Y., Mariani, L. E., Bachleda, A., Hirt, J., Gukassyan, V., Cusack, C. L., Lai, C., Caspary, T. and Anton, E. S. (2012). Arl13b in primary cilia regulates the migration and placement of interneurons in the developing cerebral cortex. Dev Cell 23(5): 925-938.
- Hirota, Y., Ohshima, T., Kaneko, N., Ikeda, M., Iwasato, T., A.B., Kulkarni., Mikoshiba, K., Okano, H. and Sawamoto, K. (2007). Cyclin-dependent kinase 5 is required for control of neuroblast migration in the postnatal subventricular zone. J Neurosci 27(47): 12829-122838.
- Jinnou, H., Sawada, M., Kawase, K., Kaneko, N., Herranz-Pérez, V., Miyamoto, T., Kawaue, T., Miyata, T., Tabata, Y., Akaike, T., García-Verdugo, J. M., Ajioka, I., Saitoh, S. and Sawamoto, K. (2018). Radial glial fibers support neuronal migration and regeneration after neonatal brain injury. Cell Stem Cell 22: 128-137.
- Kanda, Y., (2013). Investigation of the freely available easy-to-use software'EZR' for medical statistics. Bone Marrow Transplant 48(3): 452-458.
- Kaneko, N., Herranz-Perez, V., Otsuka, T., Sano, H., Ohno, N., Omata, T., Nguyen, H. B., Thai, T. Q., Nambu, A., Kawaguchi, Y., Garcia-Verdugo, J. M. and Sawamoto, K. (2018). New neurons use Slit-Robo signaling to migrate through the glial meshwork and approach a lesion for functional regeneration. Sci Adv 4(12): eaav0618.
- Kreuzberg, M., Kanov, E., Timofeev, O., Schwaninger, M., Monyer, H. and Khodosevich, K. (2010). Increased subventricular zone-derived cortical neurogenesis after ischemic lesion. Exp Neurol 226(1): 90-99.
- Lois, C. and Alvarez-Buylla, A. (1994). Long-distance neuronal migration in the adult mammalian brain. Science 264(5162): 1145-1148.
- Lois, C., Garcia-Verdugo, J. M. and Alvarez-Buylla, A. (1996). Chain migration of neuronal precursors. Science 271(5251): 978-981.
- Luskin, M. B., (1993). Restricted proliferation and migration of postnatally generated neurons derived from the forebrain subventricular zone. Neuron 11(1): 173-189.
- Malicki, J. J. and Johnson, C. A. (2017). The cilium: cellular antenna and central processing unit. Trends Cell Biol 27(2): 126-140.
- Matsumoto, M., Sawada, M., Garcia-Gonzalez, D., Herranz-Perez, V., Ogino, T., Bang Nguyen, H., Quynh Thai, T., Narita, K., Kumamoto, N., Ugawa, S., Saito, Y., Takeda, S., Kaneko, N., Khodosevich, K., Monyer, H., Garcia-Verdugo, J. M., Ohno, N. and Sawamoto, K. (2019). Dynamic changes in ultrastructure of the primary cilium in migrating neuroblasts in the postnatal brain. J Neurosci 39(50): 9967-9988.
- Mirzadeh, Z., Doetsch, F., Sawamoto, K., Wichterle, H. and Alvarez-Buylla, A. (2010). The subventricular zone en-face: wholemount staining and ependymal flow. J Vis Exp (39).
- Moreno, M. M., Linster, C., Escanilla, O., Sacquet, J., Didier, A. and Mandairon, N. (2009). Olfactory perceptual learning requires adult neurogenesis. Proc Natl Acad Sci U S A 106(42): 17980-17985.
- Obernier, K. and Alvarez-Buylla, A. (2019). Neural stem cells: origin, heterogeneity and regulation in the adult mammalian brain. Development 146(4).
- Ota, H., Hikita, T., Sawada, M., Nishioka, T., Matsumoto, M., Komura, M., Ohno, A., Kamiya, Y., Miyamoto, T., Asai, N., Enomoto, A., Takahashi, M., Kaibuchi, K., Sobue, K. and Sawamoto, K. (2014). Speed control for neuronal migration in the postnatal brain by Gmip-mediated local inactivation of RhoA. Nat Commun 5: 4532.
- Parent, J. M., Vexler, Z. S., Gong, C., Derugin, N. and Ferriero, D. M. (2002). Rat forebrain neurogenesis and striatal neuron replacement after focal stroke. Ann Neurol 52(6): 802-813.
- Petri, R., Pircs, K., Jonsson, M. E., Akerblom, M., Brattas, P. L., Klussendorf, T. and Jakobsson, J. (2017). let-7 regulates radial migration of new-born neurons through positive regulation of autophagy. EMBO J 36(10): 1379-1391.
- Sakamoto, M., Ieki, N., Miyoshi, G., Mochimaru, D., Miyachi, H., Imura, T., Yamaguchi, M., Fishell, G., Mori, K., Kageyama, R. and Imayoshi, I. (2014). Continuous postnatal neurogenesis contributes to formation of the olfactory bulb neural circuits and flexible olfactory associative learning. J Neurosci 34(17): 5788-5799.
- Sakamoto, M., Imayoshi, I., Ohtsuka, T., Yamaguchi, M., Mori, K. and Kageyama, R. (2011). Continuous neurogenesis in the adult forebrain is required for innate olfactory responses. Proc Natl Acad Sci U S A 108(20): 8479-8484.
- Sawada, M., Ohno, N., Kawaguchi, M., Huang, S. H., Hikita, T., Sakurai, Y., Bang Nguyen, H., Quynh Thai, T., Ishido, Y., Yoshida, Y., Nakagawa, H., Uemura, A. and Sawamoto, K. (2018). PlexinD1 signaling controls morphological changes and migration termination in newborn neurons. EMBO J 37(4): e97404.
- Schaar, B. T. and McConnell, S. K. (2005). Cytoskeletal coordination during neuronal migration. Proc Natl Acad Sci U S A 102(38): 13652-13657.
- Schindelin, J., Arganda-Carreras, I., Frise, E., Kaynig, V., Longair, M., Pietzsch, T., Preibisch, S., Rueden, C., Saalfeld, S., Schmid, B., Tinevez, J. Y., White, D. J., Hartenstein, V., Eliceiri, K., Tomancak, P. and Cardona, A. (2012). Fiji: an open-source platform for biological-image analysis. Nat Methods 9(7): 676-682.
- Trivedi, N., Ramahi, J. S., Karakaya, M., Howell, D., Kerekes, R. A. and Solecki, D. J. (2014). Leading-process actomyosin coordinates organelle positioning and adhesion receptor dynamics in radially migrating cerebellar granule neurons. Neural Dev 9: 26.
- Trivedi, N., Stabley, D. R., Cain, B., Howell, D., Laumonnerie, C., Ramahi, J. S., Temirov, J., Kerekes, R. A., Gordon-Weeks, P. R. and Solecki, D. J. (2017). Drebrin-mediated microtubule-actomyosin coupling steers cerebellar granule neuron nucleokinesis and migration pathway selection. Nat Commun 8: 14484.
- Watanabe, T., Kakeno, M., Matsui, T., Sugiyama, I., Arimura, N., Matsuzawa, K., Shirahige, A., Ishidate, F., Nishioka, T., Taya, S., Hoshino, M. and Kaibuchi, K. (2015). TTBK2 with EB1/3 regulates microtubule dynamics in migrating cells through KIF2A phosphorylation. J Cell Biol 210(5): 737-751.
- Yamashita, T., Ninomiya, M., Hernández Acosta, P., García-Verdugo, J. M., Sunabori, T., Sakaguchi, M., Adachi, K., Kojima, T., Hirota, Y., Kawase, T., Araki, N., Abe, K., Okano, H. and Sawamoto, K. (2006). Subventricular zone-derived neuroblasts migrate and differentiate into mature neurons in the post-stroke adult striatum. J Neurosci 26(24): 6627-6636.
- Yang, Z., Covey, M. V., Bitel, C. L., Ni, L., Jonakait, G. M. and Levison, S. W. (2007). Sustained neocortical neurogenesis after neonatal hypoxic/ischemic injury. Ann Neurol 61(3): 199-208.
- Yang, Z., You, Y. and Levison, S. W. (2008). Neonatal hypoxic/ischemic brain injury induces production of calretinin-expressing interneurons in the striatum. J Comp Neurol 511(1): 19-33.
Article Information
Copyright
© 2020 The Authors; exclusive licensee Bio-protocol LLC.
How to cite
Readers should cite both the Bio-protocol article and the original research article where this protocol was used:
- Sawada, M., Matsumoto, M., Narita, K., Kumamoto, N., Ugawa, S., Takeda, S. and Sawamoto, K. (2020). In vitro Time-lapse Imaging of Primary Cilium in Migrating Neuroblasts. Bio-protocol 10(22): e3823. DOI: 10.21769/BioProtoc.3823.
- Matsumoto, M., Sawada, M., Garcia-Gonzalez, D., Herranz-Perez, V., Ogino, T., Bang Nguyen, H., Quynh Thai, T., Narita, K., Kumamoto, N., Ugawa, S., Saito, Y., Takeda, S., Kaneko, N., Khodosevich, K., Monyer, H., Garcia-Verdugo, J. M., Ohno, N. and Sawamoto, K. (2019). Dynamic changes in ultrastructure of the primary cilium in migrating neuroblasts in the postnatal brain. J Neurosci 39(50): 9967-9988.
Category
Neuroscience > Cellular mechanisms
Developmental Biology > Cell growth and fate > Neuron
Cell Biology > Cell imaging > Confocal microscopy
Do you have any questions about this protocol?
Post your question to gather feedback from the community. We will also invite the authors of this article to respond.