- Protocols

- Articles and Issues
- For Authors
- About
- Become a Reviewer

Measurement of Protein-Protein Interactions through Microscale Thermophoresis (MST)

Published: Vol 10, Iss 7, Apr 5, 2020 DOI: 10.21769/BioProtoc.3574 Views: 8886
Reviewed by: Joana Alexandra Costa ReisMarc-Antoine SaniXiaoxiao Cheng
Original research article
The authors used this protocol in:

Dec 2017

Protocol Collections
Comprehensive collections of detailed, peer-reviewed protocols focusing on specific topics


Related protocols
Abstract
The binding interactions of PD-1 and PD-L1 have been studied by surface plasmon resonance (SPR) and isothermal titration calorimetry (ITC) over the past few years, but these investigations resulted in controversy regarding the values of the dissociation constant (Kd) (Freeman et al., 2000). MST is a powerful new method for the quantitative analysis of protein-protein interactions (PPIs) with low sample consumption. The technique is based on the movement of molecules along microscopic temperature gradients, and it detects changes in their hydration shell, charge or size. One binding partner is fluorescently labeled, while the other binding partner remains label-free. We used a protocol that allows the determination of the binding affinity by MST without purification of the target protein from the cell lysate. The application of this MST method to PD-1-eGFP and PD-L1-eGFP expressed in CHO-K1 cells allowed us, for the first time, to determine the affinity of the complex formed between PD-1 and its ligand PD-L1 during tumor escape. The protocol has a variety of potential applications for studying the interactions of proteins with small molecules.
Keywords: Microscale thermophoresisBackground
The identification of compounds that might be able to modulate the affinity of the complex formed between PD-1 and PD-L1 represents a major advance in the development of new treatments targeting immune escape for oncology. This protocol involves the overexpression of an eGFP fusion protein, which is then extracted from the cell lysate, enabling the determination of the affinity constant between PD-1 and PD-L1 without any purification steps. Thus, the development of this protocol required the production of eGFP fusion proteins. This protocol was designed to quantitatively accelerate the characterization of protein interactions by avoiding tedious purification steps. This protocol could also be used to perform high-throughput screening with PD-1/PD-L1 inhibitors to evaluate the ability of these recently developed molecules to modulate the affinity of the PD-1 protein for its ligand, as the small-molecule “blocking pathway” represents a major challenge for the development of new strategies targeting immune escape for oncology.
Microscale thermophoresis (MST) is a biophysical technique that measures the strength of the interaction between two molecules by detecting variations in the fluorescence signal as a result of an IR laser-induced temperature change. The range of the variation in the fluorescence signal correlates with the binding of a ligand to the fluorescent target. Overall, MST is based on the movement of a fluorescent molecule within a temperature gradient. MST also has broad applications at concentrations ranging from picomolar to molar and involves very little sample consumption, requiring only a few microliters; in addition, no immobilization of the protein of interest is required. You can either add a fluorescent tag to your protein of interest or exploit the intrinsic fluorescence of the target. In any case, one binding partner is fluorescent, while the other binding partner remains label-free. MST has also been used to characterize protein-small molecule interactions such as those involving aptamers (Entzian and Schubert, 2016) and PD-L1 inhibitors by BMS (Ganesan et al., 2019) or for high-throughput screening to identify hits (Rainard et al., 2018). Here, we describe a protocol using MST to determine the binding affinity of the PD-1/PD-L1 complex, which is involved in tumor escape processes, without purification of the target protein from cell lysates (Khavrutskii et al., 2013). This method requires the overexpression of fluorescent proteins in CHO-K1 cells and describes the optimal conditions for determining the dissociation constant. The protocol has a variety of potential applications for studying the interactions of these proteins with small molecules and demonstrates that MST is a valuable method for studying the PD-1/PD-L1 pathway.
Materials and Reagents
- T75 flasks
- PCR tubes (20 µl; NanoTemper Technologies GmbH, Munich, Germany)
- Thermo ClipTip tip 300 volume 30-300 µl (Dominique DUTSCHER SAS, catalog number: 228370 )
- Thermo ClipTip tip 12.5 volume 0.5-12.5 µl (Dominique DUTSCHER SAS, catalog number: 228606 )
- MonolithTM NT.115 Series, Premium Capillaries (NanoTemper Technologies GmbH, catalog number: MO-K025–200 Count )
- CHO-K1 cells (ATCC, catalog number: CCL-61 ), -80 °C
- Mix & Go competent E. coli cells (Zymo Research, catalog number: T3009 )
- GFP dosage kit (Abnova, catalog number: KA0911 ), 4 °C
- pcDNA3.1 plasmid (Life Technologies, catalog number: V79520 ), -20 °C
- pcDNA3.1 Hygro plasmid (Life Technologies, catalog number: V870-20 ), -20 °C
- Plasmid hPD-L1-eGFP (GeneCopoeia, CS-GS402 L-M10/pReceiver-M10 ), -20 °C
- Plasmid with mutant variant of hPD-L1-eGFP (GeneCopoeia, CS-GS406 L-M10/pReceiver-M10 ), 20 °C
- GeneticinTM Selective Antibiotic (Thermo Fisher Scientific, catalog number: 10131035 )
- DNA polymerase (CliniSciences Kapa HiFi HotStart Readymix), -20 °C
- PCR clean-up gel extraction kit (Machery-Nagel, catalog number: 740609.250 ), RT-qPCR
- Mini Plasmid Prep Kit (Machery-Nagel, catalog number: 740588.250 )
- Cell Line Nucleofector® Kit T (Lonza, catalog number: VVCA-1002 )
- HaltTM Protease Inhibitor Cocktail, EDTA-Free (Thermo Fisher Scientific, catalog number: 78439 )
- RIPA Lysis and Extraction Buffer (Thermo Fisher Scientific, catalog number: 89900 )
- Trypsin-EDTA solution (Merck, catalog number: T4049-100 ML )
- Complete medium: Ham's F-12K (Kaighn's) Medium (Thermo Fisher Scientific, catalog number: 21127 )
- 1% penicillin-streptomycin (10,000 U/ml) (Thermo Fisher Scientific, catalog number: 15140122 )
- 10% Foetal Bovine Serum (FBS) South America (Biosera, catalog number: FB-1001 )
- PBS (1x) (Thermo Fisher Scientific, catalog number: 12559069 )
- PBS-T (1x), phosphate-buffered saline with Tween-20 (NanoTemper Technologies GmbH, Munich, Germany)
- Recombinant human PD-L1/B7-H1 (Biotechne, catalog number: 156-B7-100 )
- (Optional) DMSO
- (Optional) Glycerol
Equipment
- Thermo Scientific ClipTip Pipettes (ClipTipTM 300 µl and ClipTipTM 12.5 µl)
- NanoTemper® Monolith NT.115 with blue/red filters (NanoTemper Technologies GmbH, Munich, Germany)
- NucleofectorTM 2b device (Lonza, Basel, Switzerland)
- Centrifuge (Sigma Labourzentrifugen GmbH, model: SIGMA 3-16KL )
- Flow Cytometer (BD FACS Aria)
- Inverted laboratory microscope with LED illumination (Leica Microsystems)
Software
- NanoTemper® (MO. Control) (https://nanotempertech.com/monolith-mo-control-software)
- NanoTemper® (MO. AffinityAnalysis(x86)) (https://nanotempertech.com/monolith-mo-control-software/)
Procedure
- Cell culture
- CHO-K1 cells were cultured in Ham’s F12 Nutrient mixture with 1% P/S and 10% FBS.
- Cells were passaged every 3 days.
- The subculturing of the cells requires their detachment from the support and their separation, which is performed by the action of a proteolytic enzyme, trypsin. The action of trypsin must be stopped by adding complete medium. A volume of 1.5 ml of 0.25% trypsin was introduced into the flask, which was then placed in an incubator (5 min at 37 °C). It is possible to assist the detachment by gently shaking the box. The action of trypsin was then stopped. A volume of 3.5 ml of supplemented complete medium was added to the flask. The cells were carefully homogenized by pipetting up and down. The volume of cell suspension and the volume of medium to be introduced into each flask were calculated depending on how many cells were needed to perform the MST experiments. The flasks were then placed in the incubator at 37 °C. Every two days, the culture medium was replaced, and the cells were observed. The subculture rate was adapted according to the growth rate of the cell line used.
- Subculturing/passaging of cells immediately before the plateau is reached, when the cells are still growing exponentially, will result in improved overall cell viability and yield cells that are less aggregated, and this will shorten the lag time. The process does not have to be exact. It involves an estimation within a range. The cells should be between 50% and 100% confluent, which will become easier to estimate as more experience is gained in culturing cells. If in doubt, subculturing cells at between 60% and 90% confluency is best.
- Cell transfection
- Transfect the cells with the Cell Line Nucleofector® Kit T Program U-023 and the pcDNA3.1 Hygro plasmid expressing PD-1-eGFP. Two micrograms of plasmid should be used for one million CHO-K1 cells in 100 µl of Nucleofector solution (Figure 1).
- Incubate the cells for 48 h.
- Select the cells (use the appropriate selective pressure) for 3 weeks. In our case, 10 µl/ml GeneticinTM Selective Antibiotic (Thermo Fisher Scientific) was used.
- Select the subpopulation that strongly expresses eGFP by flow cytometry.
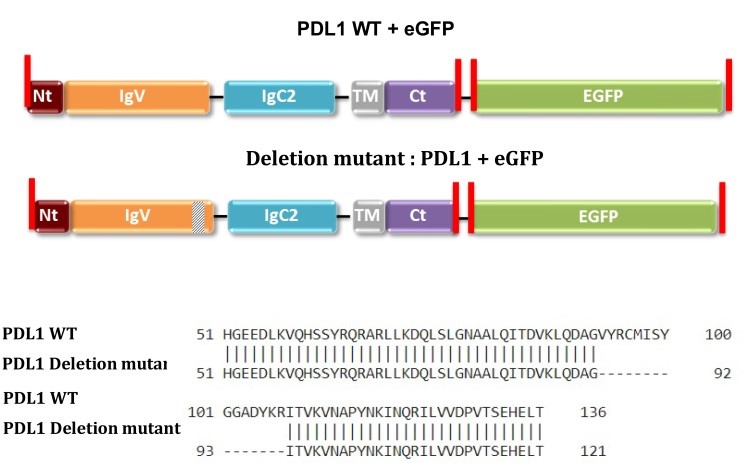
Figure 1. PD-L1 sequences of plasmids purchased from GeneCopoeia (CS-GS402L-M10/pReceiver-M10 and CS-GS406L-M10/pReceiver-M10). Restriction enzyme sites are highlighted in red.
- Protein extraction
- Plate the CHO-K1 cells overexpressing the R-eGFP proteins in T75 flasks.
- Treat the CHO-K1 cells when they reach 80% confluency using an inverted laboratory microscope with LED illumination (Leica Microsystems).
- Wash the cells with 3-5 ml PBS.
- Trypsinize the cells with 1.5 ml trypsin.
- Stop the trypsinization with 3.5 ml of complete medium.
- Centrifuge the cells at 400 x g and 4 °C for 5 min using SIGMA 3-16KL (Sigma Labourzentrifugen GmbH).
- Remove the supernatant.
- Wash the cells with 5 ml of PBS.
- Centrifuge the cells at 400 x g and 4 °C for 5 min.
- Remove the PBS.
- Resuspend the cells in lysis buffer and incubate them for 30 min at 4 °C with 300 µl RIPA buffer + 3 µl HaltTM Protease Inhibitor Cocktail.
- Centrifuge the cells at 25,200 x g and 4 °C for 45 min.
- Aliquot the supernatant.
- Freeze the samples (80 °C) for further investigations.
- PD-1 binding assay
Recommendations:- A stepwise dilution of the ligand in assay buffer should be performed. Typically, a serial 1:1 dilution is performed by transferring one volume of ligand solution into an equal volume of buffer, mixing, and repeating these steps. In this way, the ligand concentration is reduced by 50% for each dilution step (Figure 2).
- Never prepare less than 20 μl of sample. Otherwise, the probability of encountering problems due to evaporation, adsorption of the sample material to the plastic micro reaction tubes and pipetting errors is increased.
- Never prepare small volumes (e.g., 20 μl) in large micro reaction tubes (e.g., 500 μl or more). The high surface-to-volume ratio leads to surface adsorption even for well-behaved proteins. Always use the smallest micro reaction tubes possible (e.g., PCR tubes).
- Always mix very small volumes with a pipette. Do not vortex. Do not flip the tube.
- Avoid any buffer dilution effects. The buffer in tube 1 and the buffer in tubes 2-16 must be the same. Otherwise, you will create a gradient in the concentrations of salt, DMSO, glycerol or other additives. This will bias the MST measurements.
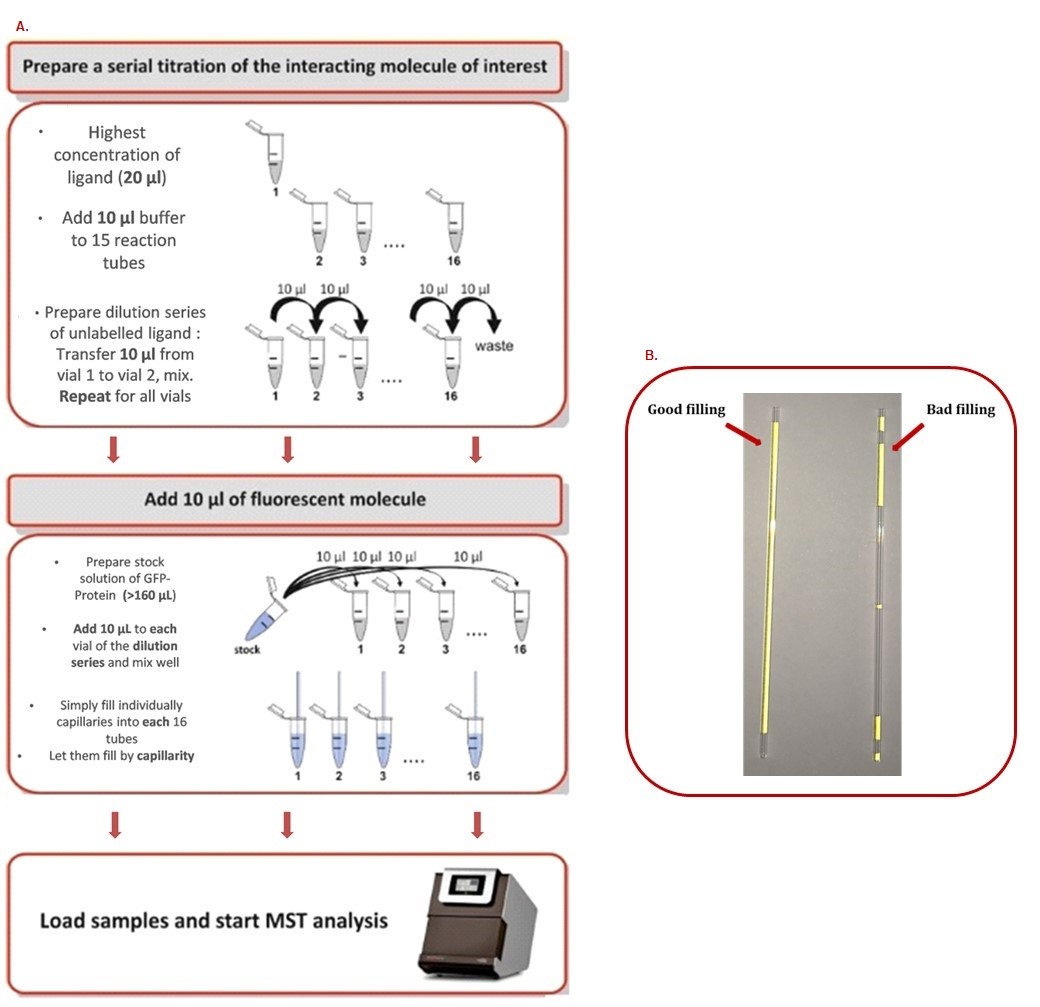
Figure 2. MST step by step procedure. A. How to prepare a serial dilution range. B. How to correctly fill capillaries.
Data analysis
How to determine the concentration of the protein of interest with the Monolith
The fluorescein calibration curve was obtained with the thermophoresis instrument by establishing a range with different concentration points (from 0 to 100 nM). Each concentration was linked to the amount of fluorescein fluorescence (FI units). The concentration of the labeled eGFP protein was determined using the following relationship, which correlates the fluorescein units to the eGFP fluorescence, the quantum yields (φf), and the respective molar extinction coefficients [ε(λ)] at a given excitation wavelength:
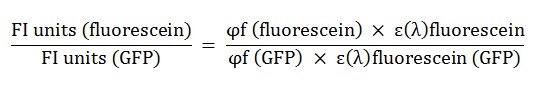
Since the FI units (GFP) were provided by the cap-scan, it was possible to determine the corresponding FI units (fluorescein) with the calibration curve to determine the concentration of the labeled eGFP protein.
Reference Results/Supporting Results:
KD = 8 µM (inter- and cross-species) by MST (Magnez et al., 2017)
KD = 4 µM by ITC (Zhang et al., 2004)
KD = 8 µM (hPD-1 to hPD-L1) and Kd = 29 µM (mPD-1 to mPD-L1) by SPR (Cheng et al., 2013)
Notes
PD-1/PD-L1 binding
The binding between PD-1, various species of PD-L1 (Figure 3) and its deletion mutant (Figure 4) has been studied by MST leading to close dissociation constant. The deletion mutant is used as a negative control and induces no binding which was expected (Figure 4).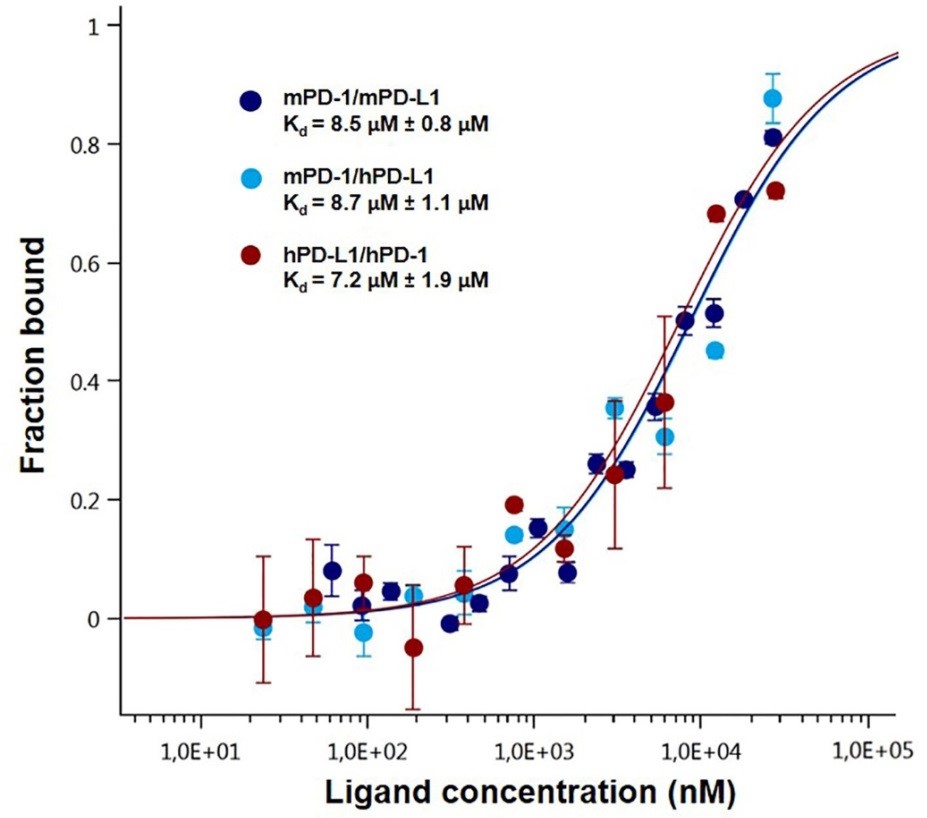
Figure 3. Dose-response curves for the binding interaction between PD-1 and PD-L1. The concentration of PD-1-eGFP or PD-L1-eGFP protein was kept constant at 35 nM, while the ligand concentration varied from 24 µM to 0.7 nM. All three curves are shown as the fraction bound against the ligand concentration to show their similarity regardless of the variation of the concentration of the protein under study. The highest affinity was observed for the human PD-1/PD-L1 interaction (brown), which has a 7.2 µM Kd, whereas the murine variation (dark blue) had an 8.5 µM fitted Kd. The lowest affinity was observed for the cross-species interaction, which has an 8.7 µM dissociation constant (light blue). The experiments were performed at 22 °C with a 30 min incubation at medium MST and LED power.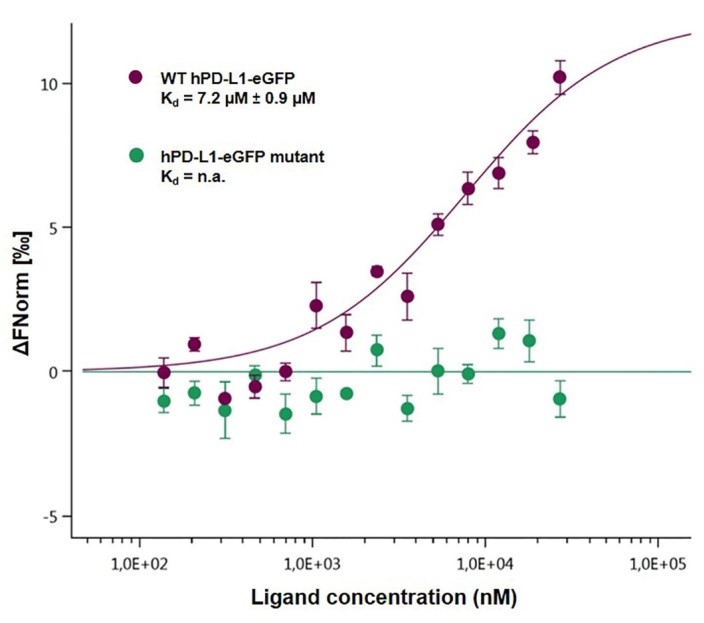
Figure 4. Dose-response curves for the binding interaction between PD-1/hPD-L1-eGFP and its mutant. The concentrations of the hPD-L1-eGFP and hPD-L1-eGFP mutant proteins were kept constant at 35 nM, while the ligand concentration varied from 24 µM to 0.7 nM. There was no binding for the mutant protein (green), leading to a flat curve, while the binding was maintained, as described previously (7.2 µM), for the wild-type protein (purple).
Buffer dependence
To determine the best formulation for the analysis of the interaction between the protein and its ligand, several lysis buffers and several buffers for the analysis of thermographs during thermophoresis were studied. The lysis buffer modulates the fluorescence of the labeled protein. A protease inhibitor cocktail was also added to prevent degradation of the protein of interest. The ideal buffer must provide uniform fluorescence among the sixteen capillaries with a maximum tolerance of 10% from the average. Thermographs should not present a characteristic bumpy curve that indicates the presence of aggregation, which hinders the interpretation of the measurements (Figure 5).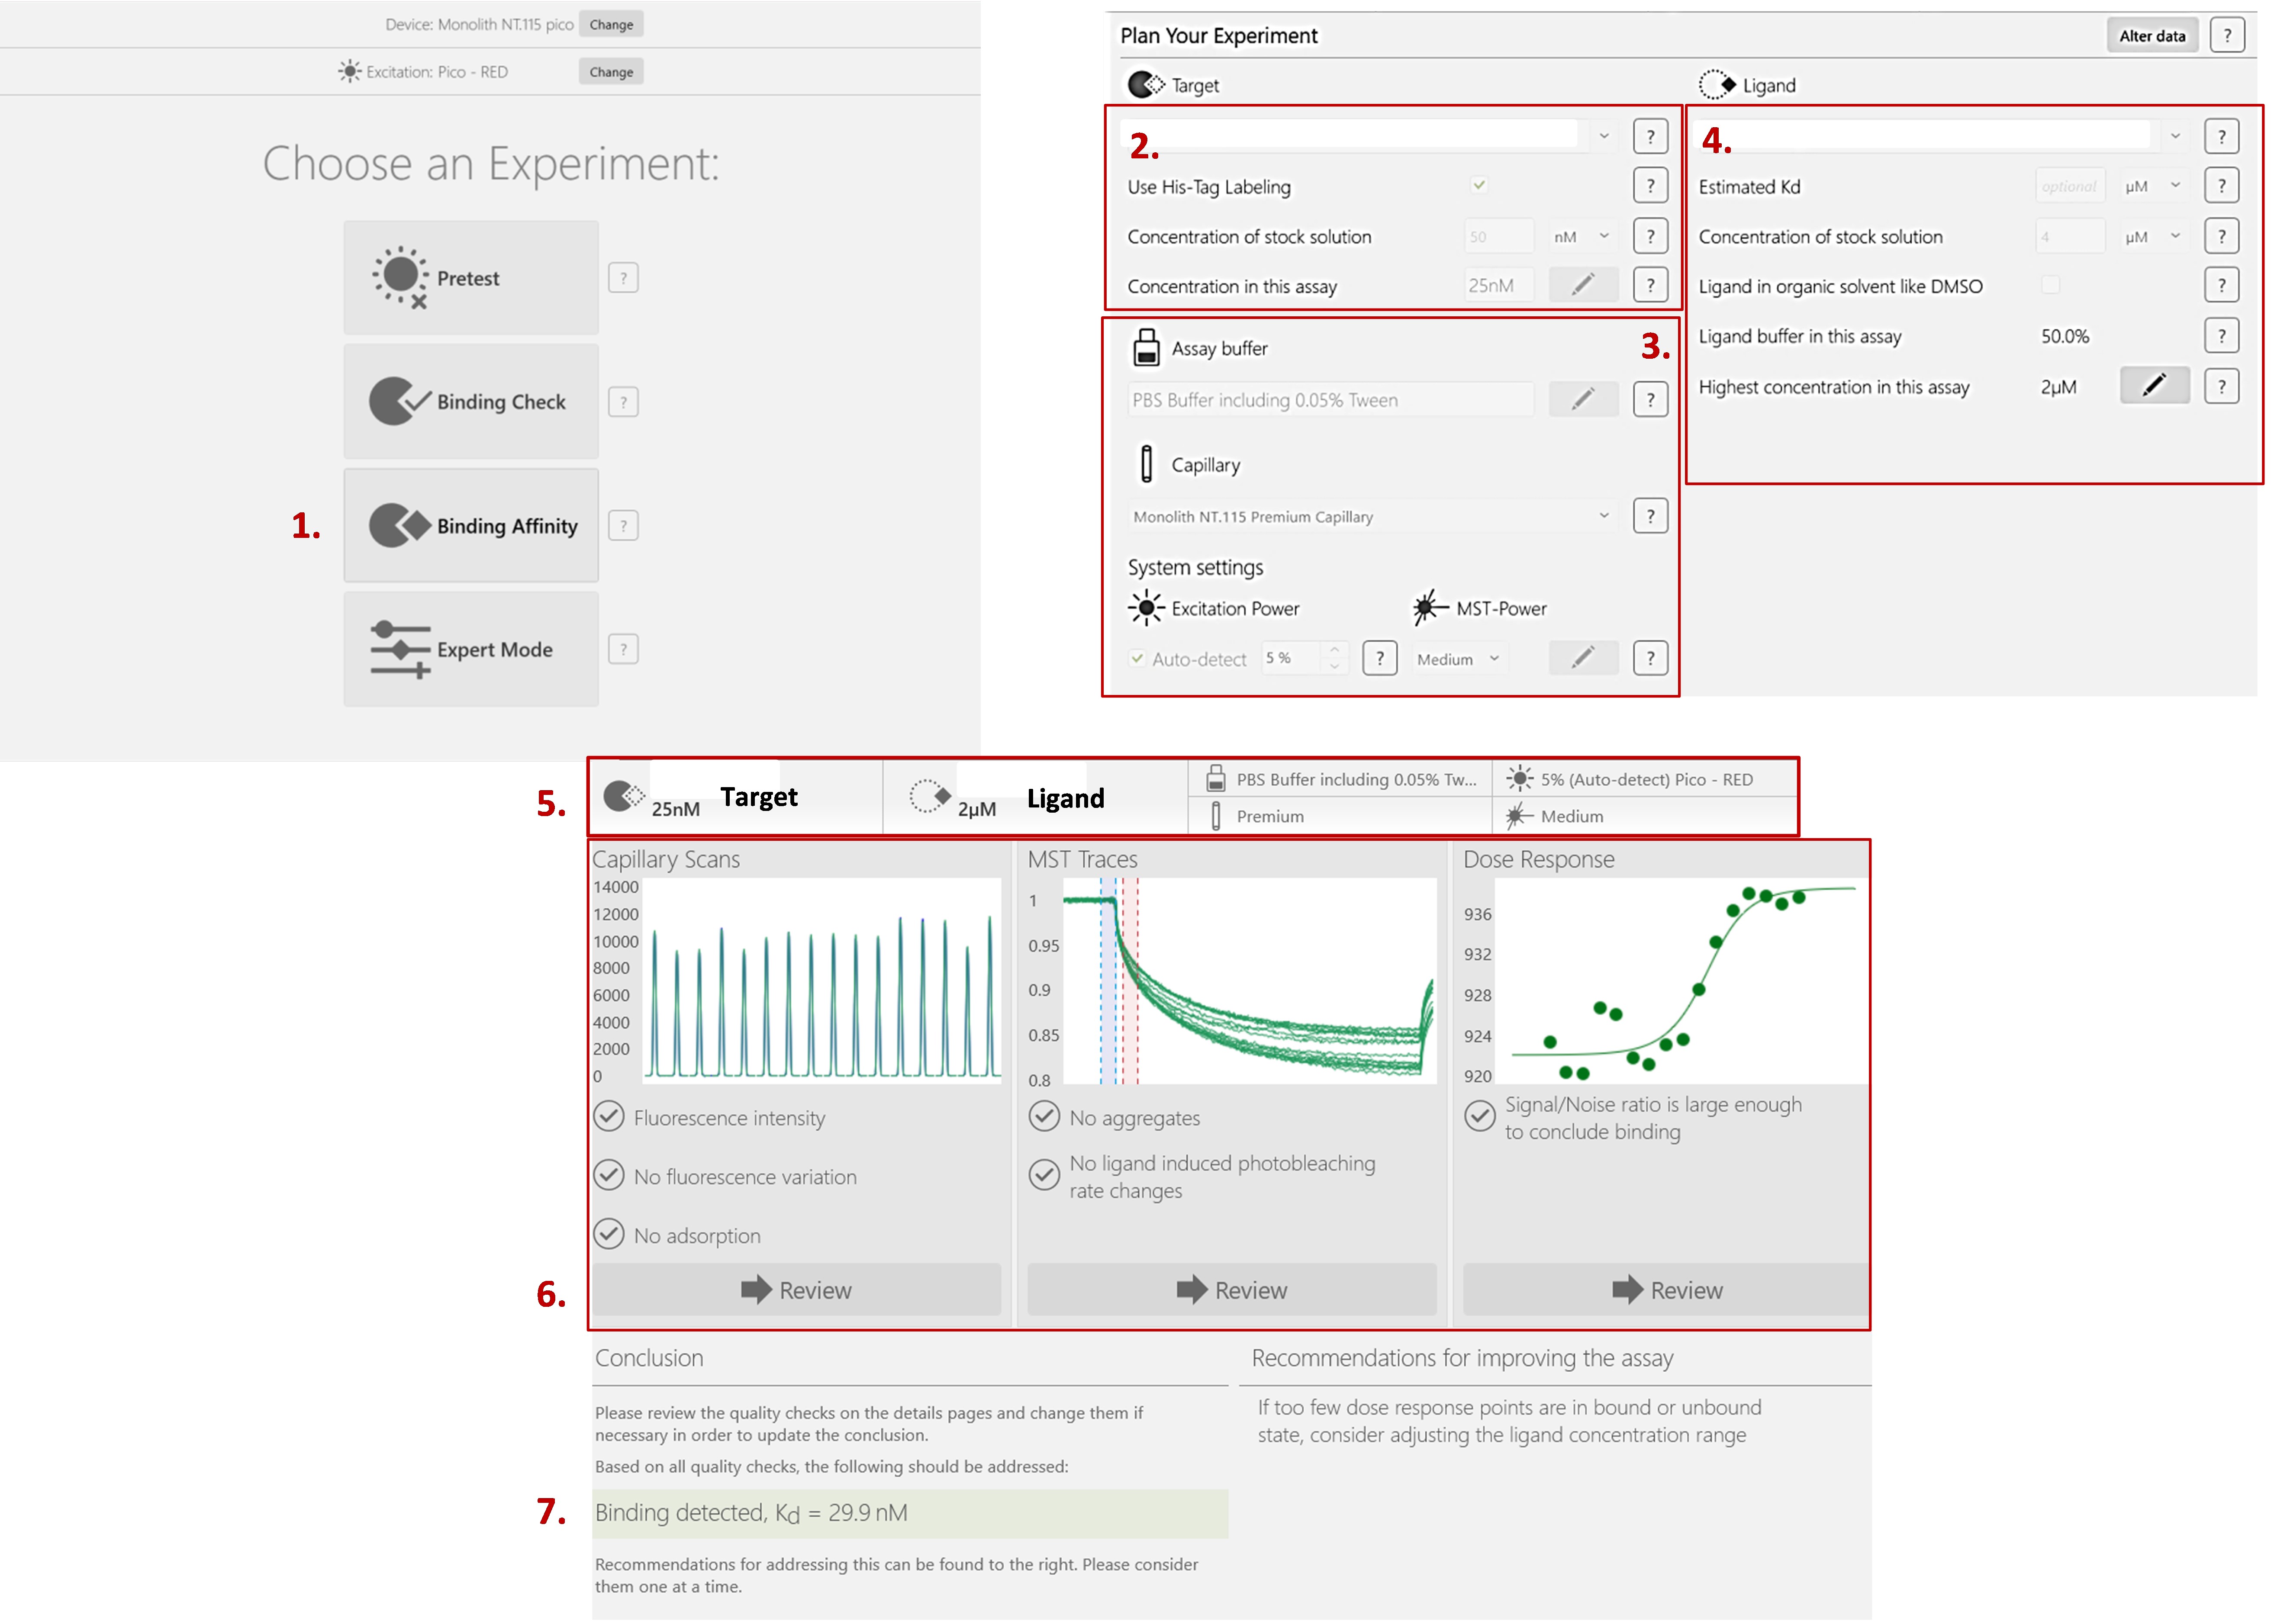
Figure 5. The procedure for how to start a binding affinity measurement experiment using NanoTemper® (MO.Control). 1) Select the binding affinity. 2) Fill in the information about your target of interest. 3) Describe the buffer and the type of capillaries you’re currently using. You can also change the excitation wavelength and/or MST power. If necessary, the software will prompt you to do so in the recommendations section. 4) Fill in the information about your ligand. 5) The parameters are summarized at the top of the screen. 6) You can check the results of your capillary scan to verify the absence of fluorescence variation. MST Traces allows you to verify that there is no aggregation occurring. Finally, the dose response curve is automatically fitted if the signal/noise ratio is large enough to conclude that there is binding. 7) The KD is calculated, and recommendations are made for the improvement of your results, if necessary.
Acknowledgments
This work was supported by Inserm, CNRS, IRCL (Institut pour la Recherche sur le Cancer de Lille), SIRIC ONCOLille (Grant INCaDGOS-Inserm 6041) and a grant from “Contrat de Plan Etat Région Hauts de France” CPER Cancer 2014-2019. We are thankful to the flow cytometry core facility of BiCEL and to the University of Lille screening core facility. This protocol was adapted from a previous work (Magnez et al., 2017).
Competing interests
The authors declare that there are no competing financial interests.
References
- Cheng, X., Veverka, V., Radhakrishnan, A., Waters, L. C., Muskett, F. W., Morgan, S. H., Huo, J., Yu, C., Evans, E. J., Leslie, A. J., Griffiths, M., Stubberfield, C., Griffin, R., Henry, A. J., Jansson, A., Ladbury, J. E., Ikemizu, S., Carr, M. D. and Davis, S. J. (2013). Structure and interactions of the human programmed cell death 1 receptor. J Biol Chem 288(17): 11771-11785.
- Freeman, G. J., Long, A. J., Iwai, Y., Bourque, K., Chernova, T., Nishimura, H., Fitz, L. J., Malenkovich, N., Okazaki, T., Byrne, M. C., Horton, H. F., Fouser, L., Carter, L., Ling, V., Bowman, M. R., Carreno, B. M., Collins, M., Wood, C. R. and Honjo, T. (2000). Engagement of the PD-1 immunoinhibitory receptor by a novel B7 family member leads to negative regulation of lymphocyte activation. J Exp Med 192(7): 1027-1034.
- Entzian, C. and Schubert, T. (2016). Studying small molecule-aptamer interactions using MicroScale Thermophoresis (MST). Methods 97: 27-34
- Ganesan, A., Ahmed, M., Okoye, I., Arutyunova, E., Babu, D., Turnbull, W. L., Kundu, J. K., Shields, J., Agopsowicz, K. C., Xu, L., Tabana, Y., Srivastava, N., Zhang, G., Moon, T. C., Belovodskiy, A., Hena, M., Kandadai, A. S., Hosseini, S. N., Hitt, M., Walker, J., Smylie, M., West, F. G., Siraki, A. G., Lemieux, M. J., Elahi, S., Nieman, J. A., Tyrrell, D. L., Houghton, M. and Barakat, K. (2019). Comprehensive in vitro characterization of PD-L1 small molecule inhibitors. Sci Rep 9(1): 12392.
- Rainard, J. M., Pandarakalam, G. C. and McElroy, S. P. (2018). Using Microscale Thermophoresis to Characterize Hits from High-Throughput Screening: A European Lead Factory Perspective. SLAS Discov (3):225-241.
- Khavrutskii, L., Yeh, J., Timofeeva, O., Tarasov, S. G., Pritt, S., Stefanisko, K. and Tarasova, N. (2013). Protein purification-free method of binding affinity determination by microscale thermophoresis. J Vis Exp (78). Doi: 10.3791/50541.
- Magnez, R., Thiroux, B., Taront, S., Segaoula, Z., Quesnel, B. and Thuru, X. (2017). PD-1/PD-L1 binding studies using microscale thermophoresis. Sci Rep 7(1): 17623.
- Zhang, X., Schwartz, J. C., Guo, X., Bhatia, S., Cao, E., Lorenz, M., Cammer, M., Chen, L., Zhang, Z. Y., Edidin, M. A., Nathenson, S. G. and Almo, S. C. (2004). Structural and functional analysis of the costimulatory receptor programmed death-1. Immunity 20(3): 337-347.
Article Information
Copyright
© 2020 The Authors; exclusive licensee Bio-protocol LLC.
How to cite
Romain, M., Thiroux, B., Tardy, M., Quesnel, B. and Thuru, X. (2020). Measurement of Protein-Protein Interactions through Microscale Thermophoresis (MST). Bio-protocol 10(7): e3574. DOI: 10.21769/BioProtoc.3574.
Category
Biochemistry > Protein > Interaction > Protein-protein interaction
Cancer Biology > Tumor immunology > Drug discovery and analysis
Do you have any questions about this protocol?
Post your question to gather feedback from the community. We will also invite the authors of this article to respond.