- Protocols

- Articles and Issues
- For Authors
- About
- Become a Reviewer

DNA Fiber Assay upon Treatment with Ultraviolet Radiations


Published: Vol 7, Iss 11, Jun 5, 2017 DOI: 10.21769/BioProtoc.2301 Views: 21164
Reviewed by: Anonymous reviewer(s)
Original research article
The authors used this protocol in:

Feb 2016
Advertisement


Protocol Collections
Comprehensive collections of detailed, peer-reviewed protocols focusing on specific topics


Related protocols
Abstract
Genome stability is continuously challenged by a wide range of DNA damaging factors. To promote a correct DNA repair and cell survival, cells orchestrate a coordinated and finely tuned cascade of events collectively known as the DNA Damage Response (DDR). Ultra Violet (UV) rays are among the main environmental sources of DNA damage and a well recognized cancer risk factor. UV rays induce the formation of toxic cyclobutane-type pyrimidine dimers (CPD) and [6-4]pyrimidine-pyrimidone (6-4PP) photoproducts which trigger the activation of the intra-S phase cell cycle checkpoint (Kaufmann, 2010) aimed at preventing replication fork collapse, late origin firing, and stabilizing fragile sites (Branzei and Foiani, 2009). To monitor the activation of the intra-S phase checkpoint in response to UV type C (UVC) exposure, the DNA fiber assay can be used to analyse the new origin firing and DNA synthesis rate (Jackson et al., 1998; Merrick et al., 2004; Alfano et al., 2016). The DNA fiber assay technique was conceived in the 90s and then further developed through the use of thymidine analogues (such as CldU and IdU), which are incorporated into the nascent DNA strands. By treating the cells in sequential mode with these analogues, which can be visualized through specific antibodies carrying different fluorophores, it is possible to monitor the replication fork activity and assess how this is influenced by UV radiations or others agents.
Keywords: Ultra Violet radiationBackground
Genomic instability is one of the hallmarks of cancer involved in both tumour development and progression (Hanahan and Weinberg, 2011). The preservation of genomic stability depends on a complex cascade of finely tuned events which are collectively known as the DNA damage response. This includes the activation of cell cycle checkpoints, which stall cell cycle to allow the cellular repair machinery to mend the damage. The identification of novel druggable proteins, involved in the DNA repair mechanisms, is part of modern cancer therapy. In this context, the DNA fiber assay can be used as a readout of replication fork activity to identify new potential players in the regulation of the intra-S phase checkpoint, which is triggered upon exposure to various chemotherapeutic drugs.
The unique chemistry of DNA, of its constituents and its chemical-physical properties allowed pioneering scientists to visualize the whole length of DNA fibers, first by labelling DNA with tritiated thymidine followed by detection through autoradiography (Cairns, 1963). Then Bensimon and colleagues showed that it was possible to align and ‘comb’ the DNA fibers on a solid matrix achieving a uniform stretching and an easy access for specific hybridizations (Bensimon et al., 1994). Jackson and Pombo were the first to use sequential labelling with halogenated pyrimidines, such as bromo-deoxyuridine (BrdU) and iodo-deoxyuridine (IdU), which are incorporated into DNA as thymidine analogues (Jackson and Pombo, 1998). This allowed them to assess qualitatively and quantitatively the activity of replicon clusters in HeLa cells at different times during S phase. Afterwards another study (Merrick et al., 2004) described a modified DNA fiber labelling, which was adapted by a classical DNA fiber autoradiography (Huberman and Riggs, 1968). Diffley and colleagues used pulse labelling with two halogenated nucleotides: chloro-deoxyuridine (CldU) and IdU, which could be differentially detected through specific antibodies, each carrying a different fluorescent dye. This allowed to visualize through fluorescent microscopy the effect of a specific cell treatment on the dynamics of the DNA synthesis process. The protocol described below was made as described by the two previously cited protocols with some modifications (Jackson and Pombo, 1998; Merrick et al., 2004).
Materials and Reagents
- 60 mm cell culture dishes (Sigma-Aldrich, catalog number: CLS430166 )
Manufacturer: Corning, catalog number: 430166. - Silane-Prep Slides: glass slides coated with silane (aminoalkylsilane) (Sigma-Aldrich, catalog number: S4651 )
- HeLa cells (ATCC, catalog number: CCL-2 )
- Cell culture
- Roswell Park Memorial Institute (RPMI) 1640 medium (Thermo Fisher Scientific, GibcoTM, catalog number: 61870010 )
- 10% fetal bovine serum (FBS) (Thermo Fisher Scientific, GibcoTM, catalog number: 10270106 )
- Penicillin-streptomycin (Thermo Fisher Scientific, GibcoTM, catalog number: 15070063 )
- 0.25% trypsin-EDTA (Thermo Fisher Scientific, catalog number: 25200056 )
- Roswell Park Memorial Institute (RPMI) 1640 medium (Thermo Fisher Scientific, GibcoTM, catalog number: 61870010 )
- 5-Iodo-2’-deoxyuridine (IdU) (Sigma-Aldrich, catalog number: I7125 )
- 5-Chloro-2’-deoxyuridine (CldU) (Sigma-Aldrich, catalog number: C6891 )
- Chemicals of analytical grade
- Methanol (CARLO ERBA Reagents, catalog number: 414814 )
- Acetic acid glacial (Fisher Scientific, catalog number: A38-212 )
- Ethanol absolute (CARLO ERBA Reagents, catalog number: 308605 )
- 39.5% hydrochloric acid (HCl) (CARLO ERBA Reagents, catalog number: 403878 )
- Bovine serum albumin (BSA) (Sigma-Aldrich, catalog number: A9418 )
- Tween® 20 (Sigma-Aldrich, catalog number: P9416 )
- ProLong® Gold anti-fade reagent (Thermo Fisher Scientific, InvitrogenTM, catalog number: P36935 )
- Sodium chloride (NaCl) (Sigma-Aldrich, catalog number: S7653 )
- Potassium chloride (KCl) (Sigma-Aldrich, catalog number: P9541 )
- Sodium phosphate dibasic (Na2HPO4) (Sigma-Aldrich, catalog number: 255793 )
- Potassium phosphate monobasic (KH2PO4) (Sigma-Aldrich, catalog number: 795488 )
- Sodium dodecyl sulfate (SDS) (Sigma-Aldrich, catalog number: 71725 )
- Tris (Roche Diagnostics, catalog number: 10708976001 )
- 0.5 M EDTA (pH 8.0) (Thermo Fisher Scientific, InvitrogenTM, catalog number: AM9262 )
- NP-40 (Thermo Fisher Scientific, catalog number: 85124 )
- Antibodies
- Anti-BrdU clone BU1/75 (ICR1) (detects CldU) (Bio-Rad Laboratories, catalog number: OBT0030CX )
- Anti-BrdU clone B44 (detects IdU) (BD, BD Biosciences, catalog number: 347580 )
- Alexa Fluor 488-conjugated chicken anti-rat (Thermo Fisher Scientific, Invitrogen, catalog number: A21470 )
- Alexa Fluor 594-conjugated rabbit anti-mouse (Thermo Fisher Scientific, Invitrogen, catalog number: A-11062 )
- 1x phosphate buffered saline (PBS) (see Recipes)
- Spreading buffer (see Recipes)
- Stringent buffer (see Recipes)
Equipment
- Incubator
- UVC 500 UV Crosslinker (GE Healthcare, model: UVC 500 )
- Centrifuge
- Confocal microscope (e.g., Carl Zeiss, model: Zeiss LSM100 )
- Fume hood
Software
- GraphPad software
Procedure
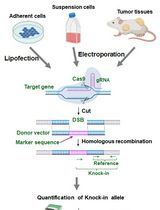
See Figure 1 for an overview of the protocol.
Figure 1. Schematic overview of the protocol
- Culture HeLa cells in RPMI 1640 medium supplemented with 10% FBS, 1 μg/ml penicillin and 1 µg/ml streptomycin (defined as ‘complete medium’).
- Treat a 60 mm dish of 80% confluent HeLa cells with CldU (20 μM final concentration) in complete RPMI 1640 medium (these cells are defined as ‘labelled cells’); whereas leave untreated another 60 mm dish of the same cells in the same conditions (these cells are defined as ‘unlabelled cells’). Incubate both dishes at 37 °C in a 5% CO2 incubator for 20 min (see Note 1).
- Wash twice with 1x PBS.
- Remove all the excess 1x PBS.
- Treat labelled HeLa cells with UVC at a dose of 10 J/m2 (see Note 2).
- Add to labelled cells IdU (100 μM final concentration) in fresh complete RPMI 1640 medium (see Note 1).
- Incubate at 37 °C in a 5% CO2 incubator for 40 min.
- Trypsinize both labelled and unlabelled HeLa cells, then harvest them through centrifugation (800 x g for 5 min).
- Wash the cell pellet with ice-cold (4 °C) 1x PBS twice.
- Resuspend HeLa cells with the ice-cold 1x PBS at 2.5 x 10⁵ cells/ml.
- Dilute labelled cells 1:8 with unlabelled cells (vol/vol).
- Spot onto the Silane Prep slides 2.5 μl of this labelled/unlabelled cell solution. Allow the 2.5 μl sample to evaporate not completely. (see Note 3)
- Mix the cells with 7.5 μl of spreading buffer directly on the Silane Prep slide.
- Incubate at room temperature (RT) for 10 min.
- Tilt the slides to 15° to spread DNA fibers along their length.
- Air-dry the DNA spreads. (see Note 3)
- Fix DNA fibers (which are now spread onto the Silane Prep slide) in 3:1 methanol/acetic acid in a plastic or glass container at -20 °C for 15 min.
- Wash slides in 1x PBS twice.
- Incubate DNA fibers in 70% ethanol at 4 °C for one hour (see Note 4).
- Treat the slides with 2.5 N of HCl at 37 °C for one hour.
- Wash slides with 1x PBS twice.
- Block DNA fibers with 1x PBS + 0.5% BSA for 30 min at RT.
- Incubate slides with 1:500 Anti-BrdU clone BU1/75 (ICR1) (which detects CldU) and 1:300 Anti-BrdU clone B44 (which detects IdU) together in 1x PBS + 0.5% BSA for one hour at 37 °C.
- Wash DNA fibers twice for 5 min at RT and once for 15 min at RT with stringent buffer (no shaking required).
- Incubate Silane Prep slides with 1:300 Alexa Fluor 488-conjugated chicken anti-rat and 1:400 Alexa Fluor 594-conjugated rabbit anti-mouse together in 1x PBS + 0.5% BSA for 30 min at 37 °C. Both antibodies were tested singularly to detect possible cross reactivity in HeLa cells and were previously successfully used for this technique (Alfano et al., 2016).
- Wash Silane Prep slides with 1x PBS + 0.5% Tween 20 for 5 min at RT for three times.
- Mount the slides with ProLong Gold anti-fade reagent.
- Analyse the slides through confocal fluorescent microscopy in sequential scanning mode.
Data analysis
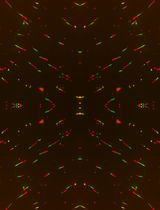
To process the images obtained from the DNA fiber assay (Figure 2) one can use either manual counting or an automatic analysis by using a specific software. To analyze the frequency of the various DNA fiber types (ongoing, newly fired, or others) we manually counted 600 fibers for each experiment of three independent ones. To evaluate the statistical significance among different conditions or treatments assessed through DNA fiber assay, we applied the appropriate statistical test through the GraphPad software. To measure the length of DNA spreads to estimate the replication speed (1 μm corresponds to 2.59 kb), we used the specific image analysis software ImageJ (https://imagej.nih.gov/ij/). The University of North Carolina developed a software for the automatic analysis of DNA spreads (http://dnafiberanalysis.com/).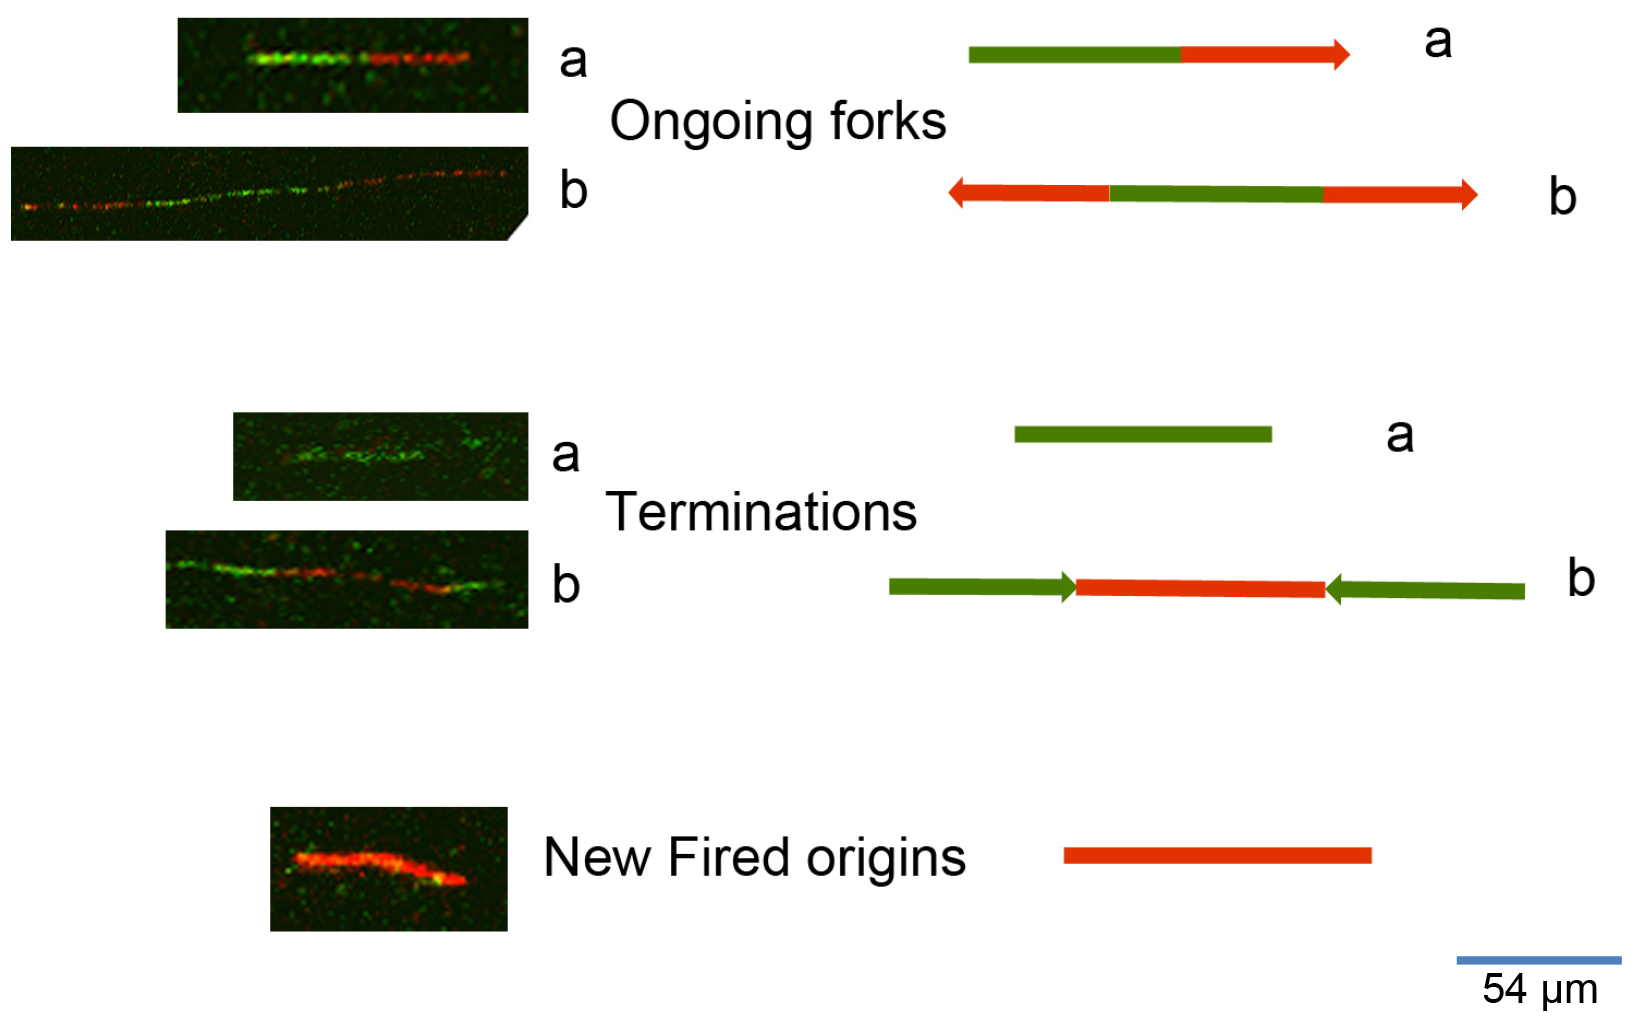
Figure 2. Representative kinds of DNA fibers identified by using this protocol. The sequential labelling provides a snapshot of different DNA replication steps: 1) Ongoing forks can appear as in a (in the case of unidirectional progression through the replication fork) or as in b (in the case of bidirectional progression through the replication fork). 2) Termination events can appear as in a (as an only-green line in the case of a replication origin in which DNA synthesis terminated while the cells were still undergoing incubation with the first label), or as in b (as adjoined red-green-red signals with divergent trend). 3) New fired origins appear as shown in the lower panel of the figure. These origins were fired during incubation with the second label (consisting of an only-red line, according to the protocol herein described).
Notes
- The pulse time and the working concentration of CldU and IdU might have to be adapted depending on the different type of cells under study.
- Prior to exposing the cells to the UV bulb remove the plate cap and make sure to aspirate completely any residual cell growth medium or 1x PBS so as not to shield the UV radiations.
- Do not evaporate the samples in the fume hood.
- At this step, the slides can be stored at 4 °C in 70% ethanol overnight, but we prefer to process the fibers directly.
Recipes
- 1x phosphate buffered saline (PBS)
137 mM NaCl
2.7 mM KCl
10 mM Na2HPO4
1.8 mM KH2PO4
Adjust to a final pH of 7.4 - Spreading buffer
0.5% sodium dodecyl sulfate (SDS)
200 mM Tris-HCl pH 7.4
50 mM EDTA pH 8 - Stringent buffer
10 mM Tris-HCl pH 7.4
400 mM NaCl
0.2% Tween 20
0.2% NP-40
Acknowledgments
We are grateful to the Sbarro Health Research Organization (http://www.shro.org), the Human Health Foundation (http://www.hhfonlus.org), the Commonwealth of Pennsylvania and the Associazione Italiana per la Ricerca sul Cancro (IG 2014-15690) for their support. A.G. is also Director of the Cell Cycle and Cancer Research Line at CROM, Istituto Nazionale Per Lo Studio E La Cura Dei Tumori; Naples. F.P. is also Adjunct Associate Professor at Temple University, Department of Biology, Philadelphia, PA, USA.
References
- Alfano, L., Costa, C., Caporaso, A., Altieri, A., Indovina, P., Macaluso, M., Giordano, A. and Pentimalli, F. (2016). NONO regulates the intra-S-phase checkpoint in response to UV radiation. Oncogene 35(5): 567-576.
- Bensimon, A., Simon, A., Chiffaudel, A., Croquette, V., Heslot, F. and Bensimon, D. (1994). Alignment and sensitive detection of DNA by a moving interface. Science 265(5181): 2096-8.
- Branzei, D. and Foiani, M. (2009). The checkpoint response to replication stress. DNA Repair (Amst) 8(9): 1038-1046.
- Cairns, J. (1963). The bacterial chromosome and its manner of replication as seen by autoradiography. J Mol Biol 6: 208-13.
- Hanahan, D. and Weinberg, B. (2011). Hallmarks of Cancer: The next generation. Cell 144(5): 646-674.
- Huberman, J. A. and Riggs, A. D. (1968). On the mechanism of DNA replication in mammalian chromosomes. J Mol Biol 32(2):327-41.
- Jackson, D. A. and Pombo, A. (1998). Replicon clusters are stable units of chromosome structure: evidence that nuclear organization contributes to the efficient activation and propagation of S phase in human cells. J Cell Biol 140(6): 1285-1295.
- Kaufmann, W. K. (2010). The human intra-S checkpoint response to UVC-induced DNA damage. Carcinogenesis 31(5): 751-765.
- Merrick, C. J., Jackson, D. and Diffley, J. F. (2004). Visualization of altered replication dynamics after DNA damage in human cells. J Biol Chem 279(19): 20067-20075.
Article Information
Copyright
© 2017 The Authors; exclusive licensee Bio-protocol LLC.
How to cite
Luigi, A., Giordano, A. and Pentimalli, F. (2017). DNA Fiber Assay upon Treatment with Ultraviolet Radiations. Bio-protocol 7(11): e2301. DOI: 10.21769/BioProtoc.2301.
Category
Cancer Biology > Genome instability & mutation > Cell biology assays > DNA structure and alterations
Biochemistry > DNA > Single-molecule Activity > Imaging
Do you have any questions about this protocol?
Post your question to gather feedback from the community. We will also invite the authors of this article to respond.