- Protocols

- Articles and Issues
- For Authors
- About
- Become a Reviewer

Fluorescence Microscopy Analysis of Drug Effect on Autophagosome Formation


Published: Vol 4, Iss 7, Apr 5, 2014 DOI: 10.21769/BioProtoc.1089 Views: 12002
Reviewed by: Anonymous reviewer(s)
Original research article
The authors used this protocol in:
Jan 2013
Advertisement


Protocol Collections
Comprehensive collections of detailed, peer-reviewed protocols focusing on specific topics


Related protocols
Abstract
The autophagy protein, LC3 represents a reliable characteristic marker for autophagosomal structures. The initial LC3 is processed by the cysteine protease autophagy-related gene 4 (Atg4) at its C terminus in order to create LC3-I generally localized in the cytoplasm. Afterwards LC3-I is conjugated with phosphatidylethanolamine (PE) to become LC3-PE or LC3-II predominantly localised on the autophagosomal membranes (outer and inner). Autolysosomal content of LC3-II is very low as upon autophago/lysosomal fusion it is either cleaved off from the outer membrane by Atg4 or degraded together with the inner membrane by the lysosomal activity. Therefore GFP-LC3 and mCherry-GFP-LC3 might be visualized by conventional or confocal fluorescence microscopy (FM). In this situation mCherry-GFP-LC3 or GFP-LC3 cytoplasmic pool is visualized as a homogeneously dispersed signal and mCherry-GFP-LC3-II or GFP-LC3-II containing autophagosomes are detected as punctae formations. The number of punctae may be used as marker of autophagosomal abundance. In general we recommend counting the average number of GFP-LC3 punctae per cell.
Keywords: AutophagyMaterials and Reagents
- Cell lines of interest (HepG2, HUH7, CMK, K562 etc.) stably expressing GFP-LC3
We recommend the following commercially available plasmids: pBABEpuro GFP-LC3 (plasmid 22405) and pBABE-puro mCherry-EGFP-LC3B (plasmid 22418) generated by Jayanta Debnath from Addgene to be inserted into retroviral constructs and used for cell transduction
- Eagle's minimal essential medium (EMEM) (ATCC, catalog number: 30-2003 ) containing 10% fetal bovine serum (FBS) with 100 U/100 μg/ml penicillin/streptomycin (Life Technologies, Gibco®, catalog number: 15140-122 )
- RPMI 1640 with L-glutamine (Lonza, catalog number: BE12-702F ) containing 10% fetal bovine serum (FBS) with 100 U/100 μg/ml penicillin/streptomycin
- Fetal Bovine Serum (FBS) (Biochrom, catalog number: S0615 )
- Dulbecco’s Phosphate Buffered Saline (PBS) (Biochrom, catalog number: L1825 )
- 1x 0.05% Trypsin-EDTA (phenol red) (Life Technologies, catalog number: 25300 )
- Hanks Balanced Salt Solution (HBSS) (Life Technologies, Gibco®, catalog number: 14025 ) containing 6 mM glucose (starvation medium)
- Rapamycin from Streptomyces hygroscopicus (1-5 µmol/L) (Sigma-Aldrich, catalog number: R0395 )
- PP242 hydrate (1-5 µmol/L) (Sigma-Aldrich, catalog number: P0037 )
- 3-methyladenine (3-MA) (3-10 mmol/L) (Sigma-Aldrich, catalog number: M9281 )
- Wortmannin (30-100 nmol/L) (Sigma-Aldrich, catalog number: W3144 )
- LY294002 (7-20 µmol/L) (Sigma-Aldrich, catalog number: L9908 )
- Nocodazole (12-50 µmol/L) (Sigma-Aldrich, catalog number: M1404 )
- Vinblastine (12-50 µmol/L) (Sigma-Aldrich, catalog number: V1377 )
- Ammonium chloride (NH4Cl) (10-20 mmol/L) (Sigma-Aldrich, catalog number: A0171 )
- Hydrohychloroquine sulphate (HCQ) (5-10 µmol/L) (Sigma-Aldrich, catalog number: H0915 )
- Chloroquine (CQ) (5-10 µmol/L) (Sigma-Aldrich, catalog number: C6628 )
- Dimethyl sulfoxide DMSO (Sigma-Aldrich, catalog number: D8418 )
Equipment
- 37 °C, 5% CO2 humidified incubator
- Centrifuge
- Olympus IX81 instrument and analySIS (Soft Imaging System GmbH) or analogous equipment
Procedure
- Maintained the cells under standard tissue culture conditions at 37 ºC, 5% CO2 in a humidified incubator. Keep cell density below 1 x 10⁶/ml and analyse at subconfluent stages.
Caution: Prior to analysis cell should be kept for several hours in fresh medium to avoid potential activation of autophagy due to nutrients exhaustion. Generally culture medium contains autophagy affecting substances: amino acids, glucose, growth factors, hormones…etc. Take care when comparing autophagic flux in different conditions to normalize for all the necessary factors. Normalize also for the solvent used when analysing the effect of different substances on autophagy – for example DMSO, ethanol etc might affect autopagic flux.
- Incubate the cells for the desired time and under the conditions of interest.
Caution: When analysing prolonged periods of time and/or under conditions potentially affecting cells numbers or viability, differences in nutrient consumption and therefore abundance might occur and influence your results as autophagic activity is highly related to the nutritional status.
- Positive control [rapamycin (1-5 µmol/L), PP242 (1-5 µmol/L), Hanks’ Balanced Salt Solution containing 6 mmol/L glucose (starvation medium)] and negative control [3-methyladenine (3-MA) (3–10 mmol/L), wortmannin (30-100 nmol/L), LY294002 (7-20 µmol/L), nocodazole (12-50 µmol/L), vinblastine (12-50 µmol/L), ammonium chloride (NH4Cl) (10-20 mmol/L), hydrohychloroquine (HCQ) or chloroquine (CQ) (5-10 µmol/L)] may be also included. Positive controls activate autophagy and should result in an initial increase in the number of punctae per cell. Negative controls inhibit different stages of autophagic process. Inhibitors of autophagosome formation are expected to decrease the number of punctae per cell as inhibitors of autophagosomal maturation or downstream events should result in an increased number of punctae per cell.
- At the end of incubation period transfer the cell on microscopic glass and take fluorescent images for each separate treatment condition, from several cells belonging to a number of randomly chosen fields with a GFP filter.
Notes:- When analysing the effect of a certain substance or condition on autophagy we recommend the evaluation of potential changes in autophagosomal numbers per cell and comparison to the effects of established activators and inhibitors.
- Furthermore it would be informative to perform a range of co incubations with the above mentioned conditions and to use the provided Table 1 for rough orientation. (Caution: It is imperative to rule out experimental artefacts potentially arising from GFP-LC3 aggregates formation. Use GFP-LC3 cells with stable expression of the fusion protein. Select cellular clones with levels of GFP-LC3 expression associated with minimum aggregate formation. Although FM is useful to determine the autophagosome number per cell, it is not a good indicator for the estimation of cellular autophagic activity.).
- Autophagosome accumulation may be due to both autophagy induction with increased generation of autophagosomes as well as suppressed autophagosomal maturation or downstream events and inability to complete the autophagic pathway. There are several approaches to distinguish between these situations. We recommend the following simplistic model presented in Table 1.
Table 1. Analysis of unknown substance XX plus:
Medium
Activator
iAF
iAM or iAA
I
→
↑↑
→ or ↓
↑↑
II
↑↑
↑↑↑
→ or ↑ or ↓
↑↑↑
III
→ or ↓
→ or ↑ or ↓
→
↑
IV
↑↑
↑↑↑
↑
↑↑
Caution: Generally pharmacological inhibitors of autophagy lack specificity and therefore some cell type specific effects might occur. We also recommend analysing the effect of a new substance not only on basic, but also on rapamycin, PP242 or starvation activated autophagic flux. Table 1 may be used to facilitate the interpretation of the results.
Notes:- →↑↓: Change in the number of FM visualized autophagosomes.
- (Activator): autophagy induction [rapamycin (1-5 µmol/L), PP242 (1-5 µmol/L) or starvation medium].
- (iAF): Inhibition of autophagosom formation [3-methyladenine (3-MA) (3–10 mmol/L), wortmannin (30–100 nmol/L), LY294002 (7–20 µmol/L)].
- (iAM): Inhibition of autopagosomal maturation [nocodazole (12–50 µmol/L) and vinblastine (12–50 µmol/L)].
- (iAA): Inhibition of autophagosomal acidification [ammonium chloride (NH4Cl) (10–20 mmol/L), hydrohychloroquine (HCQ) and chloroquine (CQ) (5–10 µmol/L)].
- The analyses of unknown substance X should include co incubation with: Activator, iAF, iAM and/or iAA. Table 1 illustrates four possible scenarios. a) Scenario (I) the unknown substance X does not impact cellular autophagic activity; b) Scenario (II) X is an activator; c) Scenario (III) X is an early inhibitor of autophagosome formation; d) Scenario (IV) X inhibits autophagy at the level of autophagosomal maturation or at some downstream stage.
- Caution: The suggested interpretation of FM data should be used with care as by itself FM is prone to many limitations and the results obtained with this method must be verified using other methodological approaches with not overlapping limitations such as electron microscopy (EM), flow cytometry, western blotting (WB) etc.
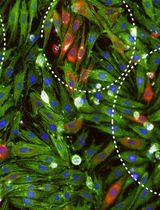
- Example data:
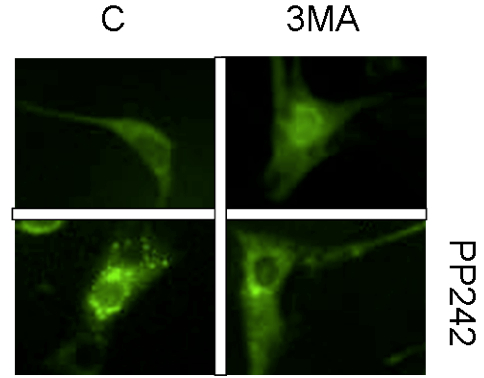
Figure 1. Fluorescent microscopy analysis of autophagic punctae formation in 3T3-F442A cells stably expressing LC3-GFP fusion protein incubated with autophagy inhibitor 3MA (10 mM) for 6 h in the presence or absence of autophagy activator PP242 for the last 4 h
- →↑↓: Change in the number of FM visualized autophagosomes.
Acknowledgments
This work was supported in part by the German Research Foundation (KFO 250, TP1) and an unrestricted grant from Abbott. Leverkus, M. was supported by the German National Academic Foundation (LE-953/5-1 and LE-953/6-1). Behrens, G. was supported by the Excellence Cluster EXC 62/1.
References
- Mizushima, N., Yoshimori, T. and Levine, B. (2010). Methods in mammalian autophagy research. Cell 140(3): 313-326.
- Sinicrope, F. A., Sirko, A., Siu, P. M. et al. (2012). Guidelines for the use and interpretation of assays for monitoring autophagy. Autophagy 8(4): 445-544.
- Stankov, M. V., El Khatib, M., Kumar Thakur, B., Heitmann, K., Panayotova-Dimitrova, D., Schoening, J., Bourquin, J. P., Schweitzer, N., Leverkus, M., Welte, K., Reinhardt, D., Li, Z., Orkin, S. H., Behrens, G. M. and Klusmann, J. H. (2014). Histone deacetylase inhibitors induce apoptosis in myeloid leukemia by suppressing autophagy. Leukemia 28(3): 577-588.
- Stankov, M. V., Panayotova-Dimitrova, D., Leverkus, M., Schmidt, R. E. and Behrens, G. M. (2013). Thymidine analogues suppress autophagy and adipogenesis in cultured adipocytes. Antimicrob Agents Chemother 57(1): 543-551.
Article Information
Copyright
© 2014 The Authors; exclusive licensee Bio-protocol LLC.
How to cite
Stankov, M., Panayotova-Dimitrova, D., Leverkus, M. and Behrens, G. (2014). Fluorescence Microscopy Analysis of Drug Effect on Autophagosome Formation. Bio-protocol 4(7): e1089. DOI: 10.21769/BioProtoc.1089.
Category
Microbiology > Antimicrobial assay > Autophagy assay
Cell Biology > Cell imaging > Fluorescence
Do you have any questions about this protocol?
Post your question to gather feedback from the community. We will also invite the authors of this article to respond.