


In-Gel Tryptic Digestion and HCD/EThcD LC-MS/MS for Mapping Autophosphorylation Sites

发布: 2026年10月05日第16卷第19期 DOI: 10.21769/BioProtoc.5836 浏览次数: 33
评审: Laxmi Narayan MishraPrajita PandeyJoyce Chiu
 PDF
PDF  Q&A
Q&A





Abstract
This protocol describes a targeted workflow for identifying and quantitatively comparing kinase autophosphorylation sites, using in-gel proteolytic digestion, LC-MS/MS analysis, phosphosite localisation, and extracted ion chromatogram (XIC) analysis. The detailed protocol begins with an excised SDS-PAGE gel band containing the immunoprecipitated kinase of interest. Standard cell culture, expression, immunoprecipitation, and SDS-PAGE procedures can be used to generate this starting material according to the experimental system under investigation; the specific conditions used for NEK1 are described in our associated research article. Here, the protocol is applied to characterise phosphorylation sites on NEK1—a serine/threonine kinase implicated in amyotrophic lateral sclerosis (ALS)—using a homozygous NEK1 knockout cell background in which GFP-tagged wild-type or kinase-dead NEK1 constructs are re-expressed. This experimental system enables accurate assessment of kinase-dependent phosphorylation events in the absence of endogenous NEK1. A key methodological feature of the workflow is the use of two parallel MS2 fragmentation strategies: higher energy collisional dissociation (HCD) and electron-transfer/HCD (EThcD). EThcD generates complementary b/y and c/z ion series, providing superior localisation confidence for labile phosphorylation events that are difficult to resolve using HCD alone. Relative phosphopeptide abundance across conditions can be assessed using extracted ion chromatograms generated in FreeStyle, or using Skyline software with normalisation to the total ion current (TIC), as performed in the associated NEK1 study. Although demonstrated here using NEK1, the protocol is readily adaptable to other kinases amenable to immunoprecipitation and will be of interest to researchers studying kinase signalling, post-translational modification biology, and disease-associated phosphorylation events.
Key features
• Uses a homozygous NEK1 knockout cell background with re-expressed GFP-tagged constructs for discrimination of kinase-activity-associated candidate autophosphorylation events from background.
• Parallel HCD and EThcD fragmentation runs per sample for complementary phosphosite localisation; EThcD is particularly advantageous for labile or multiply phosphorylated peptides.
• Quantitative wild-type vs. kinase-dead comparison using extracted ion chromatograms normalised to reference peptides or total ion current, with worked m/z calculations and FreeStyle screenshots.
• Readily adaptable to any kinase amenable to immunoprecipitation and for which a kinase-dead control construct can be generated.
Keywords: Phosphoproteomics Autophosphorylation
In-gel digestion
LC-MS/MS
EThcD
HCD
Extracted ion chromatogram
Autophosphosite mapping
NEK1
Autophosphorylation
In-gel digestion
LC-MS/MS
EThcD
HCD
Extracted ion chromatogram
Autophosphosite mapping
NEK1
Graphical overview
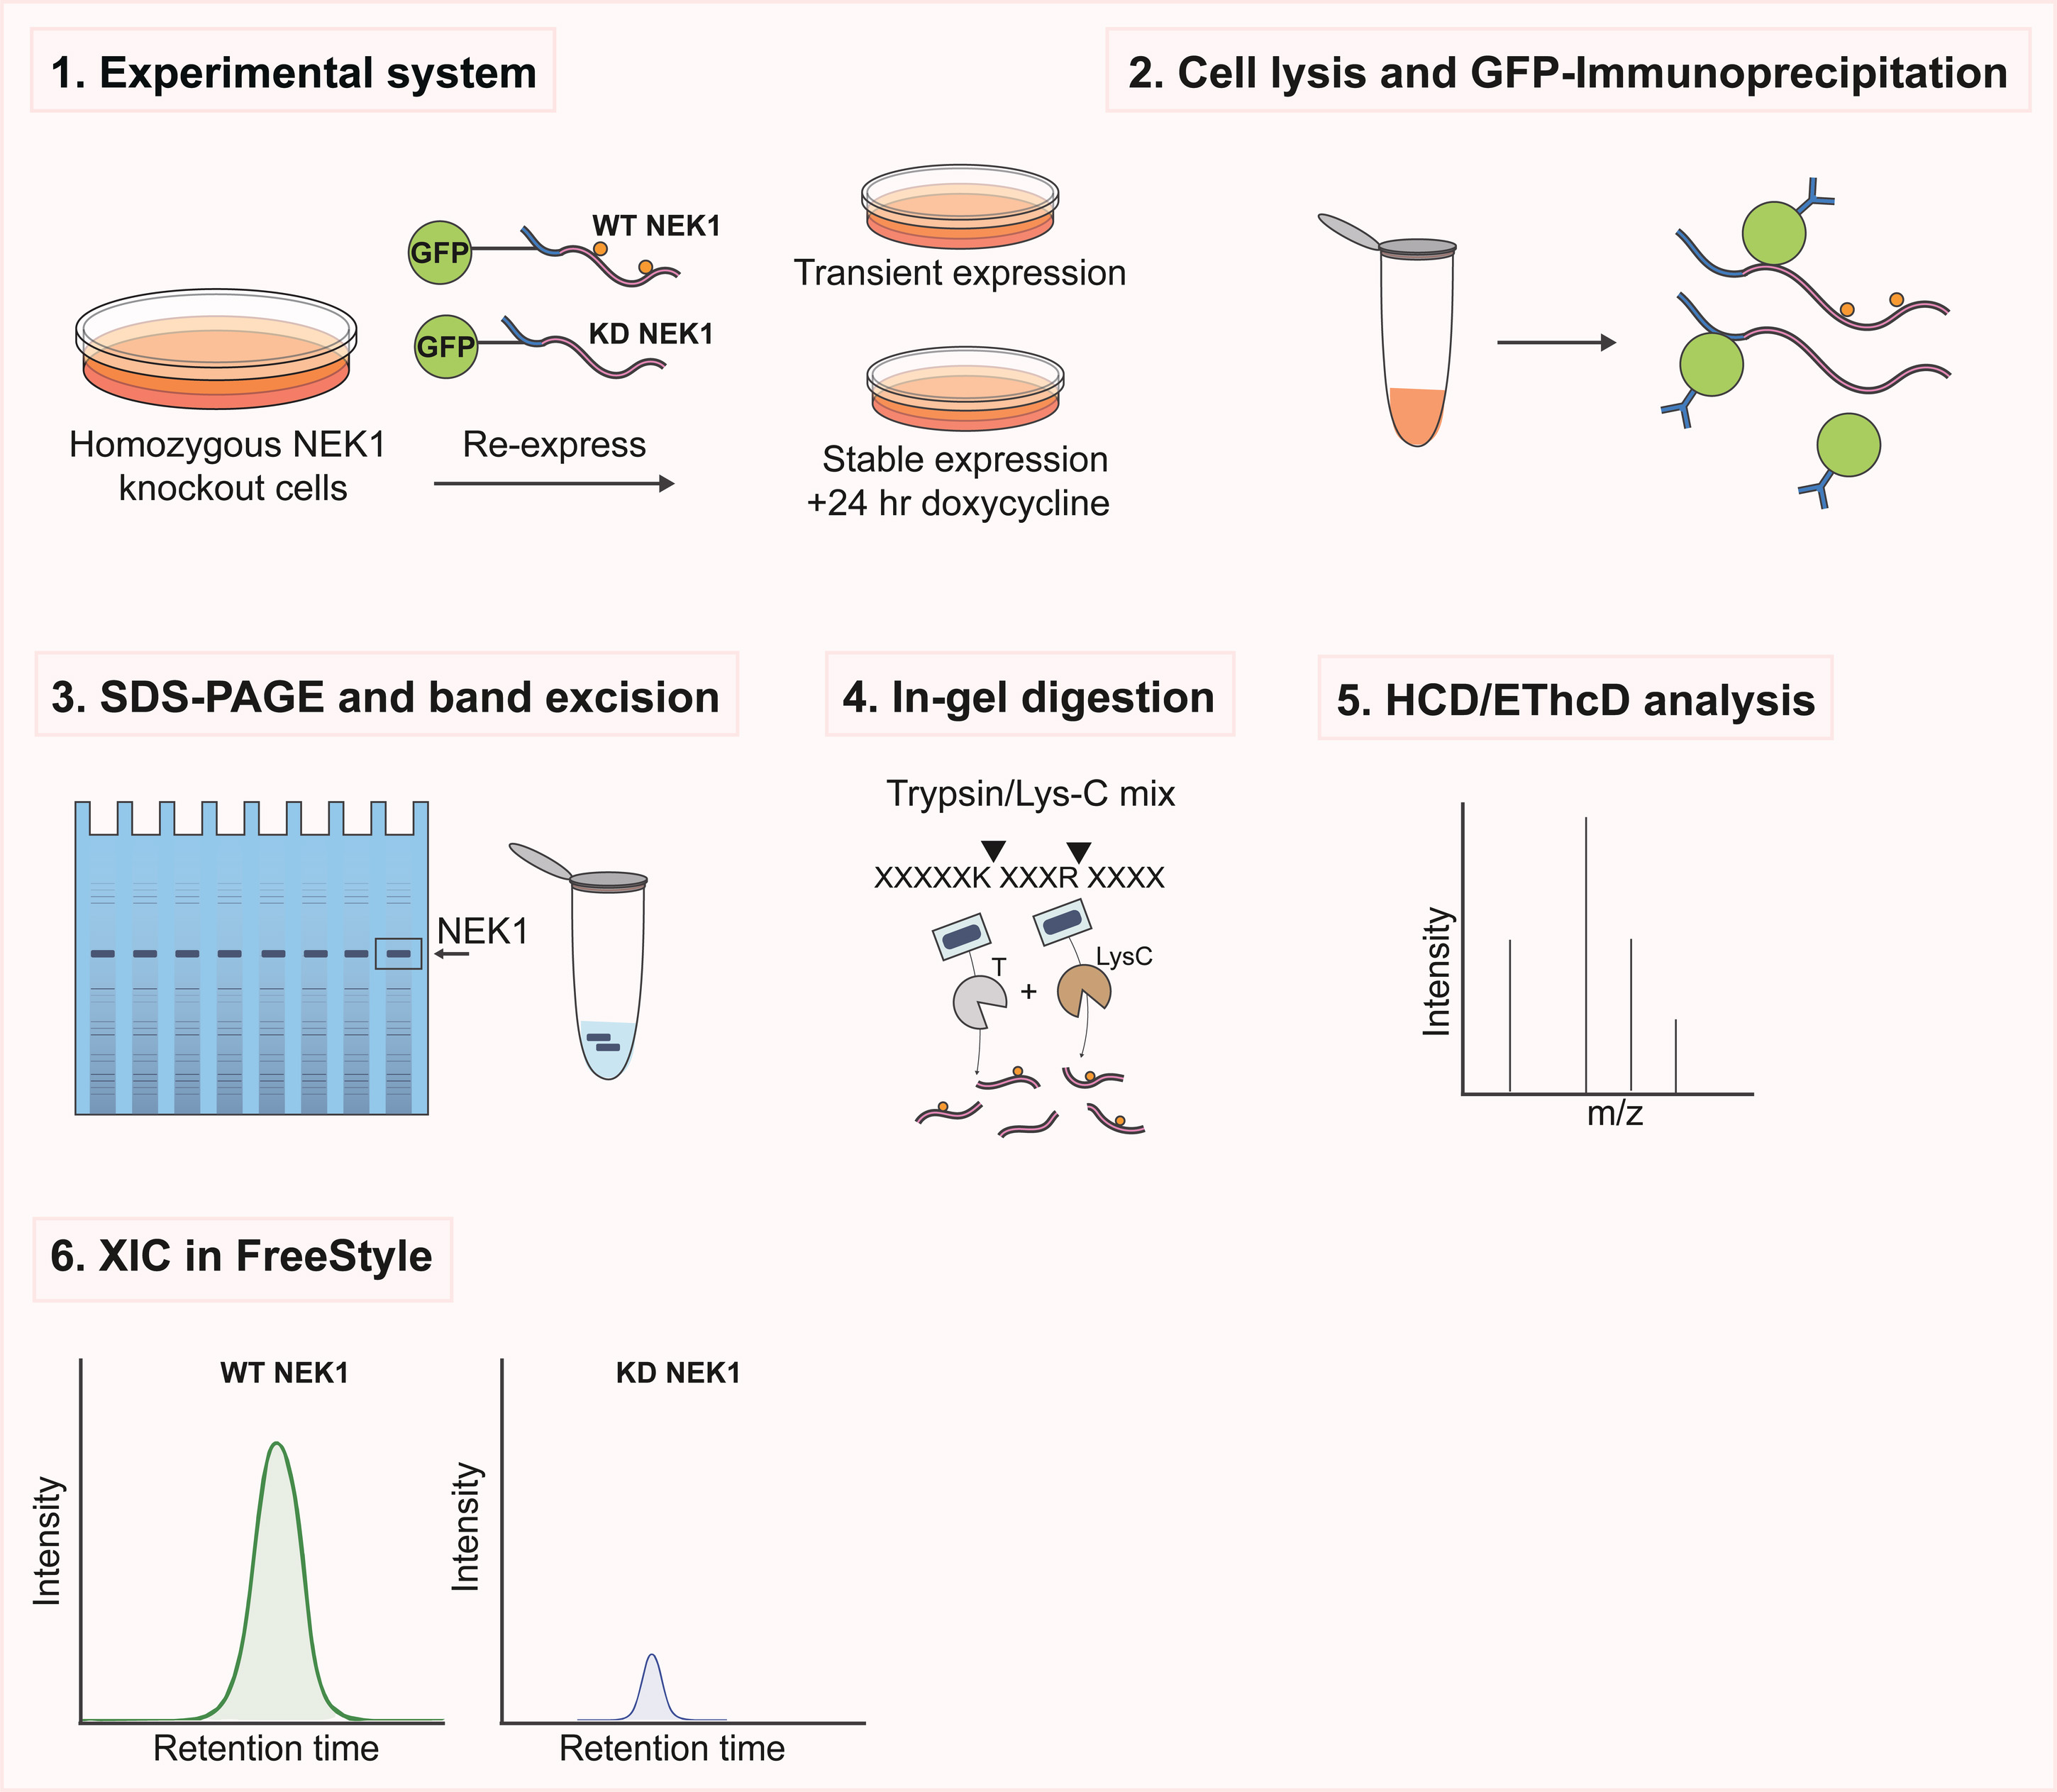
Schematic overview of the experimental workflow for kinase autophosphorylation site mapping using complementary higher energy collisional dissociation (HCD) and electron-transfer/HCD (EThcD) mass spectrometry. Steps 1–3 comprise standard cell culture, immunoprecipitation, and SDS-PAGE procedures that can be performed using established protocols appropriate to the experimental system; the specific conditions used for NEK1 are described in the associated research article [1]. Homozygous NEK1 knockout cells expressing GFP-tagged wild-type (WT) or kinase-dead (KD) NEK1 were used to enable comparison of kinase activity–dependent phosphorylation events in the absence of endogenous NEK1. Subsequent steps (4–6), described in detail in this protocol, comprise excision of the target protein band, in-gel trypsin/Lys-C digestion, LC-MS/MS analysis using complementary HCD and EThcD fragmentation for phosphosite identification and localisation, and quantitative extracted ion chromatogram (XIC) analysis.
Background
Identifying autophosphorylation sites on a specific kinase in cells presents distinct methodological challenges. Whole-proteome phosphoproteomic approaches are poorly suited to this task: endogenous kinases are often expressed at low abundance, and kinase-derived phosphopeptides are vastly outnumbered by background, making bona fide autophosphorylation events difficult to identify with confidence.
The approach described here addresses these limitations through (i) the use of a homozygous knockout cellular background to eliminate endogenous kinase signal; (ii) immunoprecipitation and SDS-PAGE-based enrichment of the target kinase prior to MS analysis; (iii) identifying kinase-activity-dependent phosphorylation events and prioritising candidate autophosphorylation sites; and (iv) complementary higher energy collisional dissociation (HCD) and electron-transfer/HCD (EThcD) fragmentation to increase phosphosite localisation confidence, particularly where HCD alone provides ambiguous site assignment.
This protocol was deployed to identify autophosphorylation sites on NEK1, a serine/threonine kinase whose variants are among the most common genetic causes of amyotrophic lateral sclerosis (ALS). Using this approach, we identified three rigorously validated NEK1 autophosphorylation sites (pS14, pT156, and pS418), further confirmed by phosphospecific antibodies; activation-loop pT156 was then used as an activity readout and shown to be altered by several ALS-associated missense variants [1]. The protocol is, however, applicable to any kinase for which specific immunoprecipitation can be achieved, and a kinase-dead control can be generated [2].
Materials and reagents
Biological materials
1. NEK1 knockout U-2 OS Flp-In T-REx cells (generated by CRISPR-Cas9 nickase, biallelic frameshift confirmed by MiSeq; available upon request from A.R.M.)
2. GFP-NEK1 wild-type and GFP-NEK1 kinase-dead (D146A) expression constructs (available upon request from A.R.M.)
Note: The NEK1 knockout cell line and GFP-NEK1 expression constructs are specific to the experimental system used to validate this protocol. The downstream workflow can be adapted to other kinases using an appropriate cellular background, expression system, and kinase-dead control.
Reagents
1. Colloidal Blue Staining kit (protein gel stain) (Thermo Fisher Scientific, catalog number: LC6025)
2. 1 M triethylammonium bicarbonate (TEAB) buffer (Fisher Scientific, catalog number: 15215753)
3. Bond-BreakerTM TCEP solution, neutral pH (0.5 M) (reducing agent) (Thermo Fisher Scientific, catalog number: 77720/Fisher UK 10657344)
4. Iodoacetamide (IAA) (alkylating agent) (Sigma-Aldrich, catalog number: I1149)
5. LC-MS-grade water (solvent) (Fisher Scientific, catalog number: 10434902)
6. 100% acetonitrile, LC-MS grade (solvent) (Fisher Scientific, catalog number: 10055454)
7. Ammonium bicarbonate (compound) (Sigma-Aldrich, catalog number: A6141)
8. Trypsin/Lys-C protease mix (enzyme) (Thermo Fisher Scientific, catalog number: A41007)
9. CaCl2 (enzyme stabilizer) (Sigma-Aldrich, catalog number: C1016)
10. Formic acid (LC-MS solvent modifier) (Merck, catalog number: 1.00263)
11. n-Dodecyl-β-D-maltoside (DDM) (LC-MS additive/detergent) (Thermo Fisher Scientific, catalog number: 89902)
12. Trifluoroacetic acid (TFA) (LC-MS grade) (LC-MS solvent modifier) (Thermo Fisher Scientific, catalog number: 85183)
13. Pierce HeLa protein digest standard (Thermo Fisher Scientific, catalog number: 88329)
Solutions
1. 50 mM TEAB (see Recipes)
2. 120 mM TCEP (see Recipes)
3. 0.5 M iodoacetamide (see Recipes)
4. Trypsin/Lys-C digestion buffer (see Recipes)
5. 80% ACN/0.5% TFA (see Recipes)
6. Peptide resuspension buffer (see Recipes)
7. 50 mM ammonium bicarbonate (see Recipes)
8. 50 mM ammonium bicarbonate in 50% acetonitrile (see Recipes)
9. 0.1% TFA (see Recipes)
10. LC solvent A (see Recipes)
11. LC solvent B (see Recipes)
Recipes
1. 50 mM TEAB
a. To prepare 10 mL, combine 0.5 mL of 1 M TEAB stock with 9.5 mL of LC-MS-grade water.
b. Prepare fresh on the day of use.
2. 120 mM TCEP (in 50 mM TEAB)
a. Use 0.5 M Bond-BreakerTM TCEP solution, neutral pH, as the stock solution.
b. To prepare 1 mL, combine 240 μL of 0.5 M TCEP stock with 760 μL of 50 mM TEAB.
3. 0.5 M iodoacetamide (in 50 mM TEAB)
a. To prepare 1 mL, dissolve 92.5 mg of IAA in 50 mM TEAB and adjust to a final volume of 1 mL.
b. Prepare fresh immediately before use and protect from light throughout preparation and use.
4. Trypsin/Lys-C digestion buffer
a. Prepare 50 mM TEAB containing 2.5 mM CaCl2.
b. Resuspend trypsin/Lys-C protease mix according to the manufacturer's instructions and prepare sufficient digestion solution to provide 2 μg of enzyme per sample.
c. For each sample, prepare 100 μL of digestion solution containing 2 μg of trypsin/Lys-C.
d. Prepare fresh immediately before use.
5. 80% ACN/0.5% TFA
a. To prepare 10 mL, combine 8 mL of LC-MS-grade acetonitrile, 50 μL of TFA, and LC-MS-grade water to a final volume of 10 mL.
b. Prepare fresh on the day of use.
6. Peptide resuspension buffer
a. Prepare fresh using LC-MS-grade water and 0.1% formic acid.
b. Add n-dodecyl-β-D-maltoside (DDM) to a final concentration of 0.015% (w/v).
c. Reconstitute dried peptide pellets with 10 min of gentle shaking before transferring to a suitable vial and loading the LC autosampler.
7. 50 mM ammonium bicarbonate
a. To prepare 10 mL, dissolve 39.5 mg of ammonium bicarbonate in LC-MS-grade water and adjust to a final volume of 10 mL.
b. Prepare fresh on the day of use.
8. 50 mM ammonium bicarbonate in 50% acetonitrile
a. To prepare 10 mL, combine 5 mL of 100 mM ammonium bicarbonate (79.1 mg in 10 mL of LC-MS-grade water) with 5 mL of LC-MS-grade acetonitrile.
b. Prepare fresh on the day of use.
9. 0.1% (v/v) TFA
To prepare 10 mL, add 10 μL of TFA to LC-MS-grade water to a final volume of 10 mL. Used only for the optional C18 clean-up in Stage 6.
10. LC solvent A: 0.1% (v/v) formic acid in LC-MS-grade water
To prepare 1 L, add 1 mL of formic acid to 999 mL of LC-MS-grade water.
11. LC solvent B: 80% (v/v) acetonitrile, 0.08% (v/v) formic acid in LC-MS-grade water
To prepare 1 L, combine 800 mL of LC-MS-grade acetonitrile, 0.8 mL of formic acid, and LC-MS-grade water to 1 L.
Laboratory supplies
1. 1.5 mL protein low-binding microcentrifuge tubes (Sarstedt, catalog number: 72.706.600)
2. 1–200 μL round gel loading tips (Starlab, catalog number: I1022-0600), for removing wash solutions from around gel pieces without aspirating them
3. Disposable sterile scalpels (Swann-Morton, catalog number: DS11)
4. Clean glass plate or disposable Petri dish as a cutting surface, rinsed with LC-MS-grade water immediately before use
5. LC-MS vials and caps (FisherbrandTM 11 mm Snap Ring Micro-Vial, Plastic, catalog number: 11717597; VWR Snap Caps for Snap Ring Vials ND11, catalog number: 548-0016)
6. Powder-free nitrile gloves (worn at all times)
7. Aluminium foil for protecting iodoacetamide-containing samples from light
8. Microcentrifuge tube racks
9. C18 desalting tips (e.g., Waters, catalog number: WAT0200805), required only if the optional peptide clean-up step is performed
Equipment
1. ThermoMixer (Eppendorf)
2. SpeedVac vacuum concentrator (Thermo, model: Savant SPD140DDA)
3. Scalpel and clean cutting surface
4. Dry ice
5. Orbitrap Lumos Tribrid mass spectrometer (Thermo Scientific) with EASY-nESI source
6. Dionex Ultimate 3000 nano-LC system
7. EASY-SprayTM HPLC Column (Thermo ScientificTM, catalog number: ES903, 2 µm, 100 Å, 75 µm × 50 cm)
8. Acclaim PepMap 100 C18 trapping column (Thermo ScientificTM, catalog number: 164564, 150 mm × 0.1 mm × 5 µm)
9. Nano-LC fittings and consumables: nanoViper fingertight fittings and PEEK/fused-silica capillary tubing (20–50 µm i.d.) for all post-column connections; use the minimum practicable tubing length to limit extra-column dispersion
Note: Recommended maintenance: replace the trapping column every ~500 injections or sooner if carryover increases; clean the ion transfer tube monthly; run a standard peptide mixture (e.g., Pierce HeLa protein digest standard) before each sample batch to confirm chromatographic and spectral performance.
Software and datasets
1. FreeStyle software v1.5 (Thermo Fisher Scientific; available via https://thermo.flexnetoperations.com/control/thmo/login), used here for XIC extraction and integration
2. Proteome Discoverer 2.4 (Thermo Scientific), used for database searching and phosphosite localisation
3. Mascot v2.8.3 (Matrix Science; requires institutional license), used as the search engine within the associated workflow
4. AlphaMap (Voytik et al. [3]; open-source Python package)
5. Skyline v25.1 (MacCoss Lab, University of Washington), used for TIC-normalised XIC analysis in the associated NEK1 study
Note: Proteome Discoverer and Mascot are commercial products and require a paid institutional licence; Mascot additionally requires access to a local or hosted Mascot server. FreeStyle is distributed free of charge by Thermo Fisher Scientific but requires registration of a user account and reads only Thermo .RAW files. Skyline is free and open source and reads Thermo, Bruker, SCIEX, Agilent, and Waters formats. Open-source alternatives: Laboratories without Proteome Discoverer/Mascot licences can perform equivalent database searching and phosphosite localisation using FragPipe/MSFragger with PTM-Prophet, MaxQuant with the Andromeda search engine and its PTM score, or the Trans-Proteomic Pipeline (Comet with PTMProphet). For XIC generation and integration, Skyline is a fully open-source substitute for FreeStyle and is the software used for the quantification reported in the associated research article [1]. Localisation-probability thresholds should be applied on the equivalent scale reported by the chosen tool.
Procedure
The overall workflow includes standard upstream cell culture, expression, immunoprecipitation, and SDS-PAGE procedures to generate the kinase-containing gel band used for downstream analysis. These procedures can be performed using established methods appropriate to the experimental system, and the specific conditions used for NEK1 are described in the associated research article [1]. The detailed procedure below describes gel-band processing, in-gel proteolytic digestion, LC-MS/MS acquisition, phosphosite identification and localisation, and quantitative XIC analysis.
Critical: Always use LC-MS-grade solvents and reagents throughout. Handle all gel pieces and peptide samples in low-binding tubes to minimise adsorptive losses.
A. Stage 1: Gel band excision
1. Following SDS-PAGE, stain the gel using the Colloidal Blue Staining kit according to the manufacturer's instructions verbatim. In the NEK1 workflow, gels were stained for 3–6 h and subsequently destained overnight in LC-MS-grade water until protein bands were clearly visible against a transparent background.
2. Identify the band corresponding to the immunoprecipitated kinase using its expected molecular mass and the corresponding immunoprecipitation/SDS-PAGE controls. Excise only the band corresponding to the target protein to minimise contamination from neighbouring proteins.
3. Using a clean disposable scalpel, excise the target band and transfer it to 1.5 mL protein low-binding microcentrifuge tubes.
4. Cut excised bands into approximately 1 mm3 cubes. Add 50 mM TEAB in 25 μL increments until the gel pieces are just submerged (typically 50–100 μL for a single 5 mm × 5 mm band).
Note: Keeping gel pieces small (approximately 1 mm3) maximises enzyme access and extraction efficiency in downstream steps.
B. Stage 2: Reduction and alkylation
1. Add TCEP to a final concentration of 5 mM. Incubate at 55 °C for 15 min with mixing in a thermomixer (1,100 rpm) to reduce disulfide bonds.
2. Cool to room temperature for 5 min on the bench. Add iodoacetamide to a final concentration of 20 mM. Incubate at 30 °C for 30 min in the dark (covered in aluminium foil) with mixing in a thermomixer (1,100 rpm) to alkylate free cysteine residues.
Critical: Prepare iodoacetamide fresh immediately before use. Protect from light throughout.
Note: For all wash steps below, remove the supernatant carefully using a gel loading tip positioned at the side of the tube without aspirating the gel pieces.
C. Stage 3: Washing and destaining of gel pieces
1. Remove the reduction/alkylation solution. Add LC-MS-grade water and incubate for 10 min at room temperature with mixing.
2. Remove water. Add 100% acetonitrile and incubate for approximately 5 min with mixing until gel pieces shrink and turn white.
3. Remove acetonitrile. Add 50 mM ammonium bicarbonate to rehydrate gel pieces, incubating for 10 min at room temperature with mixing in a thermomixer (1,100 rpm).
4. Remove ammonium bicarbonate.
5. Add 50 mM ammonium bicarbonate in 50% acetonitrile, incubating for 10 min at room temperature and mixing in a thermomixer (1,100 rpm).
6. Repeat steps C4–5 until the residual blue stain from the gel pieces has disappeared.
Pause point: If destaining is incomplete at the end of the day, gel pieces can be left overnight at 4 °C in the step C5 buffer (50 mM ammonium bicarbonate in 50% acetonitrile) and the procedure resumed at step C7 the following morning.
7. Remove the ammonium bicarbonate wash. Add 100% acetonitrile to dehydrate gel pieces, then allow to air-dry completely at room temperature (approximately 20–30 min).
Note: Thorough destaining is important; residual Coomassie can inhibit trypsin and increase background in the MS run. Do not abbreviate this step.
D. Stage 4: Tryptic digestion
1. Prepare the digestion mixture by resuspending trypsin/Lys-C protease mix in 50 mM TEAB containing 2.5 mM CaCl2, at 2 μg of enzyme per sample.
Note: A trypsin/Lys-C mix is used rather than trypsin alone because Lys-C cleaves efficiently at lysine residues that trypsin cleaves poorly—those followed by proline, flanked by acidic residues, or adjacent to a phosphorylated residue—and it retains activity within the gel matrix, where digestion is diffusion-limited. The combination, therefore, reduces missed cleavages and gives shorter, more uniformly sized peptides, and is now supplied by the manufacturer as a standard digestion reagent. This matters for autophosphosite mapping because a missed cleavage moves a site into a longer, more highly charged peptide that is harder to detect, fragment, and localise, and because phosphorylation itself can suppress tryptic cleavage at a neighbouring lysine or arginine. We expect the same benefit for other kinases. Where candidate sites fall in tryptic peptides that are too short (<6 residues), too long, or Ser/Thr-rich, a parallel digest with a complementary protease (e.g., chymotrypsin, Glu-C, or Asp-N) should be considered, both to bring each site into a peptide of suitable size and to provide an independent assignment.
2. Add 20 μL of the digestion solution to the dried gel pieces—enough to rehydrate them fully without leaving a large excess of supernatant. Incubate at 37 °C for 1 h to allow the enzyme to be absorbed into the gel matrix.
3. Inspect the tubes after the 1-h absorption. If the gel pieces are no longer covered by liquid, add 50 mM TEAB containing 2.5 mM CaCl2 in 5 μL increments until they are just submerged, to a typical final volume of 25 μL. Transfer to 30 °C for overnight digestion (12–14 h) while mixing at 500 rpm in a thermomixer.
Critical: Kinase-dead samples must be processed identically alongside wild-type samples and should always be injected first during LC-MS/MS acquisition to minimise carryover bias and serve as the internal negative control for autophosphorylation.
E. Stage 5: Peptide extraction
1. The following morning, collect the supernatant containing released peptides into fresh low-binding tubes.
2. Add 100% acetonitrile to the gel pieces. Incubate at 25 °C for 15 min to shrink gel pieces and extract residual peptides. Collect the supernatant and pool with the previous fraction.
3. Add 80% acetonitrile/0.5% TFA to the gel pieces. Incubate at 25 °C for 15 min. Collect the supernatant and pool with previous fractions.
4. Snap-freeze the pooled supernatant on dry ice, then dry completely in a SpeedVac vacuum concentrator.
5. Store dried peptide pellets at -20 °C until LC-MS/MS analysis.
Pause point: Dried peptide samples can be stored at -20 °C for several weeks without significant degradation.
F. Stage 6: LC-MS/MS acquisition
1. Reconstitute dried peptides in 30 μL of peptide resuspension buffer and shake sample tubes for 10 min prior to loading into the LC autosampler.
Optional: If the digest is expected to contain residual salts or detergent, desalt the reconstituted peptides on a C18 tip before injection. Condition the tip with 2 × 20 μL of 100% acetonitrile, equilibrate with 2 × 20 μL of 0.1% (v/v) trifluoroacetic acid, load the acidified sample by ten slow aspiration/dispense cycles, wash with 3 × 20 μL of 0.1% (v/v) trifluoroacetic acid, and elute with 2 × 20 μL of 50% (v/v) acetonitrile/0.1% (v/v) formic acid. Dry in the SpeedVac and reconstitute in 30 μL of peptide resuspension buffer as above. Note that C18 clean-up typically costs 10%–20% of peptide recovery and should be omitted where the sample is limiting. C18 clean-up does not remove polymer contaminants (e.g., polyethylene glycol or polysiloxane series in the MS1 spectra); these indicate contamination introduced during sample preparation, and the affected sample should be re-prepared using clean, LC-MS-grade consumables rather than desalted.
2. Use a trap-and-elute method on the nano-LC system. Load peptides onto an Acclaim PepMap 100 C18 trapping column (150 mm × 0.1 mm, 5 μm) using the nano-LC loading pump at a flow rate of 5 μL/min, and elute bound peptides onto an ES903 C18 reverse-phase column (2 μm particles, 100 Å pore size, 75 μm × 50 cm) for separation at a flow rate of 300 nL/min.
3. Separate peptides using the following gradient: 5–45 min, linear ramp from 3% to 35% solvent B (80% acetonitrile, 0.08% formic acid in water); 45–47 min, ramp to 95% solvent B; total run time 70 min. Solvent A is 0.1% formic acid in water.
Note: The gradient is set out explicitly in Table 1. Solvent A is 0.1% (v/v) formic acid in LC-MS-grade water; solvent B is 80% (v/v) acetonitrile, 0.08% (v/v) formic acid in LC-MS-grade water. The analytical flow rate is 300 nL/min throughout. Injection volume is 5 μL of the 30 μL reconstituted sample (i.e., approximately one sixth of the digest); the loading pump delivers this to the trapping column at 5 μL/min in 0.1% (v/v) trifluoroacetic acid over 5 min before valve switching.
Table 1. Nano-LC gradient for phosphopeptide separation
| Time (min) | Flow rate (nL/min) | Solvent A (%) | Solvent B (%) | Stage |
|---|---|---|---|---|
| 0 | 300 | 97 | 3 | Equilibration/sample loading onto trap column |
| 5 | 300 | 97 | 3 | Valve switch; start of analytical gradient |
| 45 | 300 | 65 | 35 | Linear separation gradient (40 min) |
| 47 | 300 | 5 | 95 | Ramp to high organic |
| 55 | 300 | 5 | 95 | Column wash |
| 68 | 300 | 97 | 3 | Return to starting conditions |
| 70 | 300 | 97 | 3 | Column re-equilibration; end of run |
Quality control checkpoint: Before injecting samples, run one solvent blank followed by one injection of a commercial tryptic digest standard (e.g., 50 ng of Pierce HeLa protein digest standard). Acceptable performance is >2,000 protein groups identified, a stable spray current with <10% total ion current fluctuation across the gradient, and a median chromatographic peak width at half height of <20 s. Inject a solvent blank between every sample and confirm that the XIC signal for the target phosphopeptide in the blank is <1% of that in the preceding sample. If carryover exceeds this, add a second blank and a high-organic wash before continuing. Always inject the kinase-dead sample before the corresponding wild-type sample.
4. Set instrument source parameters: Spray voltage 2 kV; RF lens 30%; ion transfer tube temperature 300 °C.
5. Acquire full-scan MS1 spectra in the Orbitrap over m/z 375–1,500 at a resolution of 120,000 (at 200 m/z). Set AGC target to standard. Operate in positive ion, data-dependent top speed mode with a cycle time of 3 s.
6. Select precursor ions with charge states 2–7 and intensity above 50,000 for MS2 using an isolation window of 1.6 m/z and dynamic exclusion of 30 s.
7. Record all MS2 spectra in centroid mode with AGC target set to standard and maximum fill time of 50 ms.
8. Perform two separate acquisition runs per sample using different fragmentation methods:
a. Run 1: HCD: Normalised collision energy (NCE) 30%.
b. Run 2: EThcD: Supplemental activation (SA) 35%. This method generates both c/z ions (ETD component) and b/y ions (supplemental HCD activation), providing complementary and superior phosphosite localisation for labile PTMs.
All other acquisition parameters were identical to the HCD run, and instrument defaults were used; the only EThcD-specific setting is the supplemental activation (SA) collision energy of 35%, applied after ETD fragmentation has occurred. The higher value relative to the HCD NCE (30%) is used because EThcD is best suited to larger peptides that fragment poorly under HCD.
Critical: Do not multiplex HCD and EThcD within a single run. Two independent runs per sample are required.
Note: EThcD is particularly advantageous for multiply phosphorylated or Ser/Thr-rich peptides, where standard HCD can produce ambiguous site assignments due to neutral loss-dominated fragmentation.
G. Stage 7: Database search and phosphosite localisation
1. Import .RAW files into Proteome Discoverer 2.4 and search using Mascot (v2.8.3). Specify the protein sequence database explicitly in your own records. In the associated research article [1], an in-house composite database (MRC PPU “MRC database 1”) was used with no taxonomy restriction. For general use, we recommend the UniProtKB/Swiss-Prot reviewed human proteome (UP000005640; state the release used, e.g., 2025_03, and the number of sequences), appended with the sequence of the tagged construct under study (e.g., GFP-NEK1) and with the cRAP common contaminant database (https://www.thegpm.org/crap/) to allow keratin, trypsin, albumin, and other common contaminant peptides to be recognised rather than misassigned. Enable a decoy search using a reversed (or pseudo-reversed) version of the target database, and apply the Percolator node in Proteome Discoverer to control the false discovery rate. Filter peptide-spectrum matches at 1% FDR (q ≤ 0.01, “High” confidence) and report protein-level identifications at 1% FDR. State both thresholds in any resulting publication.
Note: In the associated research article, phosphosite assignments were curated using a Mascot ion score >19 together with a localisation probability ≥85% from the ptmRS node in Proteome Discoverer rather than a Percolator q-value cutoff. The 1% FDR/decoy strategy described here is the recommended default for laboratories adopting this protocol de novo and gives a more conservative and more widely comparable identification list.
2. Apply the following search parameters:
a. Precursor mass tolerance: 10 ppm.
b. Fragment mass tolerance: 0.06 Da.
c. Maximum missed cleavages: 2.
d. Fixed modification: Carbamidomethylation (Cys).
e. Variable modifications: Oxidation (Met), Dioxidation (Met), Phosphorylation (Ser, Thr, Tyr).
3. Assess phosphosite localisation using both the Mascot delta score and the ptmRS node within Proteome Discoverer. Set ptmRS mass tolerance to 0.5 Da. Enable neutral loss peak consideration for both HCD and EThcD spectra.
4. Accept phosphorylation site assignments only when the peptide identification exceeds the Mascot significance threshold calculated for the specific database and search parameters used. Assess phosphosite localisation using both Mascot Site Analysis and the ptmRS node in Proteome Discoverer. Accept phosphosite localisation when ptmRS probability is ≥85%. If ptmRS is not computed, accept sites with Mascot PTM confidence ≥85% and flag these cases accordingly.
Note: In the associated NEK1 study, curated high-confidence phosphosite assignments required a Mascot ion score >19, together with ptmRS probability ≥85%; where ptmRS was not computed, sites with Mascot PTM confidence ≥85% were retained and flagged.
5. Optionally, map accepted phosphosites onto AlphaFold2-predicted structural models using AlphaMap [3] to contextualise their positions relative to protein sequence, domain architecture, and predicted structural accessibility.
H. Stage 8: Extracted ion chromatogram (XIC) analysis using FreeStyle
Stage 8 converts the qualitative site assignments from Stage 7 into a relative quantitative comparison between conditions. In the associated research article, XIC-based quantification was performed in Skyline v25.1 with total ion current (TIC) normalisation. The FreeStyle workflow described below is a Thermo-native alternative that requires no commercial licence and operates directly on .RAW files; peak areas can subsequently be normalised either to unmodified reference peptides from the target protein or to TIC. Annotated screenshots of every step are provided in Figure 1. This section assumes no prior experience with targeted proteomics software.
H1. Calculating the precursor m/z of a phosphopeptide
Before a chromatogram can be extracted, the precursor mass-to-charge ratio (m/z) of the target phosphopeptide must be known. This can be read directly from the Proteome Discoverer or Mascot result for the peptide-spectrum match and should also be calculated independently as a check. The monoisotopic mass of the neutral peptide (M) is the sum of the monoisotopic residue masses plus the mass of water (18.0106 Da). Each phosphorylation adds 79.9663 Da (HPO3); the carbamidomethylation introduced in Stage 2 adds 57.0215 Da per cysteine; oxidation of methionine adds 15.9949 Da. The m/z observed at charge state z is then:
m/z = (M + z × 1.00728)/z
where 1.00728 Da is the mass of a proton. Note that a single phosphorylation shifts the precursor by 39.983 m/z units for a 2+ ion and 26.655 m/z units for a 3+ ion relative to the unmodified peptide—a useful sanity check when locating the phosphopeptide alongside its unmodified counterpart.
Worked example: The NEK1 tryptic peptide APFLGSGGTIAPSSFSSR carries pSer428 (Ser6 within the peptide). The residue masses sum to 1,719.8580 Da; adding water gives a neutral unmodified mass of 1,737.8686 Da, and adding one phosphate gives 1,817.8349 Da. For the doubly protonated species, m/z = (1,817.8349 + 2 × 1.00728)/2 = 909.9247. The value observed experimentally was 909.9266, a mass error of +2.1 ppm—comfortably within the 10 ppm precursor tolerance used in Stage 7, and therefore the correct value to enter into FreeStyle. Table 2 gives the same calculation for all NEK1 phosphopeptides for which annotated spectra are reported in the associated research article; every calculated value agrees with the observed value to within 3 ppm.
Table 2. Worked precursor m/z calculations for NEK1 phosphopeptides.
Monoisotopic values. The theoretical m/z is the value entered in the Ranges column of the FreeStyle Chromatogram Ranges panel (Figure 1B, callout 5). Observed values are those reported for the corresponding peptide-spectrum matches in the associated research article. Site numbering refers to NEK1 isoform 3.
| Phosphopeptide | Site | Neutral M, unmodified (Da) | Neutral M, +1 phospho (Da) | z | Theoretical m/z | Observed m/z | Error (ppm) |
|---|---|---|---|---|---|---|---|
| APFLGSGGTIAPSSFSSR | pSer428 | 1737.8686 | 1817.8349 | 2+ | 909.9247 | 909.9266 | 2.1 |
| PLITGEK | pThr876 | 756.4381 | 836.4044 | 2+ | 419.2095 | 419.2095 | 0.0 |
| NKNSLLIGLSTGLFDANNPK | pSer1058 | 2115.1324 | 2195.0987 | 2+ | 1098.5566 | 1098.5580 | 1.2 |
| LFRTLMDVPTVGDVR | pThr1090 | 1717.9184 | 1797.8847 | 2+ | 899.9497 | 899.9522 | 2.8 |
| LFRTLMDVPTVGDVR | pThr1090 | 1717.9184 | 1797.8847 | 3+ | 600.3022 | 600.3016 | −1.0 |
| TLMDVPTVGDVR | pThr1096 | 1301.6649 | 1381.6312 | 2+ | 691.8229 | 691.8244 | 2.2 |
Critical: The same peptide is frequently observed at more than one charge state (rows 4 and 5 of Table 2). Extract and integrate each charge state separately and sum the resulting peak areas, or use a single charge state consistently across every sample in the comparison. Mixing charge states between conditions is a common source of spurious fold-change.
H2. Generating and integrating extracted ion chromatograms in FreeStyle
1. Open FreeStyle (v1.5). In the pop-up window, under New Workspace, select From File. Navigate to the .RAW file of interest and click OK.
2. Three panels open (Figure 1A): the Chromatogram panel (top, callout 1), which, by default, displays the base peak chromatogram for the whole run; the Spectrum panel (middle, callout 2), which displays the mass spectrum at the retention time currently selected in the Chromatogram panel; and the Chromatogram Ranges panel (bottom, callout 3), in which the trace to be displayed is defined.
3. In the Chromatogram Ranges panel, configure the first row as follows (Figure 1B): set Detector Type to MS; set the Filter column to MS, so that only MS1 scans are considered (callout 3); set Trace Type to Mass Range (callout 4); and enter the theoretical precursor m/z calculated above in the Ranges column, to four decimal places (callout 5). Set Mass Tolerance to 5 ppm (callout 6); widen to 10 ppm only if the instrument was not calibrated immediately before the batch. Press Enter to apply. The Chromatogram panel now displays the extracted ion chromatogram for that single m/z rather than the base peak chromatogram, and the extracted mass window and filter are echoed in the trace legend at the top right.
4. To overlay a second .RAW file in the same workspace—for example, the kinase-dead control alongside the wild-type sample—activate the next row of the Chromatogram Ranges panel by ticking its Display checkbox (Figure 1B, callout 7), select the second file from the File Name dropdown, and enter identical Filter, Trace Type, Ranges, and Mass Tolerance values. Displaying both conditions on a common axis is the clearest way to demonstrate loss of a phosphopeptide signal in the kinase-dead sample.
5. Click the title bar of the Chromatogram panel to make it the active plot. Open the Workspace Processing tab (Figure 1C, callout 1 shows the equivalent Display Options tab; the Workspace Processing tab is shown in Figure 1B, callout 1) and select Detect in Active Plot (Figure 1B, callout 2). FreeStyle integrates the detected peaks, and a Peaks List appears at the foot of the window, reporting Index, RT (min), Start RT, End RT, Base Peak, Peak Area, Peak Height, Baseline Width, and Signal-to-Noise for every peak (Figure 1C, callouts 4 and 5).
Note: To display the integrated areas on the chromatogram itself, activate the Chromatogram panel, open the Display Options tab (Figure 1C, callout 1), and enable Peak Area in the Labels group (Figure 1C, callout 2). Each integrated peak is then annotated with its retention time and area, as AA (Figure 1C, callout 3).
6. Inspect every detected peak manually before recording any area; automatic integration is a starting point, not a result. Confirm that (i) the retention time of the integrated peak agrees with the retention time of the peptide-spectrum match recorded in Proteome Discoverer, to within ±0.5 min; (ii) the peak is clearly distinguishable from local background and has an acceptable signal-to-noise ratio; peaks close to the noise floor should not be assigned quantitative fold-changes; and (iii) the corresponding peptide peak is identified at the expected RT and integrated consistently across samples using equivalent peak boundaries relative to the observed peak. Where automatic boundary placement is inaccurate, drag the handle at each end of the shaded peak area to the true peak edges, defined as the points at which the signal returns to baseline (Figure 1C).
7. Remove co-eluting background peaks that are not the target species by selecting Delete Peak in the Workspace Processing tab and clicking directly on the peak. To zoom, click and drag across the region of interest; right-click to reset the view.
8. Export the integrated data by selecting the relevant rows in the Peaks List panel (Figure 1C, callout 4), opening Workspace Options, and choosing Selection As from the Exports tab. Select .csv format. Record, for every sample, the file name, peptide sequence, modification, charge state, m/z, retention time, and peak area.
9. Normalise the phosphopeptide peak areas. Two strategies are appropriate, and the choice should be stated explicitly in any resulting publication: (1) Reference-peptide normalisation, which controls for differences in immunoprecipitation efficiency and target-protein loading: for each run, extract XICs for 3–5 unmodified tryptic peptides of the target protein that are detected in every sample and that contain no phosphorylatable residue known to be modified, integrate their peak areas, and express each phosphopeptide peak area as a ratio to the summed reference-peptide area for that run. (2) TIC normalisation, which controls for differences in total peptide load: set Trace Type to TIC in the Chromatogram Ranges panel, integrate the total ion current for the run, and divide each phosphopeptide peak area by it. Strategy (1) is preferred when comparing immunoprecipitates, because it corrects for variation in recovery of the target protein itself; strategy (2) was used in the associated research article, implemented in Skyline.
10. Compare the normalised ratios statistically. Perform the comparison on a minimum of three independent biological replicates, processed and acquired as matched wild-type and kinase-dead pairs within the same batch. Log2-transform the normalised ratios before testing, because peak-area ratios are approximately log-normally distributed and span several orders of magnitude. For a two-condition comparison (wild-type vs. kinase-dead), use an unpaired two-tailed Student's t-test on the log2 values, or a paired test where samples are batch-matched. For comparisons across more than two conditions (for example, a panel of variants), use one-way ANOVA with Dunnett's correction against the wild-type control, or a two-sided one-sample t-test against a hypothetical mean of 1, where each condition is expressed relative to the wild-type, and each comparison is a prespecified independent hypothesis, as was done in the associated research article [1]. Report the number of biological replicates, the test used, the correction applied, and mean ± SEM or ± SD. Given the small number of biological replicates, statistical tests should be interpreted alongside effect size, replicate-level values, and the underlying XIC traces; lack of statistical significance should not by itself be interpreted as evidence of no biological effect.
Critical: Where a phosphopeptide is genuinely absent from the kinase-dead sample, its peak area is zero, and the wild-type/kinase-dead ratio is undefined. Do not substitute an arbitrary value. Either report the site as “detected in wild-type only” or impute the noise floor for that run—integrate the same m/z over the expected retention-time window in the kinase-dead file and use the resulting background area—and state clearly that the resulting fold-change is a lower bound.
Expected outcome: For a kinase autophosphorylation site, the normalised XIC peak area should be markedly reduced or absent in the kinase-dead sample. In the associated research article, wild-type/kinase-dead peak-area ratios for the prioritised NEK1 sites ranged from approximately 80-fold (pThr1090) to approximately 5,051-fold (pThr156) across three independent biological replicates, whereas sites that were not activity-dependent showed ratios close to unity. A ratio close to 1 for every site examined indicates either that the kinase-dead construct retains activity, that the sites are contributed by a co-purifying kinase, or that the normalisation has failed; inspect the reference-peptide or TIC traces before interpreting further.
Quality control checkpoint: Before accepting a quantitative result, confirm that (i) the unmodified counterpart of the phosphopeptide is detected at comparable normalised abundance in both conditions, demonstrating that the target protein itself was recovered equivalently; (ii) the retention times of the phosphopeptide and its unmodified counterpart differ reproducibly and in the same direction in every run; and (iii) the blank injection acquired between the two samples contains <1% of the wild-type signal at that m/z, excluding carryover as the source of any residual kinase-dead signal.
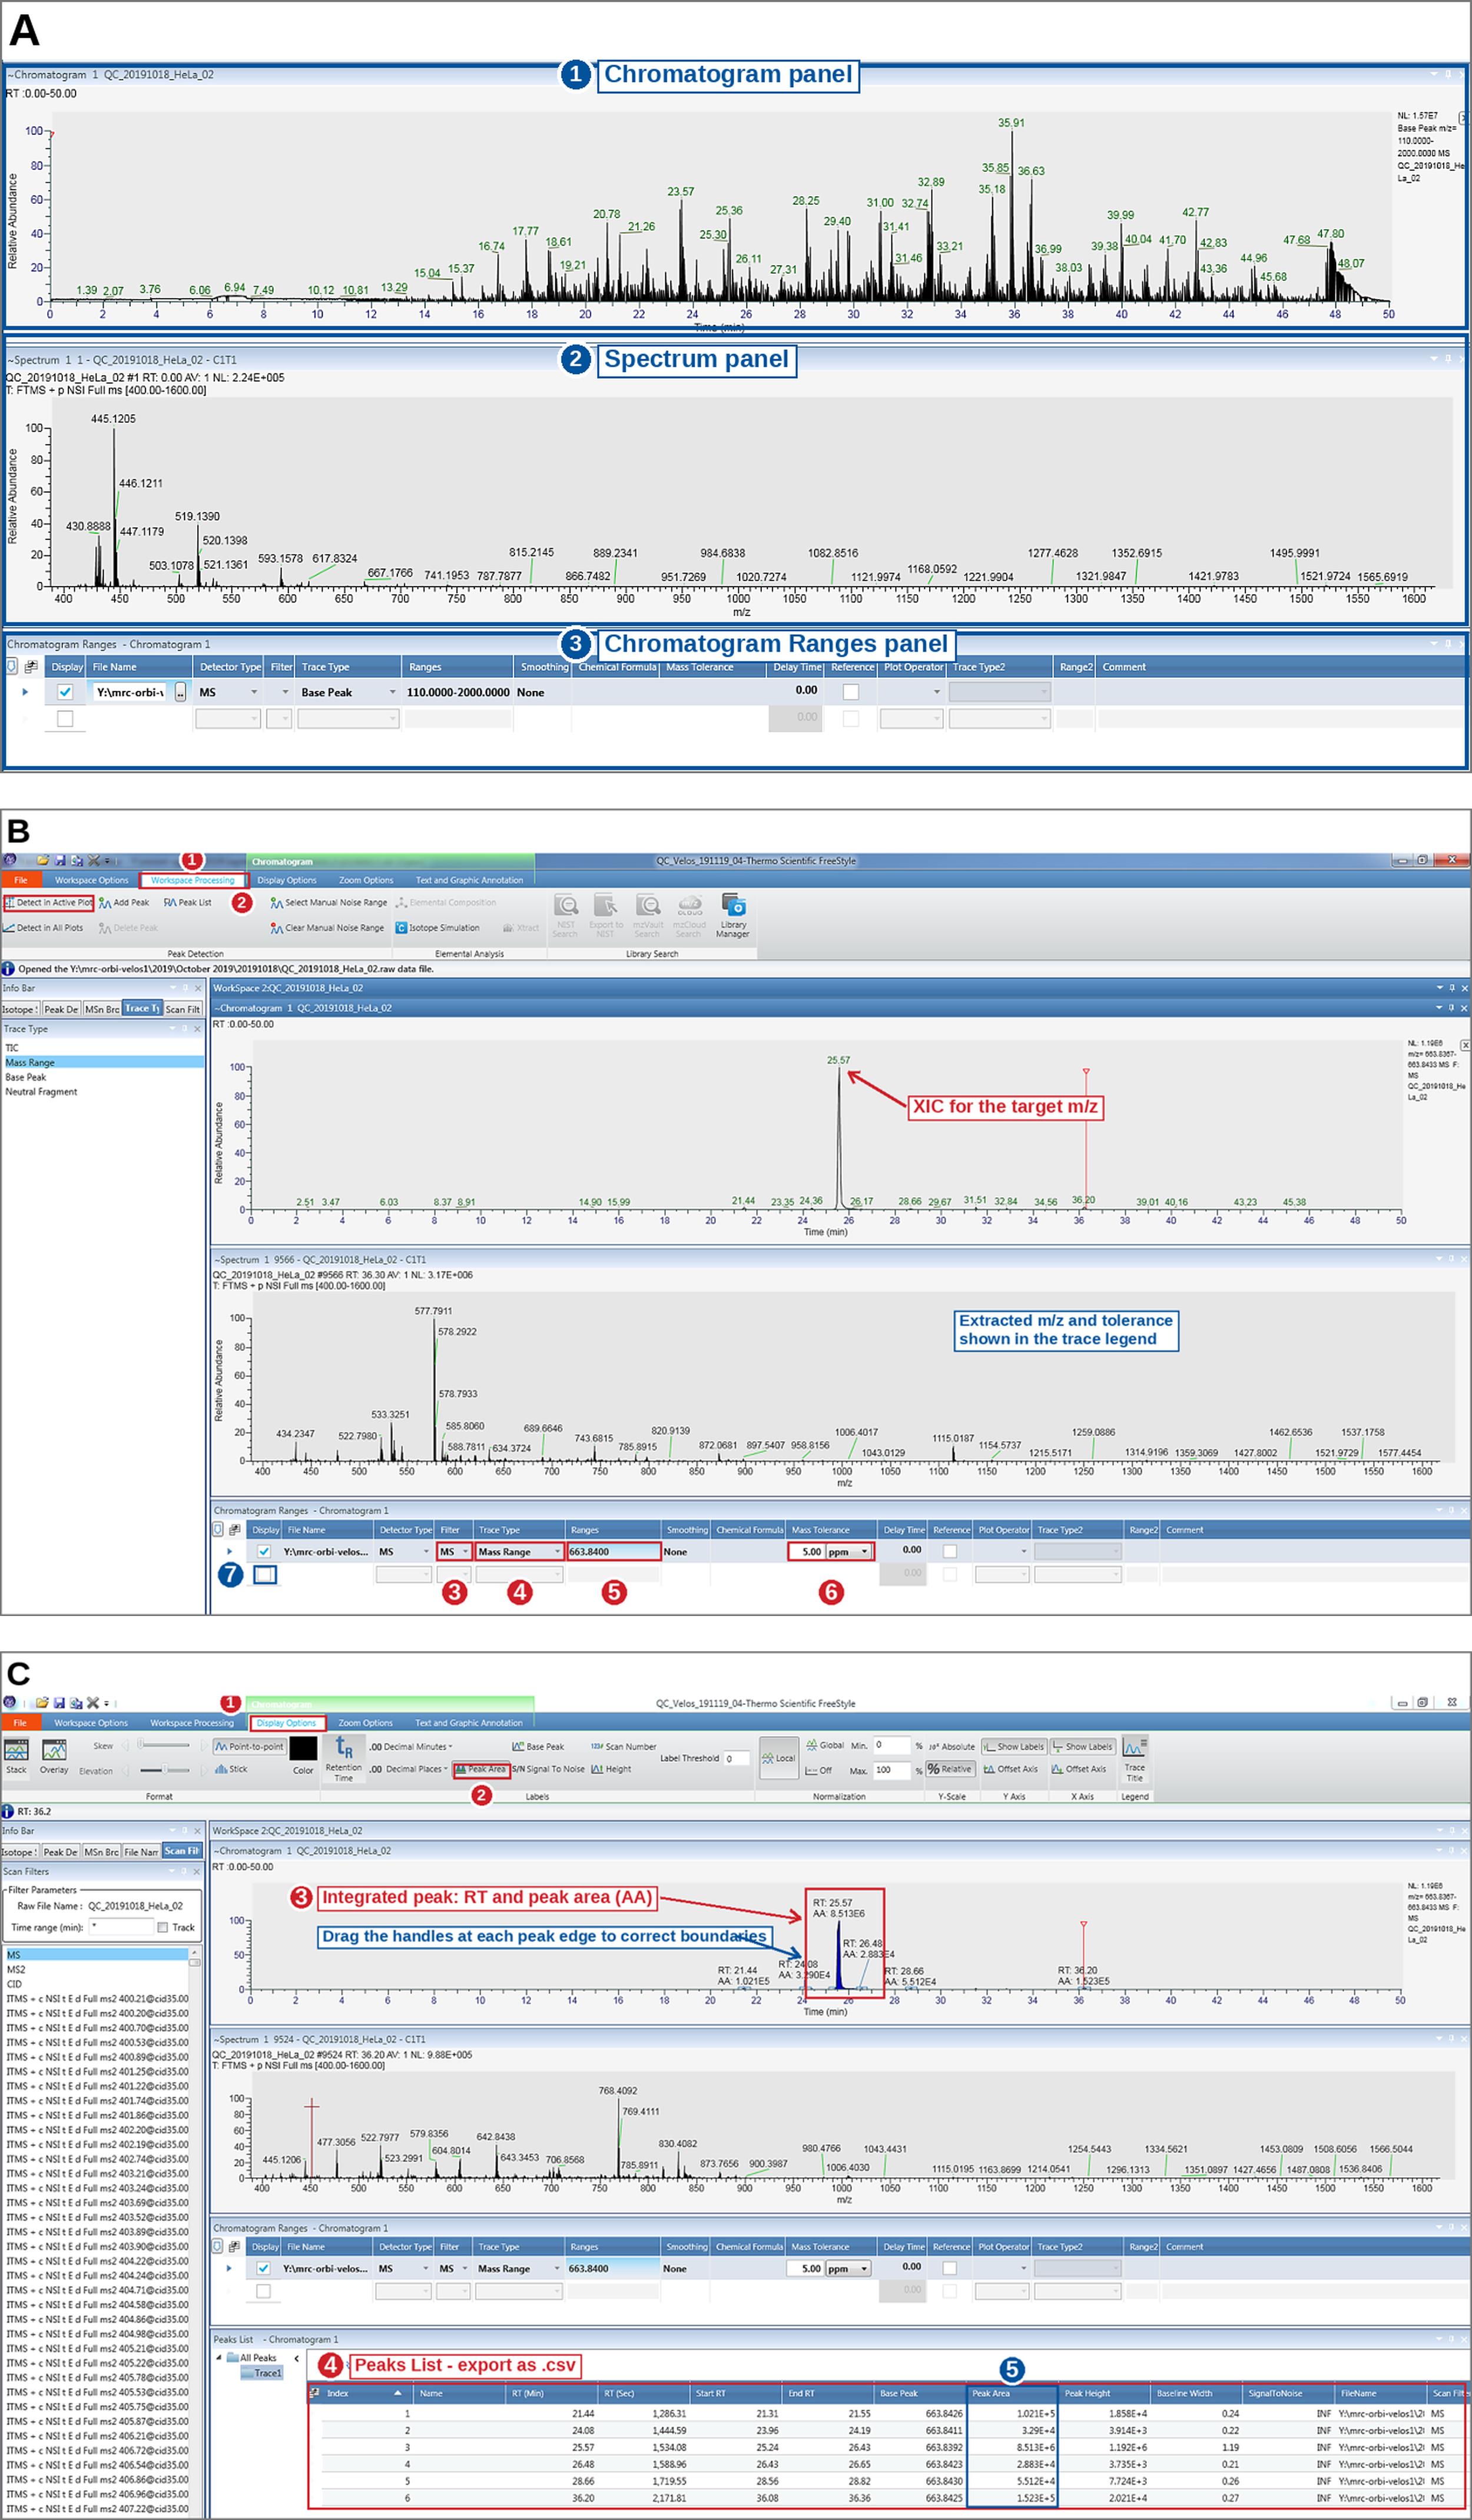
Figure 1. Generating and integrating extracted ion chromatograms in FreeStyle. (A) On opening a .RAW file, FreeStyle displays three panels: the Chromatogram panel (1), showing the base peak chromatogram of the whole run; the Spectrum panel (2), showing the mass spectrum at the selected retention time; and the Chromatogram Ranges panel (3), in which the displayed trace is defined. (B) Extracting a targeted chromatogram. The Workspace Processing tab (1) contains Detect in Active Plot (2), which integrates the peaks of the active chromatogram. In the Chromatogram Ranges panel, the Filter column is set to MS (3), Trace Type to Mass Range (4), and the theoretical precursor m/z of the target phosphopeptide entered in the Ranges column (5) with a mass tolerance of 5 ppm (6). The Chromatogram panel then shows the extracted ion chromatogram for that m/z alone. Ticking the Display checkbox of a second row (7) overlays a second .RAW file, allowing wild-type and kinase-dead samples to be compared on a common axis. (C) Integrating and exporting peak areas. Enabling Peak Area (2) in the Labels group of the Display Options tab (1) annotates each integrated peak with its retention time and area (3). The Peaks List (4) reports retention time, boundaries, area, height, baseline width, and signal-to-noise for every peak, and is exported as .csv via Workspace Options > Exports > Selection As; the Peak Area column (5) provides the values used for quantification. Peak boundaries should be inspected and corrected manually by dragging the handles at each peak edge. Screenshots were acquired in FreeStyle v1.5; the example shown is a QC standard, and the same procedure applies to any target m/z.
Validation of protocol
This protocol (or parts of it) has been used and validated in the following research article:
• Agarwal et al. [1]. NEK1 autophosphorylation is disrupted by amyotrophic lateral sclerosis-associated missense variants: activity biomarkers and structural insights. bioRxiv (2026). https://doi.org/10.64898/2026.06.17.733013
General notes and troubleshooting
General notes
1. LC-MS-grade solvents must be used throughout. Substitution with HPLC-grade reagents can introduce contaminants that suppress ionisation and increase chemical noise.
2. Low-binding microcentrifuge tubes are essential at all stages to minimise adsorptive peptide losses, particularly for low-abundance phosphopeptides.
3. The kinase-dead sample is a critical experimental control and must be processed and acquired in parallel with wild-type samples. It should always be injected first to minimise carryover.
4. The protocol is scalable: gel bands can be excised from as little as one gel lane, provided the kinase of interest is present at sufficient abundance for immunoprecipitation.
Troubleshooting
Problem 1: Poor peptide recovery after extraction.
Possible cause: Incomplete digestion/extraction or peptide loss during handling.
Solution: Cut gel pieces to approximately 1 mm3 to facilitate efficient reagent penetration and enzyme absorption.
Problem 2: High chemical background or poor spectral quality.
Possible cause: Residual Coomassie stain or sample contamination.
Solution: Ensure gel pieces are completely destained before digestion and use LC-MS-grade reagents and clean consumables throughout.
Problem 3: Keratin contamination.
Possible cause: Contamination during gel handling or digestion.
Solution: Wear powder-free gloves, use clean equipment and fresh scalpel blades, keep samples covered, and include the cRAP contaminant database during analysis.
Problem 4: Incomplete digestion.
Possible causes: Gel pieces are too large, or insufficient protease is available for digestion.
Solution: Cut gel pieces to approximately 1 mm3 to facilitate enzyme penetration and ensure that the specified amount of trypsin/Lys-C is added and distributed throughout the gel pieces.
Problem 5: Low sequence coverage of the target protein.
Possible causes: Insufficient target protein, poor peptide recovery, or unfavourable proteolytic coverage.
Solution: Increase or pool starting material and confirm complete peptide extraction. If required, consider digestion with a complementary protease.
Problem 6: Ambiguous phosphosite localisation.
Possible cause: Relying on HCD fragmentation alone for Ser/Thr-rich or multiply phosphorylated peptides.
Solution: Ensure that the EThcD acquisition run has been performed and include EThcD spectra in the ptmRS analysis. EThcD provides complementary c/z ions that substantially improve site assignment confidence.
Problem 7: Low or undetectable phosphopeptide signal.
Possible causes: Low target-protein recovery, substoichiometric phosphorylation, peptide loss during extraction, or poor ionisation of the phosphopeptide.
Solutions: Increase starting material where possible, verify immunoprecipitation efficiency by SDS-PAGE or immunoblotting, minimise sample transfers, and confirm that the corresponding unmodified target-protein peptides are detected.
Problem 8: Unstable electrospray, fluctuating or spiking total ion current.
Possible causes: Partially blocked or damaged emitter, air in the LC flow path, residual detergent or salt in the sample, or an incorrectly positioned source.
Solutions: Inspect the spray under magnification and confirm a stable Taylor cone. Replace the emitter if the tip is chipped or the spray is off-axis. Purge the loading and analytical pumps to remove air. If detergent or salt is suspected, desalt the sample on a C18 tip (see section F, optional step). Confirm the emitter-to-inlet distance and spray voltage against the instrument's standard settings.
Problem 9: Retention-time drift between runs, preventing reliable XIC comparison.
Possible causes: Column ageing, ambient temperature fluctuation, inadequate re-equilibration, or a change in mobile phase.
Solutions: Use a column oven with the temperature held constant. Allow full re-equilibration between injections as specified in Table 1. Prepare mobile phases in sufficient volume for the whole batch. Acquire all samples in a single continuous batch wherever possible. Where residual drift remains, align chromatograms using the retention times of the unmodified reference peptides before comparing peak areas.
Problem 10: No phosphopeptides detected at all.
Possible causes: Substoichiometric phosphorylation, phosphatase activity during lysis or immunoprecipitation, adsorptive loss of the phosphopeptide, or the phosphopeptide falling outside the acquired mass range or being poorly ionised.
Solutions: Confirm that phosphatase inhibitors were present throughout lysis and immunoprecipitation. Verify that the unmodified counterpart peptide is detected—if it is not, the problem is coverage rather than phosphorylation. Use low-binding tubes and minimise transfers. Check that the calculated precursor m/z lies within the m/z 375–1,500 acquisition window at the expected charge state. Where a site is suspected but not detected, consider phosphopeptide enrichment (TiO2 or Fe-IMAC) of the digest.
Problem 11: Poor or ambiguous phosphosite localisation despite good peptide identification.
Possible cause: Adjacent phosphorylatable residues with no distinguishing fragment ion or dominance of neutral-loss ions in the HCD spectrum.
Solution: Ensure the EThcD run has been acquired and is included in the ptmRS analysis; c/z ions are frequently decisive where b/y ions are not. Where two adjacent residues cannot be distinguished spectrally, resolve the assignment genetically by expressing single alanine substitutions of each candidate residue and repeating the XIC analysis, as was done for Ser155 and Thr156 in the associated research article [1].
Acknowledgments
The authors thank Dr Frédéric Lamoliatte for reading and commenting on a draft of this protocol.
A.R.M. is funded principally by the WoodNext Foundation, a component fund administered by Greater Houston Community Foundation, for research into NEK1-ALS, with additional support from the National Institute for Health and Care Research (NIHR) and the Medical Research Council (MRC) via the MND Translational Accelerator Initiative (MR/Z505535/1), and a Royal Society research grant (RGS/R2/252027).
This protocol is associated with our primary research article: Agarwal et al. [1]. The associated mass spectrometry proteomics data have been publicly deposited to the ProteomeXchange Consortium via the PRIDE partner repository with the dataset identifier PXD079815.
Author contributions
Conceptualization, S.A., A.R.M.; Investigation, S.A., R.G., A.R.M.; Writing—Original Draft, S.A., A.R.M.; Writing—Review & Editing, S.A., R.G., R.F.S., A.R.M.; Funding acquisition, A.R.M.; Supervision, A.R.M.
Competing interests
The authors declare no conflicts of interest.
Ethical considerations
This protocol uses established human cell lines (U-2 OS) and does not involve primary human subjects or animal experiments. No specific ethics committee approval is required for the procedures described here.
References
- Agarwal, S., Abdul Rehman, S. A., Muñoz, I. M., Knebel, A., Hop, P. J., Gourlay, R., Brown, F., Macartney, T., Squires, I., Veldink, J. H., et al. (2026). NEK1 autophosphorylation is disrupted by amyotrophic lateral sclerosis-associated missense variants: activity biomarkers and structural insights. bioRxiv: e733013. https://doi.org/10.64898/2026.06.17.733013
- Waddell, A. D., Ojha, H., Agarwal, S., Clarke, C. J., Terriente-Felix, A., Zhou, H., Kakade, P., Knebel, A., Shaw, A. M., Gourlay, R., et al. (2023). Regulation of Human PINK1 ubiquitin kinase by Serine167, Serine228 and Cysteine412 phosphorylation. bioRxiv: e534916. https://doi.org/10.1101/2023.03.31.534916
- Voytik, E., Bludau, I., Willems, S., Hansen, F. M., Brunner, A. D., Strauss, M. T. and Mann, M. (2021). AlphaMap: an open-source Python package for the visual annotation of proteomics data with sequence-specific knowledge. Bioinformatics. 38(3): 849–852. https://doi.org/10.1093/bioinformatics/btab674
文章信息
稿件历史记录
提交日期: Jun 21, 2026
接收日期: Aug 30, 2026
在线发布日期: Sep 16, 2026
出版日期: Oct 5, 2026
版权信息
© 2026 The Author(s); This is an open access article under the CC BY-NC license (https://creativecommons.org/licenses/by-nc/4.0/).
如何引用
Agarwal, S., Gourlay, R., Soares, R. F. and Mehta, A. R. (2026). In-Gel Tryptic Digestion and HCD/EThcD LC-MS/MS for Mapping Autophosphorylation Sites. Bio-protocol 16(19): e5836. DOI: 10.21769/BioProtoc.5836.

 Download Citation in RIS Format
分类
生物化学 > 蛋白质 > 翻译后修饰
您对这篇实验方案有问题吗?
在此处发布您的问题,我们将邀请本文作者来回答。同时,我们会将您的问题发布到Bio-protocol Exchange,以便寻求社区成员的帮助。
 发布问题
发布问题


