


A MATLAB-Based Image Processing Protocol for Quantitative Differentiation of Diseased and Healthy Plant Tissue From Digital Leaf Images
基于 MATLAB 图像处理定量区分数字叶片图像中的病变与健康植物组织



(*Contributed equally to this work, §Technical contact: pankajborahmajuli@gmail.com) 发布: 2026年08月20日第16卷第16期 DOI: 10.21769/BioProtoc.5798 浏览次数: 315
评审: Ying LiAnonymous reviewer(s)
 PDF
PDF  Q&A
Q&A
参见作者原研究论文
The authors used this protocol in:

Mar 2026





Abstract
Accurate quantification of plant disease severity is essential for evaluating host–pathogen interactions and assessing the effectiveness of disease management strategies. Traditional visual scoring methods and manual estimation of infected tissue are widely used but are often subjective and prone to observer bias. Digital image analysis offers an objective alternative by enabling automated identification and quantification of symptomatic plant tissues based on color and spatial characteristics.
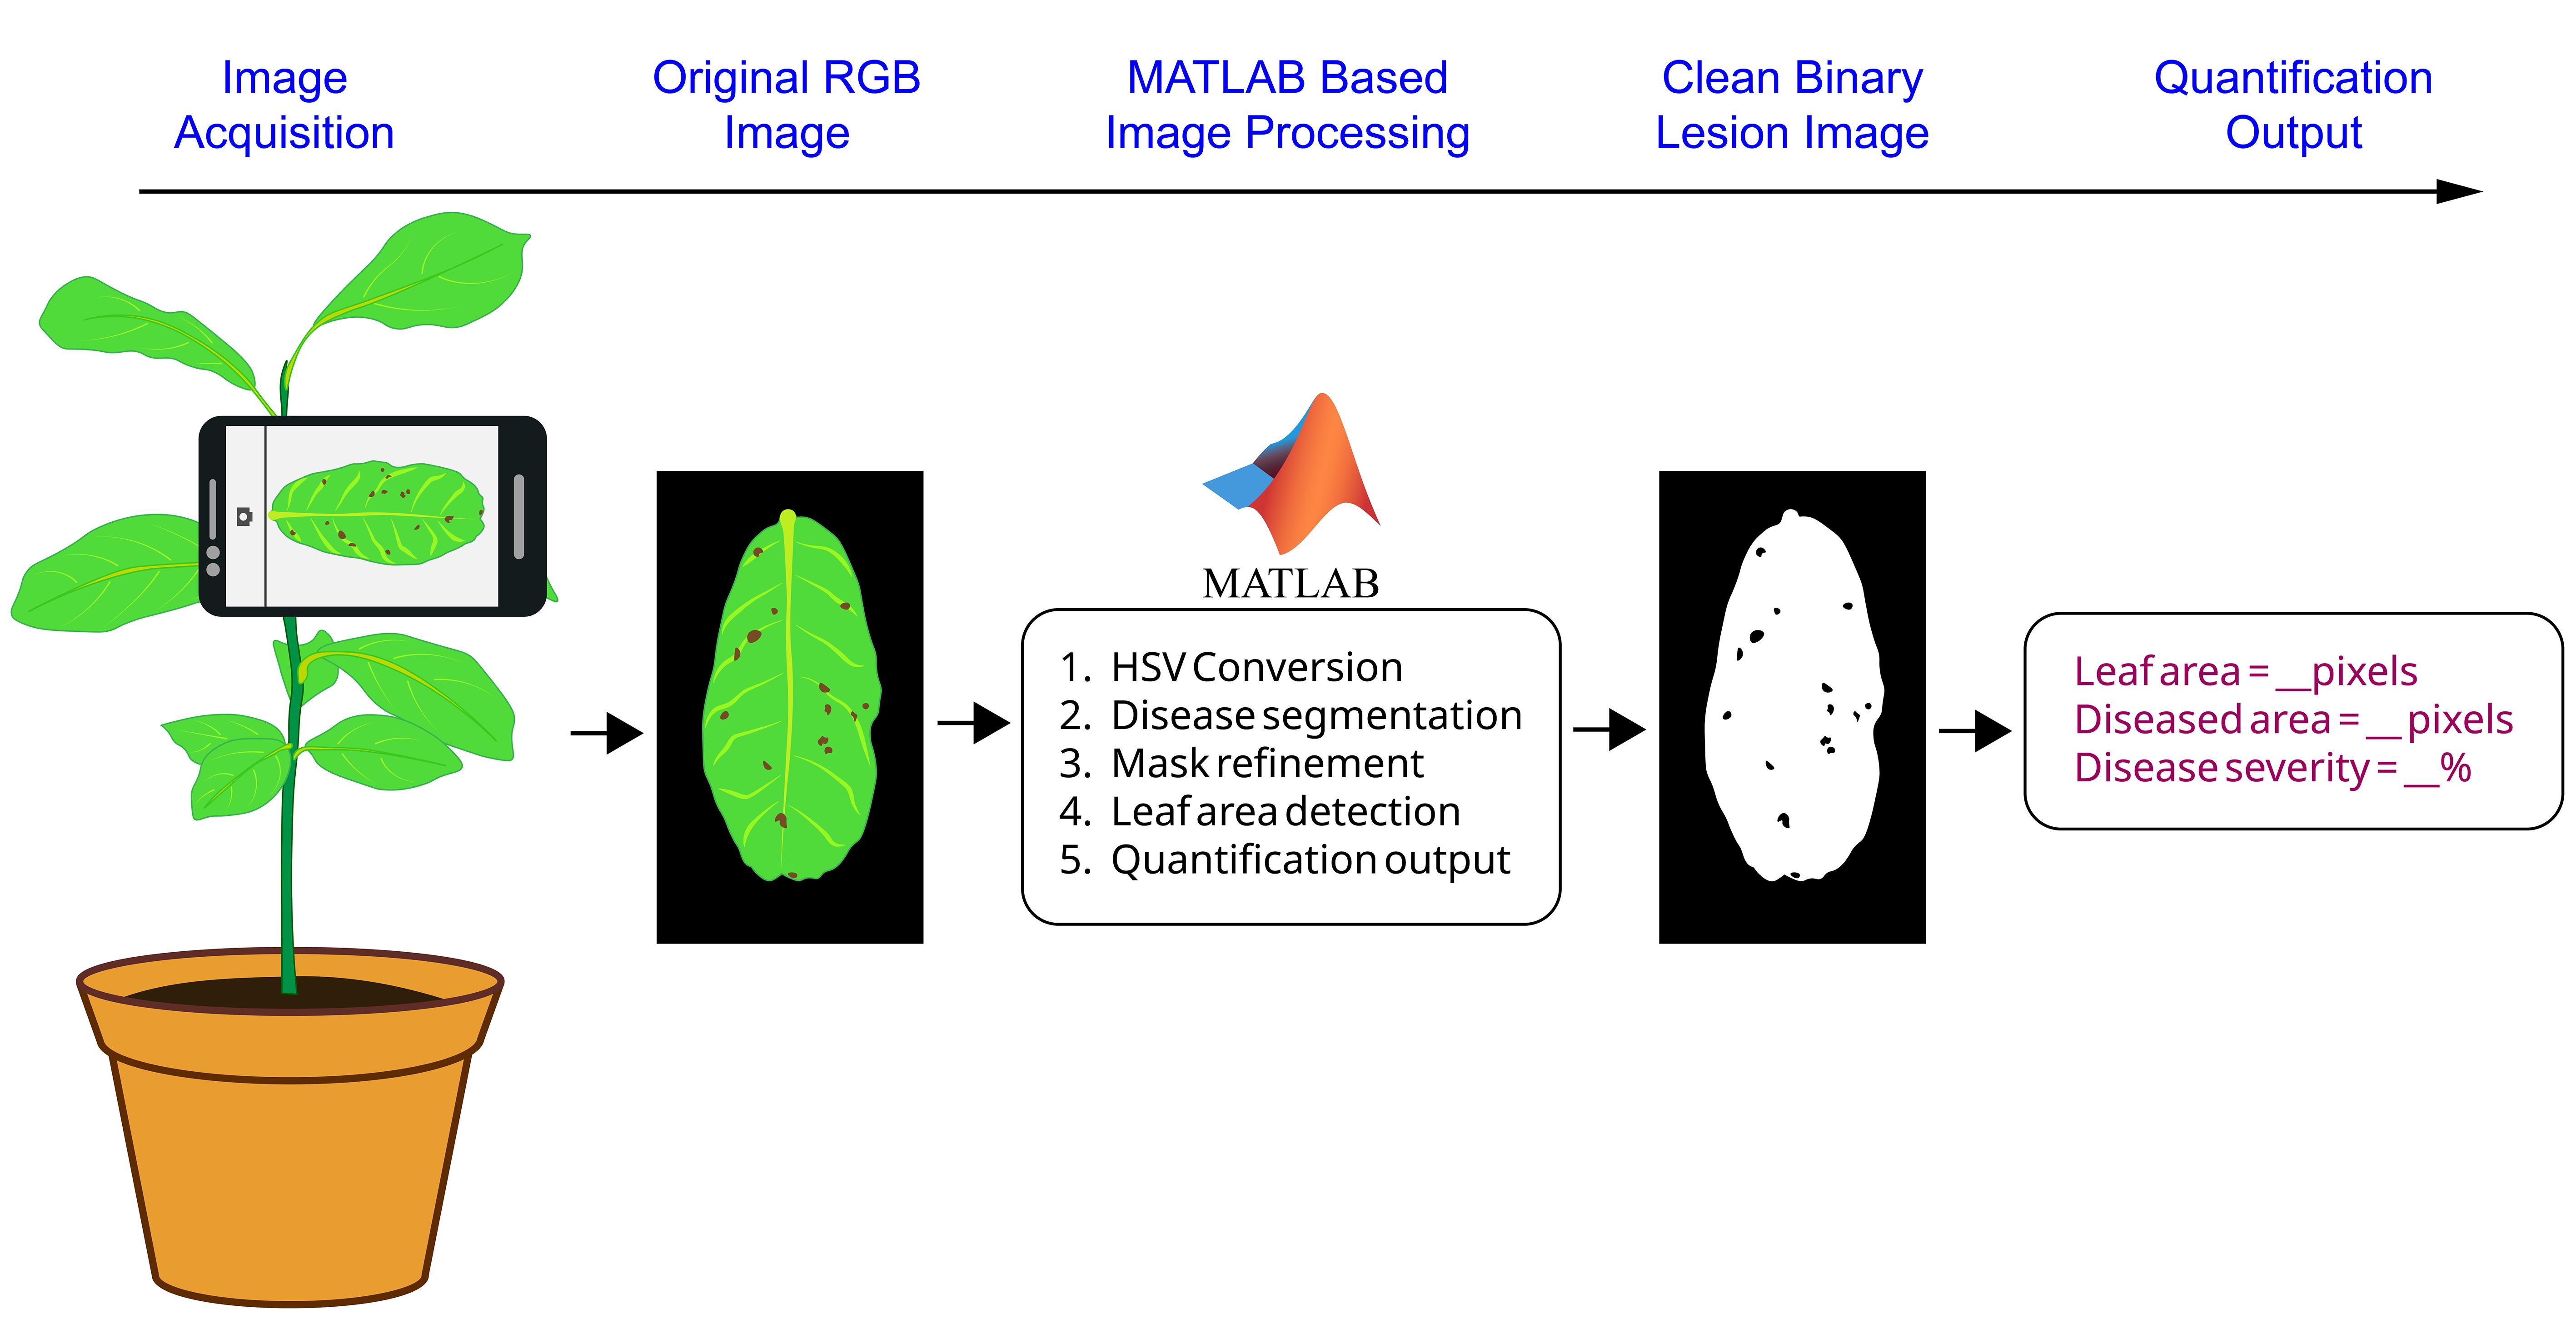
Here, we present a MATLAB-based image processing protocol for differentiating diseased and healthy plant tissue from digital leaf images. The workflow involves acquisition of standardized leaf images, conversion of RGB images into hue-saturation-value (HSV) color space, segmentation of diseased tissue using defined HSV thresholds, refinement of the segmented mask through morphological operations, and extraction of the whole leaf area. The protocol then calculates the diseased area and total leaf area in pixels and computes the percentage of infected tissue. The method uses MATLAB together with the Image Processing Toolbox and can be implemented using simple scripts. This protocol enables rapid and reproducible quantification of disease severity in plant leaves exhibiting visually distinct symptoms such as necrotic lesions or blight patches. By minimizing observer bias and providing quantitative measurements of infected area, the protocol offers a practical and reproducible approach for plant disease phenotyping and evaluation of disease management strategies across diverse plant-pathogen systems where diseased tissues can be clearly distinguished from healthy tissues under reasonably controlled imaging conditions.
Key features
• A reproducible MATLAB-based workflow for separating diseased and healthy plant tissue using color-space segmentation.
• Applicable to plant diseases where symptomatic tissue contrasts clearly with healthy tissue (necrosis, blight lesions, rot patches).
• Requires digital leaf images, MATLAB, and the MATLAB Image Processing Toolbox for image processing and disease quantification.
• Enables rapid calculation of diseased leaf area and disease severity using automated pixel-based quantification.
Keywords: Plant disease phenotyping (植物病害表型分析) Image-based disease quantification (基于图像的病害定量)
MATLAB image processing (MATLAB 图像处理)
Leaf lesion segmentation (叶片病斑分割)
Disease severity analysis (病害严重程度分析)
Digital plant pathology (数字植物病理学)
Image-based disease quantification (基于图像的病害定量)
MATLAB image processing (MATLAB 图像处理)
Leaf lesion segmentation (叶片病斑分割)
Disease severity analysis (病害严重程度分析)
Digital plant pathology (数字植物病理学)
Graphical overview
Background
Accurate quantification of plant disease severity is fundamental for studying plant–pathogen interactions, evaluating disease management strategies, and screening host resistance. Traditionally, disease severity has been assessed using visual rating scales or by estimating the percentage of symptomatic tissue on plant organs. Although such approaches are widely used in plant pathology, they are inherently subjective and may introduce observer bias and variability among evaluators [1,2]. These limitations can reduce reproducibility and may affect the statistical interpretation of disease assessment in experimental studies.
To overcome these constraints, digital image analysis has increasingly been adopted as a more objective and reproducible approach for plant disease phenotyping. Image-based disease assessment enables automated detection and quantification of symptomatic regions by analyzing color, texture, and spatial characteristics of infected tissues. Several studies have demonstrated that image analysis methods can significantly improve accuracy and consistency in disease measurement compared to visual estimates [3,4]. Such approaches are particularly effective for diseases that produce visible symptoms such as necrotic lesions, blights, spots, or rotting tissues that contrast clearly with healthy plant tissue.
Among the different approaches used in image-based disease detection, color-space segmentation has proven to be particularly effective for separating symptomatic and healthy regions in plant images. The hue-saturation-value (HSV) color space is commonly used in plant image analysis because it separates chromatic information from intensity, making it more robust to variations in illumination compared to the traditional RGB color model [5]. HSV-based segmentation has been successfully applied in several plant phenotyping studies, including leaf segmentation, stress detection, and disease symptom quantification.
Image analysis pipelines often combine color segmentation with morphological operations to improve the accuracy of tissue classification. Morphological image processing techniques such as opening, closing, and hole filling are widely used to remove noise, refine segmented regions, and generate continuous masks representing diseased areas [6]. When combined with pixel-based area calculation, these techniques allow precise measurement of diseased tissue relative to total leaf area, enabling quantitative estimation of disease severity.
Various image analysis platforms, such as ImageJ, specialized plant phenotyping software, and machine learning–based tools have been developed for plant disease quantification [4,7]. However, many of these systems require specialized plugins, large training datasets, or complex workflows that may limit their accessibility for routine experimental use. In contrast, simple threshold-based segmentation approaches implemented in scripting environments such as MATLAB provide a flexible and reproducible alternative for disease quantification when symptoms exhibit clear visual contrast with healthy tissue and images are acquired under reasonably controlled conditions. The present protocol does not introduce a new image-processing algorithm; rather, it provides a detailed, step-by-step implementation of an established HSV threshold-based workflow that can be readily adopted, reproduced, and adapted by researchers for routine disease quantification.
The protocol described here provides a MATLAB-based workflow for quantitative differentiation of diseased and healthy plant tissue from digital leaf images using HSV color segmentation combined with morphological image processing. The method involves the acquisition of standardized leaf images, the conversion of RGB images to HSV color space, the segmentation of diseased regions based on defined threshold ranges, the refinement of the segmented mask using morphological operations, and pixel-based quantification of diseased and total leaf area. The protocol requires MATLAB together with the Image Processing Toolbox and does not depend on machine learning models or external image-analysis software.
Although the method was developed using citrus canker symptoms, the workflow may be adapted to other plant diseases that produce visually distinguishable symptoms, such as necrotic lesions, blights, leaf spots, anthracnose, or other forms of conspicuous tissue discoloration. Because segmentation relies on fixed HSV threshold values, users may need to recalibrate the threshold ranges and associated image-processing parameters when applying the protocol to different plant species, disease symptoms, imaging systems, or illumination conditions. Accordingly, this protocol is intended primarily as a practical, reproducible workflow for disease quantification under reasonably controlled imaging conditions rather than as a universally applicable segmentation method.
Materials and reagents
Biological materials
Plant leaves showing visually distinguishable disease symptoms, photographed in situ while attached to the plant (Citrus limon, cultivar Kaji Nemu) (plants maintained at the Experimental Farm, Department of Horticulture, Assam Agricultural University, Jorhat, Assam, India; plants used in greenhouse experiments for citrus canker caused by Xanthomonas citri pv. citri).
Laboratory supplies
1. Field notebook for labeling and tracking photographed samples
2. Plant labels or sample identification tags
3. Measuring scale
Equipment
1. Smartphone camera capable of capturing high-resolution RGB images (Apple Inc., model: iPhone 16)
2. Computer or laptop capable of running MATLAB. Recommended minimum specifications: processor, Intel i3 or equivalent; RAM ≥ 4 GB; operating system, Windows/Linux/macOS
3. Tripod stabilizer for the smartphone camera (optional but recommended for consistent image capture) (IMS Mercantiles Pvt. Ltd., catalog number: DTR 550 LW)
Software and datasets
1. MATLAB R2014b (MathWorks, Natick, MA, USA)
2. MATLAB Image Processing Toolbox (required for execution of the workflow)
3. MATLAB script for segmentation of diseased and healthy leaf tissue and pixel-based area calculation (included in this protocol)
4. Digital images in JPEG (.jpg, .jpeg) or PNG (.png) format acquired under reasonably uniform illumination and against a contrasting background
5. GitHub repository containing the MATLAB source code, README file with installation and execution instructions, and representative example image(s): https://github.com/pankajborahmajuli-source/Leaf-Disease-Detection-MATLAB-Code/blob/main/README.md
6. Representative leaf images used for validation of the protocol are available in the associated research article [8] where the method was applied
7. (Optional) GNU Octave (with the Image package installed) may also be used after minor syntax modifications, including replacement of MATLAB-specific functions where necessary
Software compatibility
This workflow was developed and tested using MATLAB R2014b together with the Image Processing Toolbox. The function im2bw is retained to ensure compatibility with MATLAB R2014b. In newer MATLAB releases, imbinarize may be used as the recommended alternative with only minor syntax modifications. The workflow may also be adapted for GNU Octave after installation of the Image package and minor adjustments to MATLAB-specific syntax.
Procedure
登录/注册后免费查看全文
文章信息
稿件历史记录
提交日期: May 18, 2026
接收日期: Jul 22, 2026
在线发布日期: Aug 5, 2026
出版日期: Aug 20, 2026
版权信息
© 2026 The Author(s); This is an open access article under the CC BY-NC license (https://creativecommons.org/licenses/by-nc/4.0/).
如何引用
Dowarah, B., Borah, P., Laskar, R. A., Yasin, A., Kashyap, A. and Neog, B. (2026). A MATLAB-Based Image Processing Protocol for Quantitative Differentiation of Diseased and Healthy Plant Tissue From Digital Leaf Images. Bio-protocol 16(16): e5798. DOI: 10.21769/BioProtoc.5798.

 Download Citation in RIS Format
分类
植物科学 > 植物免疫 > 病害症状
植物科学 > 植物生理学 > 表型分析
生物信息学与计算生物学
您对这篇实验方案有问题吗?
在此处发布您的问题,我们将邀请本文作者来回答。同时,我们会将您的问题发布到Bio-protocol Exchange,以便寻求社区成员的帮助。
 发布问题
发布问题


