


Automated FLIM-FRET Segmentation Within RNP Condensates
RNP凝聚体内FLIM-FRET信号的自动分割

(*contributed equally to this work) 发布: 2026年08月05日第16卷第15期 DOI: 10.21769/BioProtoc.5775 浏览次数: 372
评审: Maya V RaoAleksandra J. WierzbaAnonymous reviewer(s)
 PDF
PDF  Q&A
Q&A
参见作者原研究论文
The authors used this protocol in:

Oct 2024
Advertisement






Abstract
Ribonucleoprotein (RNP) condensates are membraneless organelles that exist alongside many RNA-driven processes, such as transcription and splicing. Despite their ubiquity, the biological necessity of forming a condensed phase remains unclear, particularly because the same RNP components exist both within these organelles and in the surrounding dilute phase. Most current methods for studying biochemical interaction dynamics within condensates rely on in vitro reconstitution of minimal factors or low-throughput single-molecule studies. However, RNP condensates are complex organelles containing tens to hundreds of proteins and hundreds to thousands of different RNAs. Here, we describe a scalable, high-throughput fluorescence microscopy–based approach to analyze protein–protein interaction networks, allowing for the rigorous assessment of dynamic, process-critical interactions within RNP condensates from live cells. This method takes advantage of fluorescence lifetime imaging (FLIM) and phasor plot analysis to automate segmentation of condensate-localized fluorescence signals. Using suitable FLIM–Förster resonant energy transfer (FLIM-FRET) fluorescent pairs fused to proteins of interest, protein–protein interactions can be actively monitored throughout various conditions via changes in fluorescence lifetime. Results from this assay yield valuable insight into the organization and assembly of essential factors for different condensate-associated processes to infer the functional consequences of RNP granule partitioning. Although this protocol is tailored for studying protein interactions within condensates, the design and execution framework can be adapted to investigate protein–protein interactions across a wide variety of compartments within different biological systems.
Key features
• Automated segmentation of condensate-localized fluorescent signal independent of thresholding or background subtraction.
• FLIM-FRET to analyze protein–protein interactions, with an emphasis on condensate interaction networks.
• Monitor protein interactions from live cells over time and in response to different stimuli.
Keywords: Fluorescence lifetime imaging microscopy (荧光寿命成像显微术) Förster resonance energy transfer (福斯特共振能量转移)
Segmentation (分割)
Condensates (凝聚体)
Phasor analysis (相量分析)
Förster resonance energy transfer (福斯特共振能量转移)
Segmentation (分割)
Condensates (凝聚体)
Phasor analysis (相量分析)
Graphical overview
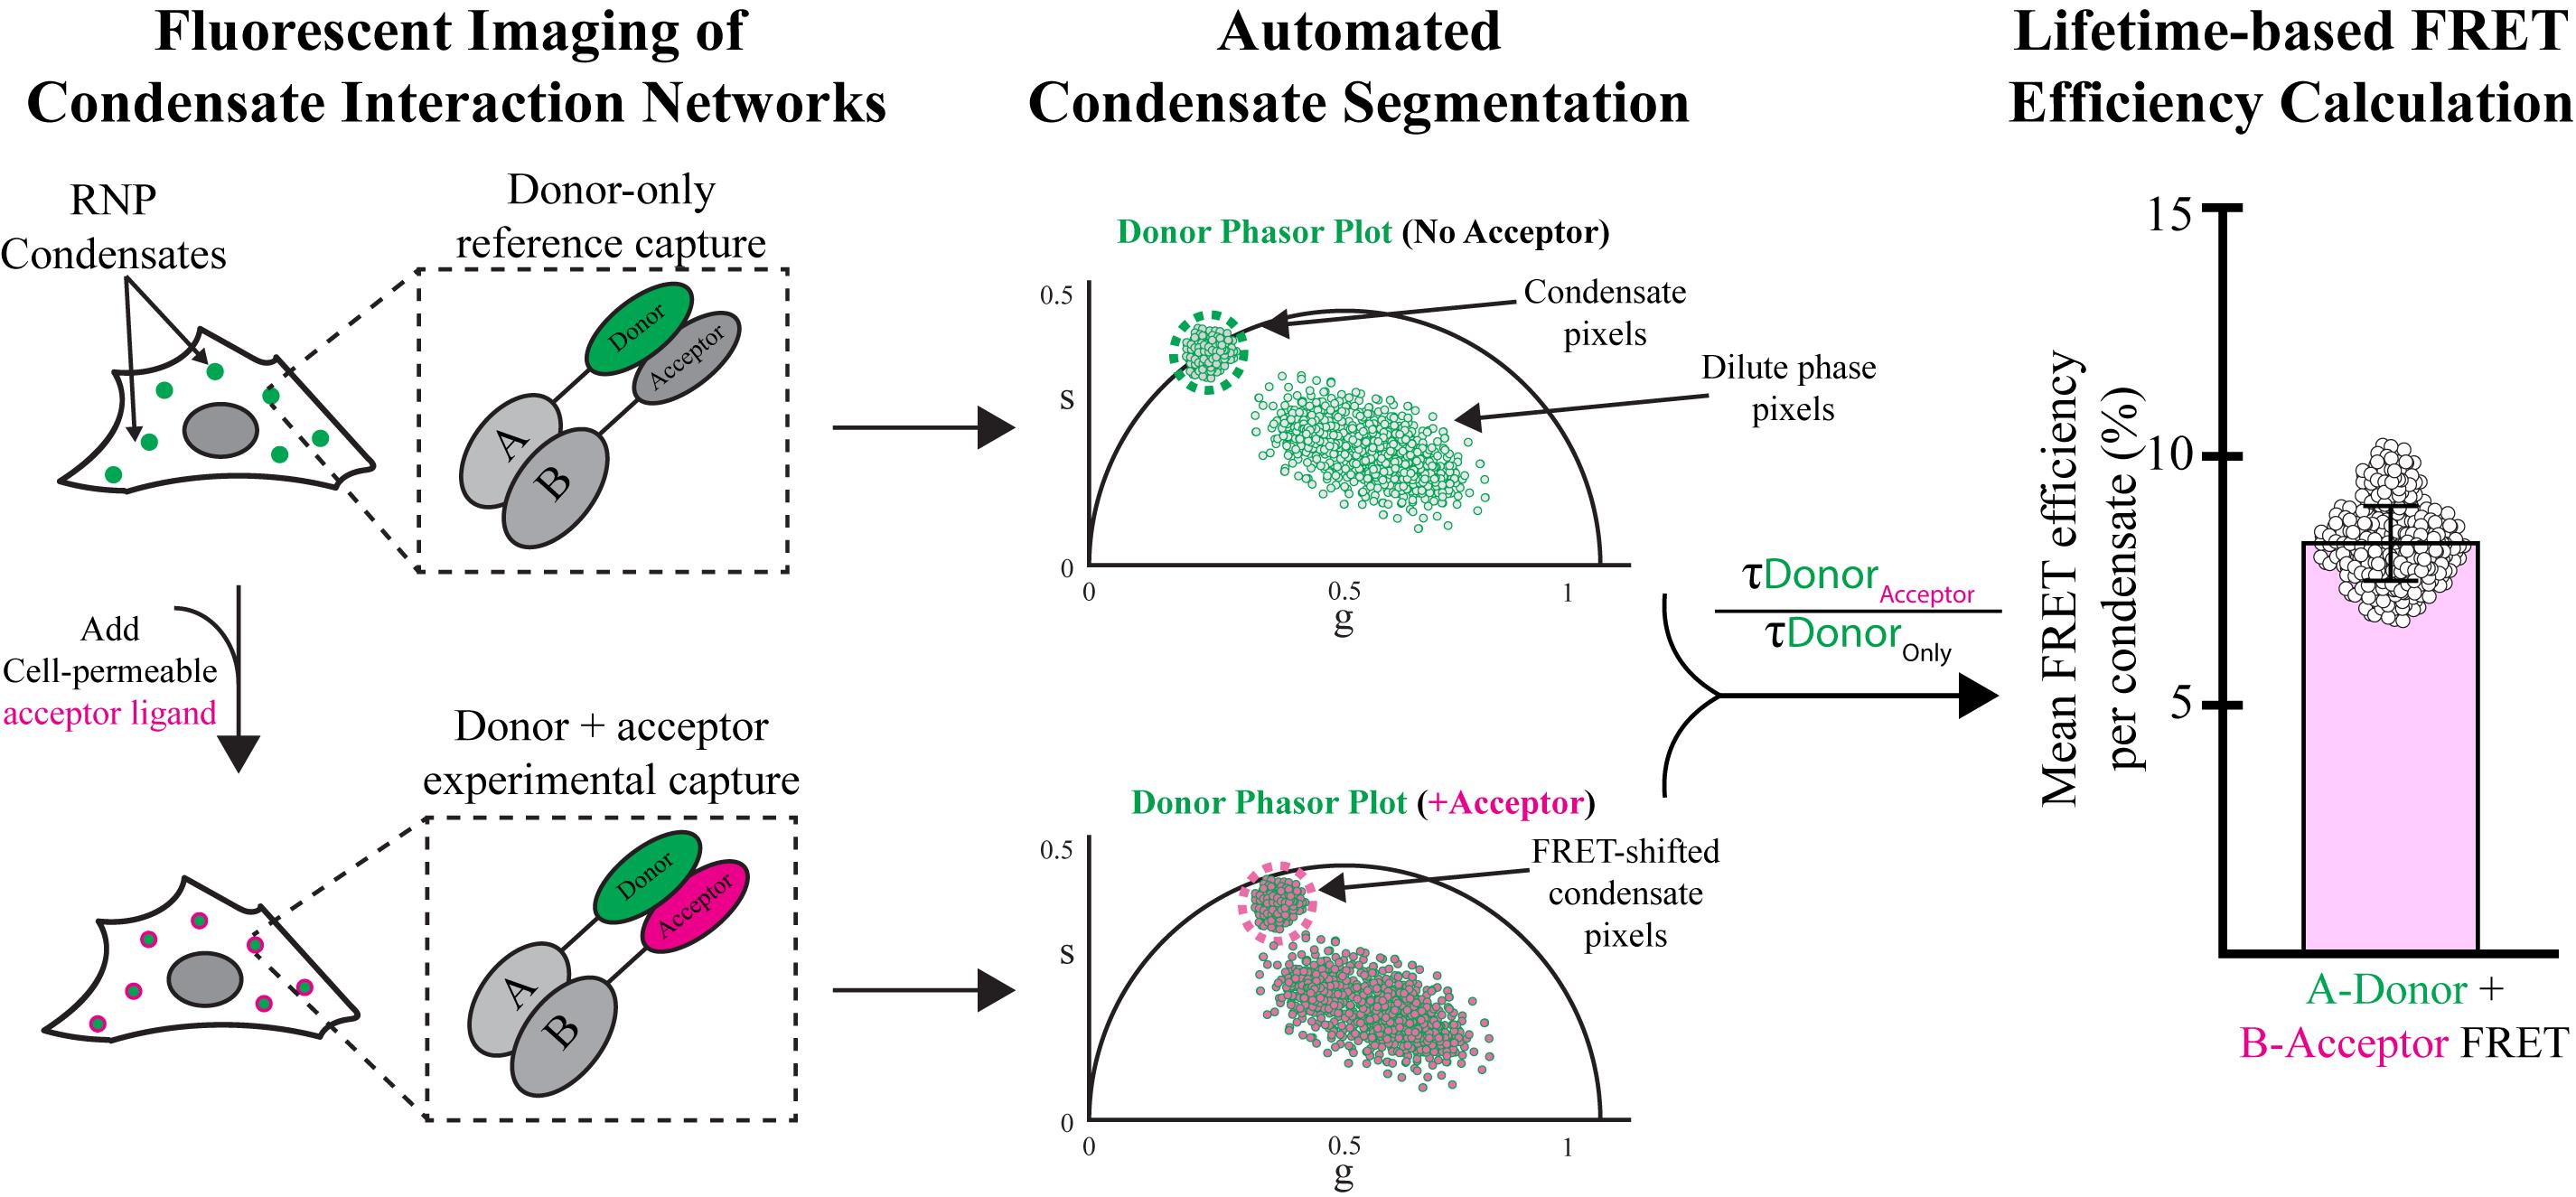
Graphical overview of fluorescence lifetime imaging–Förster resonant energy transfer (FLIM-FRET) capture, segmentation, and analysis
Background
Uncovering protein–protein interaction networks can yield valuable mechanistic insight into the function of various biological systems. However, many biochemical approaches, such as co-immunoprecipitation, lose critical spatial information that is necessary for interpreting function. This is important since many proteins specifically localize to multiple places to perform distinct functions (Figures 1C and 2). For instance, certain cytosolic proteins can be recruited to membrane-bound organelles in a context-dependent manner, such as Lsg1 interacting with VAPB at the endoplasmic reticulum membrane during oxidative stress (Figure 2A). Additionally, proteins found in ribonucleoprotein (RNP) condensates display dual localization that is technically challenging to disentangle.
RNP condensates are membraneless organelles that arise through phase separation and are classified by the specific RNA and protein species they contain [1,2]. Constituent components of these organelles are partitioned into condensed (inside the condensate) and dilute (outside the condensate) phases that rapidly exchange with one another. This unique biophysical phenomenon can allow for emergent biology [3]; however, the exact function of many condensates remains unclear. Due to the dynamic component exchange, identifying fluorescence microscopy foci as phase-separated compartments and disentangling processes that occur within the condensed phase vs. the dilute phase remain challenging. Current approaches include descriptive microscopy (size, number, shape, etc.), isolation of granules followed by sequencing [4–6], condensate reconstitution using purified components [7,8], or proximity-labeling approaches [9]. Although informative, these approaches either fundamentally alter the physical/compositional properties of the organelle or only provide descriptive information rather than mechanistic insight. To overcome these challenges, we developed a fluorescence lifetime imaging (FLIM)-based assay that allows for the automated segmentation of condensate-specific molecules to assess their functional organization in live cells using Förster resonance energy transfer (FRET) (Figures 1 and 2). Furthermore, this approach is broadly applicable to any number of biological systems to spatiotemporally interrogate protein–protein interaction networks, independent of localization (Figure 2A).
FRET is a light microscopy technique that measures protein–protein interaction networks based on energy transfer between two fluorescently tagged proteins of interest—one fused to a donor fluorophore and the other to an acceptor fluorophore. In this system, the emission spectrum of a donor fluorophore overlaps with the excitation spectrum of an acceptor fluorophore. When the two molecules interact, their fused fluorophores become close enough in proximity that energy from the excitation of the donor can transfer to the acceptor [10]. The efficiency of energy transfer is then a function of the brightness of the donor fluorophore, the degree of spectral overlap between the donor and acceptor, and the distance between donor and acceptor [10].
In classical FRET, this interaction can be quantified by measuring the loss of donor signal in the presence of an acceptor, by detecting acceptor emission directly, or by observing an increase in donor fluorescence upon photobleaching the acceptor. However, many factors can confound intensity-based measurements, including photobleaching and spectral bleed-through. Multiple methods of quantification are often necessary to confidently identify FRET, including acceptor photobleaching, which is destructive and prevents repeated measurements from the same sample over time [11]. As a result, intensity-based FRET is limited by the need for instrumentation capable of spectrally separating donor and acceptor signals, the use of photostable and high quantum yield fluorophores, and sufficiently high concentrations of both labeled species for FRET efficiency calculations [11].
To overcome many of these challenges, fluorescence lifetime imaging microscopy (FLIM) can be implemented in combination with FRET (FLIM-FRET). FLIM is a technique that measures both the fluorescence intensity and lifetime of a particular fluorescent molecule. Upon protein–protein interaction, energy transfer to the acceptor fluorophore decreases the donor fluorescence lifetime [12]. This means FLIM-FRET only needs to measure the donor lifetime and is independent of fluorophore concentration. Furthermore, FLIM-FRET avoids the need to photobleach the acceptor fluorophore and negates acceptor cross-excitation. Conjugated fluorescent tags, such as those used with Halo-tag or SNAP-tag ligands, are particularly well-suited as FRET acceptors in this system, since they allow a single cell line to serve as both a donor-only control and a donor-plus-acceptor experimental condition. Lastly, because this approach is non-destructive, multiple measurements can be acquired from the same sample over time, enabling detection of dynamic changes in protein–protein interaction.
Not only does FLIM improve FRET measurements, but we have also leveraged this imaging technique to automatically segment condensate-specific FRET signals. Standard intensity-based condensate segmentation relies on manual curation of various thresholding algorithms to distinguish condensed pixels from non-condensed pixels. These approaches assume that the bright foci of a fluorescently tagged condensate protein are the only bona fide condensates present. This results in under-counting the true number of granules or falsely identifying other structures (like lysosomes) as condensates. Fluorescence lifetime is sensitive to aspects of the microenvironment, such as pH [13], ion density [14], and, as we recently discovered, residency within condensates [15]. The reason for this condensate-specific lifetime shift is currently unclear but has been reported by others [16,17]. We hypothesize that the dense condensate environment might alter lifetimes by suppressing the non-radiative decay of certain fluorophores. This may occur through viscosity-dependent inhibition of chromophore isomerization and/or local water depletion within the condensate [18–21]. Regardless, by exploiting the subtle changes in lifetime, we developed a segmentation method to isolate fluorescence lifetime signals specifically within condensates.
Automating the segmentation of microscopy images using fluorescence intensity has been historically challenging, especially with factors that reside in multiple locations within the cell. This is particularly a problem for condensates whose dilute phase signals complicate automated thresholding of condensate pixels from dilute phase pixels during standard intensity-based segmentation. FLIM imaging provides a complementary approach that can organize pixels by fluorescence lifetime on phasor plots. FLIM phasor plots are generated by applying a Fourier transformation to the fluorescence decay curves of each pixel from time-correlated single-photon counting data (TCSPC) [22] (Figure 1D). Each pixel from the original image is represented as a single point on the phasor plot such that pixels with similar lifetime compositions cluster together (Figure 1D). Pixels with a single, uniform local environment yield mono-exponential decay signatures that cluster on the universal circle, whereas pixels with two or more distinct lifetime species (mixed microenvironments, multiple fluorophores, autofluorescence, or shot noise) yield multi-exponential decay curves and cluster inside the universal circle. Importantly, fluorescence lifetime clusters on FLIM phasor plots are amenable to a variety of automated segmentation and signal processing approaches [23,24].
To segment RNP condensates, we used FLIM phasor plots to exploit lifetime and intensity differences between condensed and dilute phases. Condensate localized pixels cluster on the universal circle because they are dominated by the fluorophore’s mono-exponential decay. Dilute phase pixels contain a mixture of lifetimes representing fluorophore, autofluorescence, and shot noise, which is proportional to the square root of the photon counts, resulting in multi-exponential decay. To resolve overlapping condensed and dilute phase lifetime clusters, we implemented a complex wavelet filter [15,24]. Following wavelet filtering, the enriched condensate lifetime cluster can be statistically isolated using a Gaussian mixture model (GMM) with a region of interest (ROI) defined by the probability distribution density of the GMM-identified lifetime cluster. A reverse Fourier transform is then applied pixel-to-pixel to map the segmented phasor coordinates back into the spatial domain, yielding accurate masks of RNP condensates.
This phasor-based segmentation can then be combined with FLIM-FRET to gain previously unattainable insight into condensate organization and function. For demonstration, we show how FLIM-FRET can be used to measure the interaction between the P-body-localized mRNA decapping proteins Dcp2 and Dcp1A/Dcp1B. Furthermore, we show how mNeonGreen and Halo-Tag conjugates can be used in this system to measure condensate protein–protein interactions within a single cell line. However, this FLIM-FRET method can also be applied to a variety of other protein factors (regardless of localization) using any FRET-capable pair of fluorescent molecules.
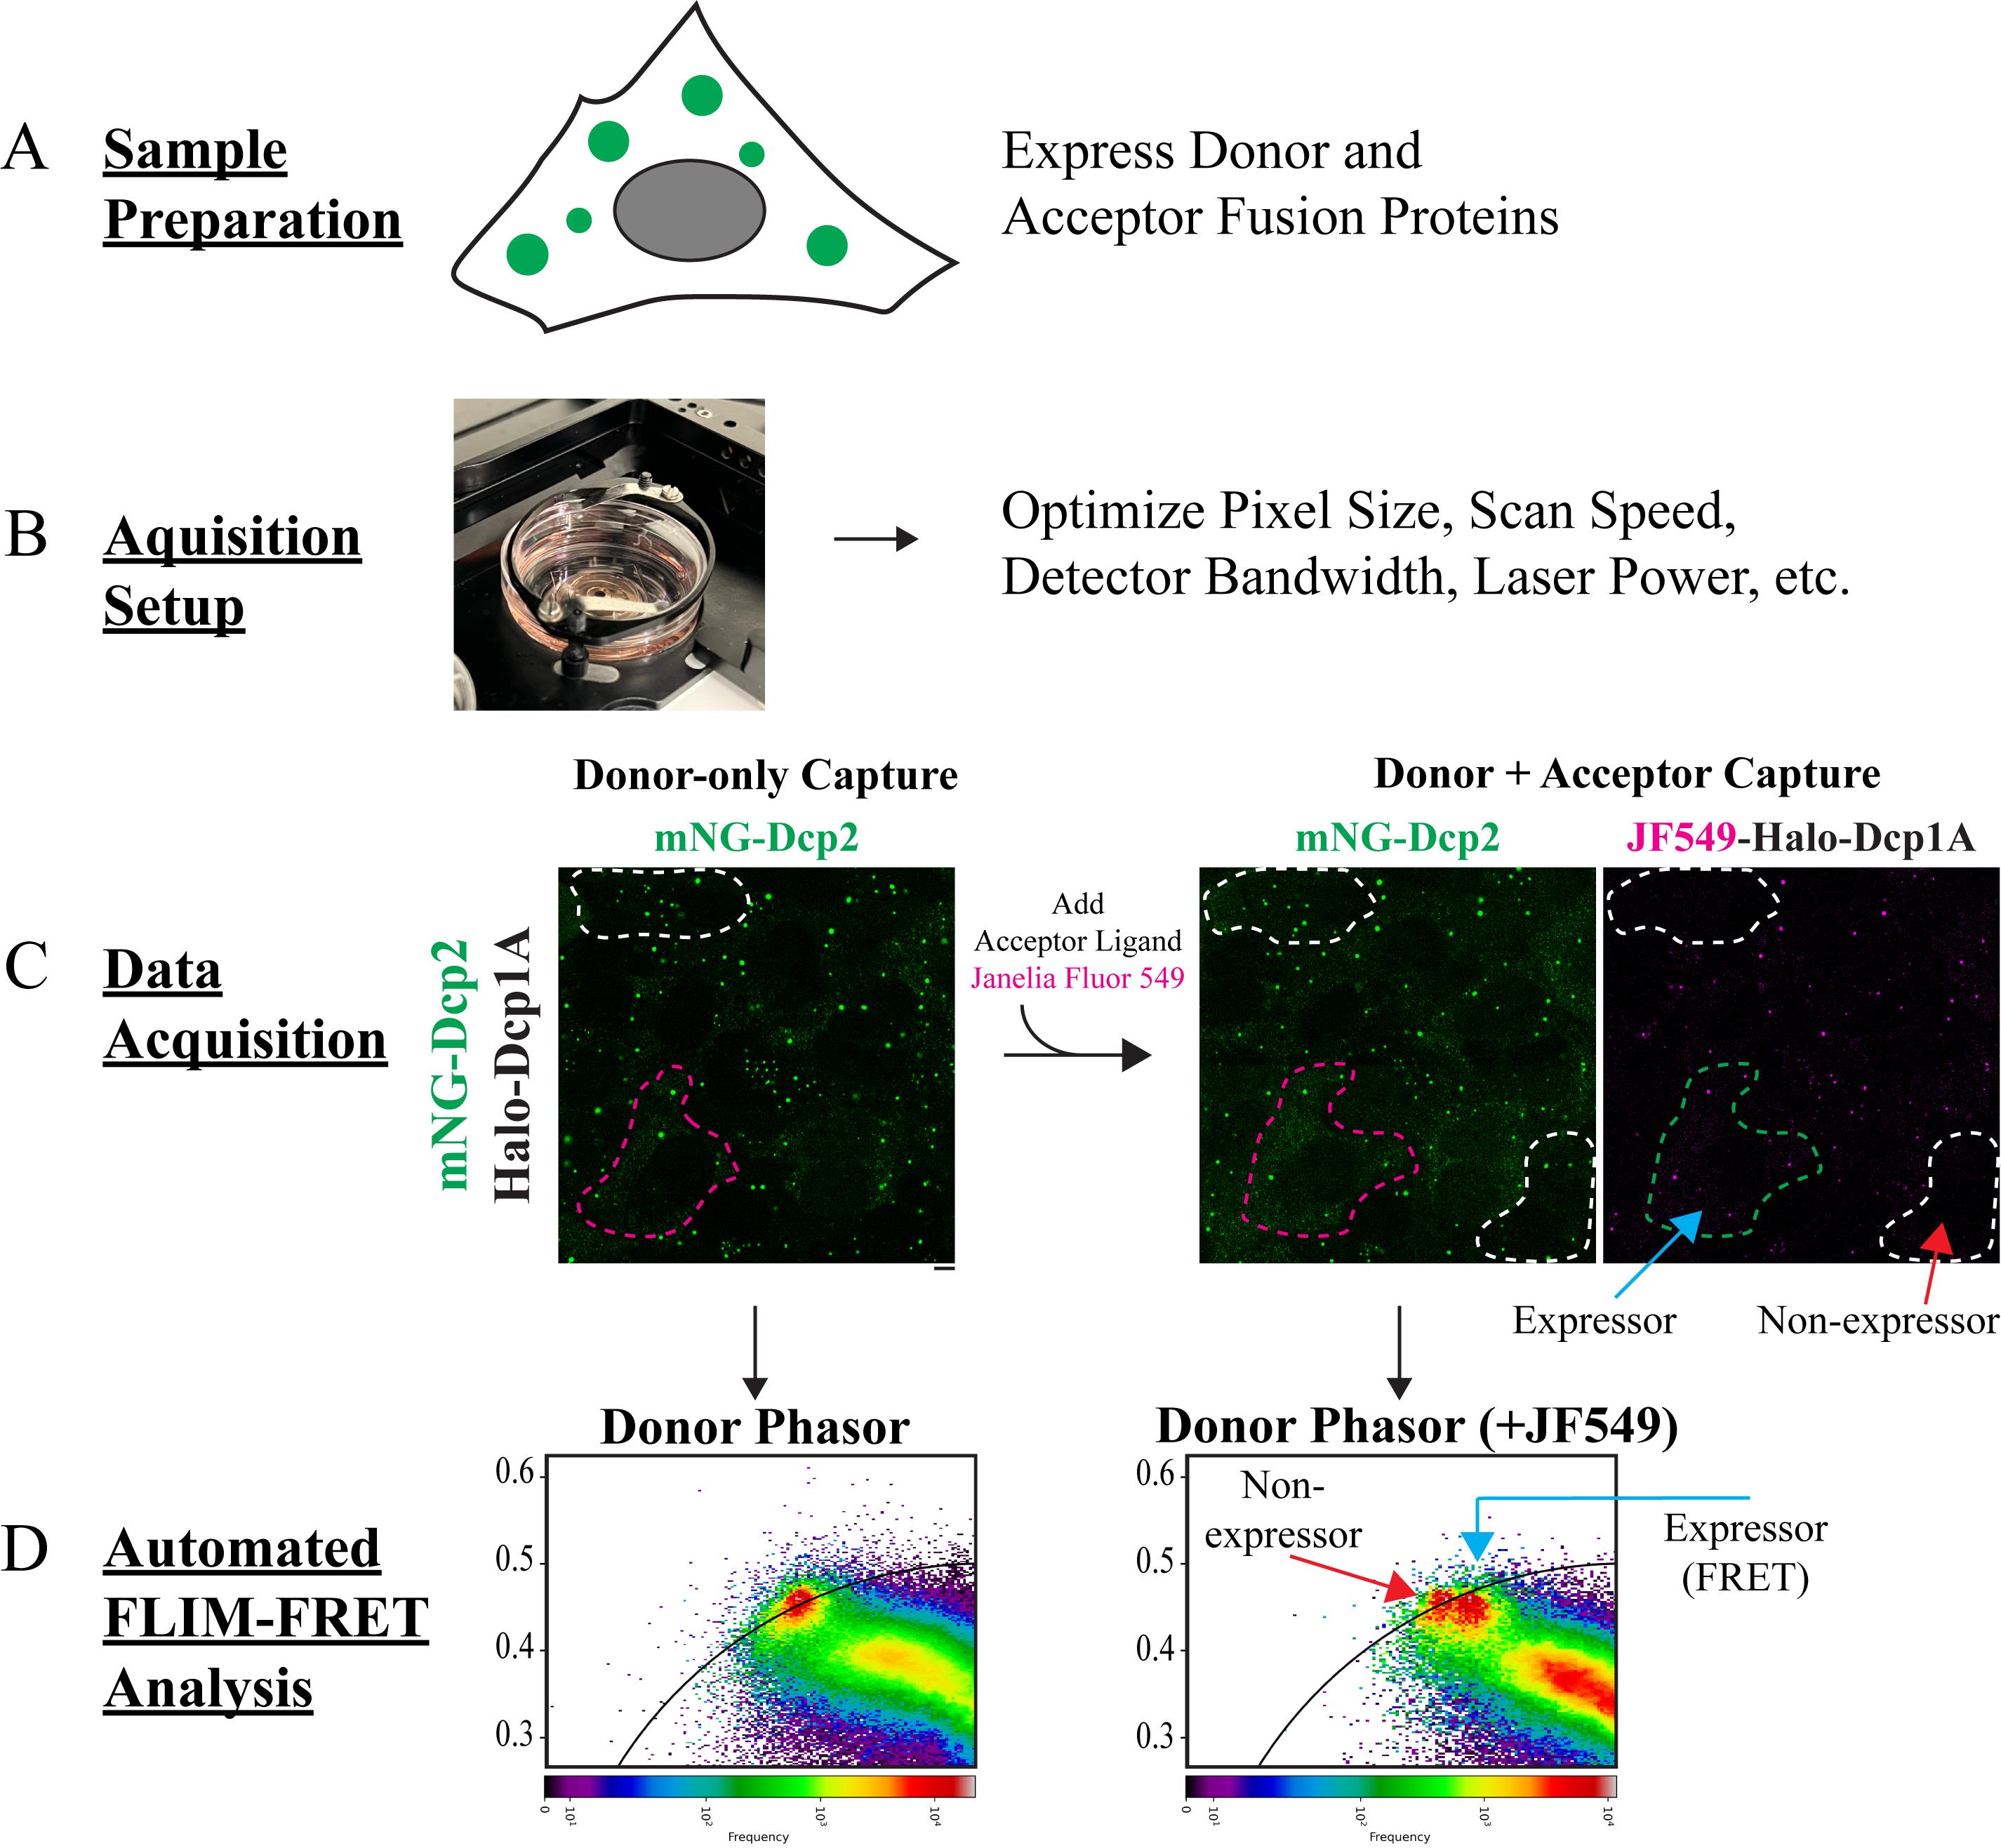
Figure 1. Overview schematic of fluorescence lifetime imaging–Forster resonant energy transfer (FLIM-FRET) data acquisition procedure. (A) Prepare samples with the cell line of interest expressing the protein–protein interaction pair of interest. One FRET partner is fused to a donor fluorophore, and the other is fused to a fluorescently conjugatable protein tag (such as HaloTag or SNAPtag) as the acceptor. (B) Set up image capture settings and optimize fluorescence intensity by adjusting pixel size, scan speed, detector bandwidth, and laser power. (C) Capture two separate donor-only and donor + acceptor images for quantification. For demonstration purposes, U-2 OS cells expressing mNeonGreen-Dcp2 as the donor and HaloTag-Dcp1A as the acceptor are shown. For illustrative purposes, green and magenta dotted outlines indicate cells that express both donor and acceptor FRET pairs. White dotted outlines indicate cells that only express the donor. Scale bar = 10 μm. (D) The final step is to process FLIM data by generating phasor plots and measuring decreases in donor fluorescence lifetime after addition of the acceptor ligand. A positive FRET signal is indicated by a clockwise shift in cluster position on the phasor plot. Microscopy images and representative phasor plots are adapted from [15].
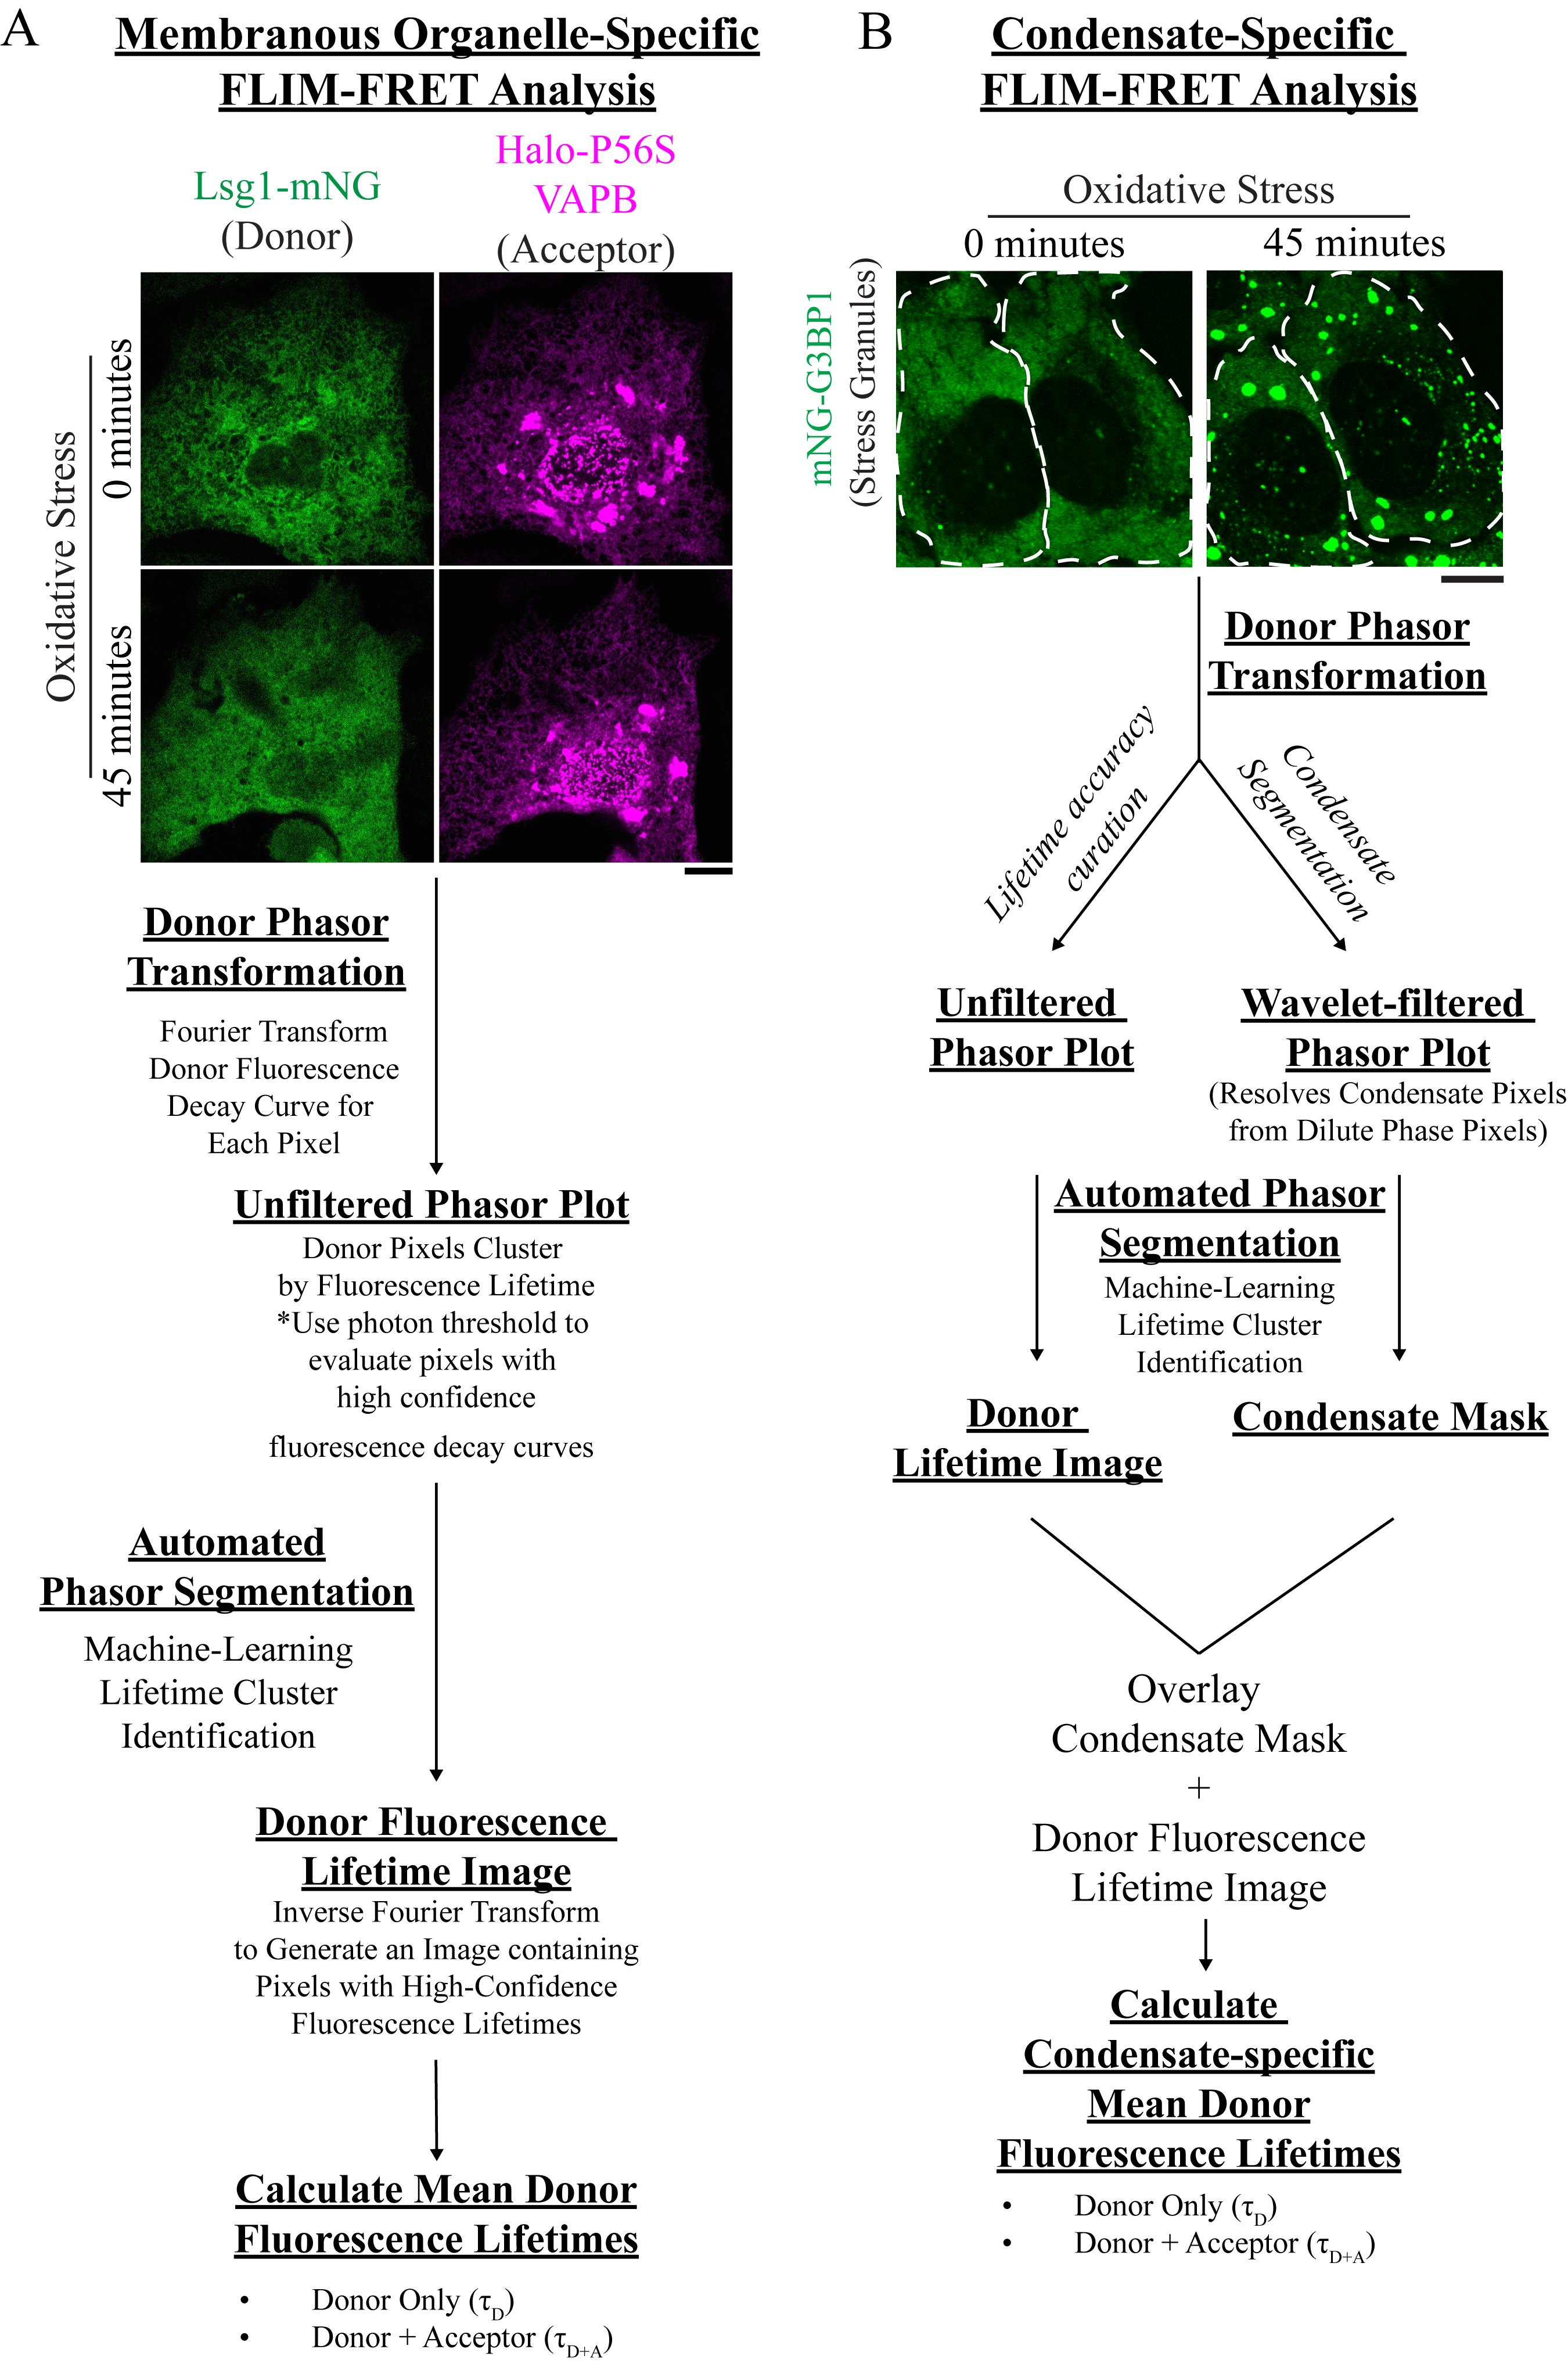
Figure 2. Overview of the fluorescence lifetime imaging (FLIM) data processing and Forster resonant energy transfer (FRET) analysis pipelines. (A) Post-acquisition FRET analysis procedure for FRET pairs that localize to membrane-bound organelles. The example illustrates two proteins, Lsg1 and VAPB, that localize to the endoplasmic reticulum during stress. However, the P56S mutant form of VAPB fails to recruit Lsg1 to the endoplasmic reticulum after 45 min of oxidative stress (500 μM NaAsO2). Scale bar = 10 μm. This analysis pipeline is a simplified version that does not require wavelet-based segmentation. (B) Post-acquisition FRET analysis procedure for FRET pairs that localize to condensates (membraneless organelles). The presented example shows how G3BP1, a core stress granule component, localizes into stress granules in response to oxidative stress (500 μM NaAsO2). This necessitates an additional phasor-based condensate segmentation step in combination with the lifetime measurements shown in A. Microscopy images of stress granules are adapted from [15].
Materials and reagents
Biological materials
1. Cell line of interest expressing donor-tagged and acceptor-tagged interaction pairs
Note: Here, for demonstration purposes, we use U-2 OS cells (ATCC, catalog number: HTB-96) stably expressing mNeonGreen-Dcp2 and HaloTag-Dcp1A or HaloTag-Dcp1B. However, this protocol can be adapted to work with any FRET-capable pair of fluorescent proteins fused to any two proteins of interest (see General note 1).
Reagents
1. Janelia Fluor® 549 HaloTag® ligand (Promega, catalog number: HT102A)
2. McCoy’s 5a medium (Sigma-Aldrich, catalog number: M8403)
3. GlutaMAXTM supplement (Gibco, catalog number: 35050061)
4. FBS, Opti-Gold (Genedepot, catalog number: F0900-050)
5. Penicillin-streptomycin 10,000 U/mL (Gibco, catalog number: 15140122)
6. Trypsin-EDTA (0.05%), phenol red (Gibco, catalog number: 25300062)
7. Phosphate buffered saline (PBS) 20×, ultrapure (VWR, catalog number: E703)
8. N, N-Dimethylformamide (Sigma-Aldrich, catalog number: 227056)
9. Type F immersion liquid (Leica Microsystems, catalog number: 11513859)
Solutions
1. Complete McCoy’s 5a medium (see Recipes)
2. Janelia Fluor® 549 HaloTag® ligand stock (see Recipes)
Recipes
1. Complete McCoy’s 5a medium
| Reagent | Final concentration | Quantity or volume |
|---|---|---|
| McCoy’s 5a medium | 88% | 440 mL |
| Penicillin-streptomycin (100×) | 1% | 5 mL |
| GlutaMAXTM supplement (100×) | 1% | 5 mL |
| FBS, Opti-Gold | 10% | 50 mL |
2. Janelia Fluor® 549 HaloTag® ligand stock
| Reagent | Final concentration | Quantity or volume |
|---|---|---|
| Janelia Fluor® 549 HaloTag® ligand | 14 µM | 5 µg |
| N, N-Dimethylformamide | n/a | 70 µL |
Aliquot in small volumes to avoid freeze-thaw cycles. Store at -20 °C.
Laboratory supplies
1. 35 mm micro-well dishes (Cellvis, catalog number: D35-14)
2. 6 cm cell culture dishes (VWR, catalog number: 10861-658)
3. 5 mL serological pipettes (Corning, catalog number: CLS4251)
4. 10 μL pipette tips (VWR, catalog number: 613-6440)
5. Microcentrifuge tubes (VWR, catalog number: 87003-294)
Equipment
1. Confocal microscope (Leica, model: Stellaris 8 FALCON)
2. 63× objective (HC PL APO CS2 63× 1.40 N.A. Oil Immersion Objective, Leica, model: 15506350)
3. 78 MHz pulsed white light laser (WLL, 440–790 nm) (Leica, model: 158301100)
Note: A slower pulsed laser (e.g., 40 MHz) may also be used to more accurately detect fluorescent proteins with longer lifetimes. See General note 2.
4. HyD X detector (Leica, model: 158301324)
5. HyD R detector (Leica, model: 158301335)
Note: Non-hybrid detectors can also be used to collect lifetime data, so long as they can record single photon events (e.g., MCP-PMT or SPAD detectors)
6. Stage top incubation system and objective heater (Okolab, model: H301)
Note: Any stage top incubator can be used, so long as it can maintain physiological conditions to support the desired cell system (e.g., 37 °C, 5% CO2, and 90% humidity)
7. Pipette controller (VWR, model: 613-4448)
8. Class II biosafety cabinet (Labconco, catalog number: LCN 302481101)
9. CO2 incubator (PHCBI, catalog number: MCO-170AICUVDL-PA)
10. 10 μL micropipette (Eppendorf, catalog number: EP3124000016)
Software and datasets
1. Leica Application Suite X (LAS X, Leica Microsystems)
2. Leica Application Suite X FLIM (LAS X, Leica Microsystems)
3. FLUTE (open source) [25]
4. FIJI/ImageJ (open source)
5. Microsoft Excel
6. ComplexWaveletFilter [open source, system requirements: MacOS 10.9 (Mavericks) or later, Python v3.6.0], release date: December 23, 2025. This code has been deposited to GitHub (https://github.com/LeeLabBCM/ComplexWaveletFilter) and archived on Zenodo (DOI: 10.5281/zenodo.20631326; release v1.0.0).
Procedure
登录/注册后免费查看全文
文章信息
稿件历史记录
提交日期: Apr 30, 2026
接收日期: Jun 21, 2026
在线发布日期: Jul 9, 2026
出版日期: Aug 5, 2026
版权信息
© 2026 The Author(s); This is an open access article under the CC BY-NC license (https://creativecommons.org/licenses/by-nc/4.0/).
如何引用
Readers should cite both the Bio-protocol article and the original research article where this protocol was used:
- Powell, N. D., Marcus, J. M., Fahim, L. E. and Lee, J. E. (2026). Automated FLIM-FRET Segmentation Within RNP Condensates. Bio-protocol 16(15): e5775. DOI: 10.21769/BioProtoc.5775.
- Fahim, L. E., Marcus, J. M., Powell, N. D., Ralston, Z. A., Walgamotte, K., Perego, E., Vicidomini, G., Rossetta, A. and Lee, J. E. (2024). Fluorescence lifetime sorting reveals tunable enzyme interactions within cytoplasmic condensates. J Cell Biol. 224(1): e202311105. https://doi.org/10.1083/jcb.202311105

 Download Citation in RIS Format
分类
细胞生物学 > 细胞成像 > 活细胞成像
细胞生物学 > 细胞成像 > 荧光
生物化学 > 蛋白质 > 相互作用 > 蛋白质-蛋白质相互作用
您对这篇实验方案有问题吗?
在此处发布您的问题,我们将邀请本文作者来回答。同时,我们会将您的问题发布到Bio-protocol Exchange,以便寻求社区成员的帮助。
 发布问题
发布问题


