


Dual Color tau-STED Super Resolution Microscopy in Arabidopsis Root Tip
拟南芥根尖的双色tau-STED超分辨显微成像


发布: 2026年08月05日第16卷第15期 DOI: 10.21769/BioProtoc.5774 浏览次数: 283
评审: Subash Chandra GodarAnonymous reviewer(s)
 PDF
PDF  Q&A
Q&A
参见作者原研究论文
The authors used this protocol in:

Mar 2025
Advertisement






Abstract
Super-resolution microscopy has transformed our ability to visualize subcellular structures, but its application in plant biology remains challenging due to the optical complexity of plant tissues. Here, we present a detailed protocol for tau-STED microscopy (Leica Microsystems), which combines stimulated emission depletion (STED) with fluorescence lifetime imaging (FLIM) to achieve nanoscale resolution while minimizing phototoxicity. This method leverages time-correlated single-photon counting (TCSPC) to separate fluorescence signals based on their lifetimes, enhancing signal specificity and enabling the visualization of elusive subcellular compartments in Arabidopsis thaliana root tips. The protocol covers sample preparation, fluorophore selection, microscope configuration, image acquisition, and data analysis, providing a step-by-step guide to optimize tau-STED imaging for plant cell biology. By addressing the unique challenges of plant tissue imaging, such as autofluorescence, refractive index mismatches, and light scattering, this approach facilitates super-resolution imaging of intracellular structures, including the plant endoplasmic reticulum–Golgi intermediate compartment (ERGIC). This protocol is designed to be accessible to researchers with basic microscopy experience and offers a robust framework for exploring subcellular dynamics in plants with unprecedented detail.
Key features
• tau-STED integrates STED signals with fluorescence lifetime via phasor analysis at confocal speeds, enabling low-noise super-resolution imaging.
• Morphometry analysis workflow at super resolution.
Keywords: Cell biology (细胞生物学) Super-resolution microscopy (超分辨显微术)
Plant biology (植物生物学)
STED (STED)
Lifetime (荧光寿命)
tau-STED (tau-STED)
Arabidopsis thaliana (拟南芥)
Super-resolution microscopy (超分辨显微术)
Plant biology (植物生物学)
STED (STED)
Lifetime (荧光寿命)
tau-STED (tau-STED)
Arabidopsis thaliana (拟南芥)
Graphical overview
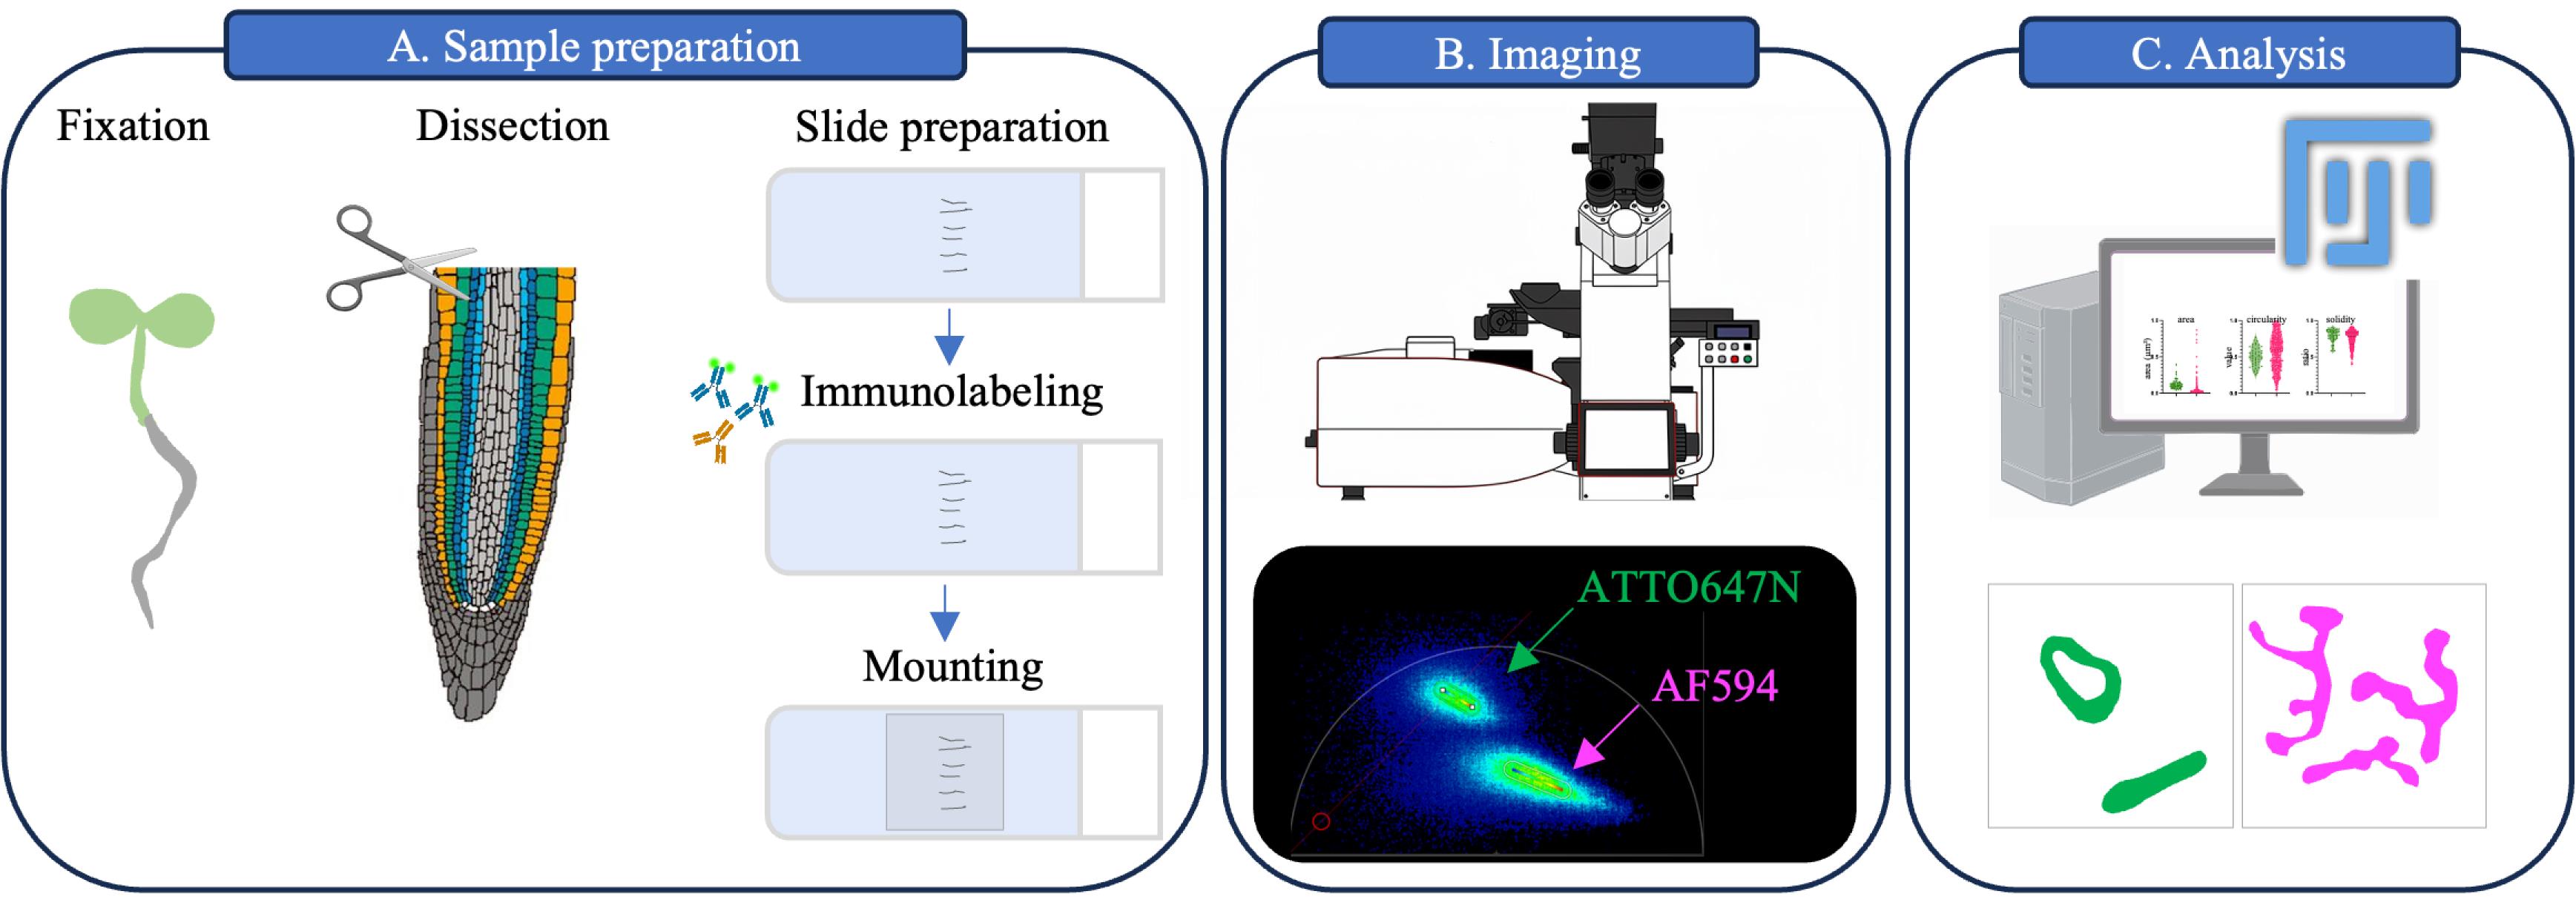
Schematic representation of the steps of the tau-STED microscopy in Arabidopsis root tips. (A) Sample preparation principal steps: chemical fixation, dissection of the root tip, slide preparation, immunolabeling, and mounting with MOWIOL. (B) Imaging of the sample using the SP8 STED FALCON after optimization. (C) Image analysis using FIJI.
Background
Super-resolution microscopy (SRM) has revolutionized the study of cellular processes by transcending the resolution limits of conventional light microscopy, achieving resolutions as fine as 10 nm in some cases. Techniques such as stimulated emission depletion (STED) and single-molecule localization microscopy (SMLM), both recognized by the 2014 Nobel Prize in Chemistry, have driven transformative biological discoveries by revealing subcellular details previously obscured by the diffraction barrier [1]. However, despite its immense potential, SRM remains underutilized in the study of cell wall–encapsulated organisms like plants, leaving a significant research frontier largely unexplored. This limited adoption stems from the intrinsic challenges posed by plant samples, including the rigid and complex structure of the cell wall, tissue heterogeneity, internal air spaces, and high levels of autofluorescence from pigments and secondary metabolites. These factors collectively complicate the application of SRM in plant biology, often obscuring the fine details of subcellular organization.
Among SRM techniques, STED microscopy stands out for its ability to surpass the diffraction limit of conventional fluorescence microscopy. By employing a depletion laser to selectively switch off fluorophores at the periphery of the excitation spot, STED achieves nanometer-scale resolution, enabling the visualization of subcellular structures with unprecedented clarity [1,2]. This depletion process not only refines spatial resolution but also alters the photophysical properties of fluorophores, particularly their fluorescence lifetime—the average time a fluorophore remains in the excited state before emitting a photon. As the depletion laser pushes fluorophores back to the ground state, it effectively shortens their lifetime, creating a distinction between depleted and non-depleted states [3,4]. However, STED has historically been less frequently applied to plant tissues due to two main challenges: the limited imaging depth of SRM objectives and the degradation of image quality caused by high background fluorescence emitted within the tissue under depletion. Consequently, it was long assumed that STED was not very efficient in plant tissues.
To fully exploit this lifetime information, Leica Microsystems developed tau-STED, an advanced technology that integrates STED with fluorescence lifetime imaging using time-correlated single-photon counting (TCSPC) [5–7]. During imaging, tau-STED simultaneously depletes the sample and collects photon lifetime data, accumulating information that allows fluorescence signals to be separated based on their distinct lifetimes. By filtering out background photons and by prioritizing photons from the doughnut center, tau-STED significantly improves resolution and enhances signal specificity, making it particularly effective for challenging samples like plant tissues. This innovation has opened new avenues for plant cell biologists, enabling the visualization of structures that were previously difficult to resolve.
One of the most compelling applications of tau-STED in plant biology is its ability to identify and characterize the plant endoplasmic reticulum–Golgi intermediate compartment (ERGIC) [8]. In our disruptive study [8], we employed tau-STED to distinguish the ERGIC from other membrane-bound compartments in Arabidopsis thaliana, uncovering its unique organization. The ERGIC’s close association with the endoplasmic reticulum and Golgi apparatus had long made it difficult to visualize using conventional microscopy. However, tau-STED’s capacity to resolve fine structural details and separate overlapping signals based on fluorescence lifetime proved instrumental in clarifying the ERGIC’s distinct identity and function. This discovery underscores tau-STED’s potential to reveal previously elusive subcellular structures, establishing it as an invaluable tool for investigating intracellular trafficking and organelle dynamics in plants.
Building on these advancements, this protocol offers a comprehensive, step-by-step guide to using tau-STED microscopy for visualizing subcellular compartments in Arabidopsis root tips. From sample preparation—including fixation, dissection, immunolabeling optimization, and fluorophore selection—to image acquisition and data analysis, each stage is designed to maximize resolution and signal quality while minimizing phototoxicity. By addressing the unique challenges of plant tissue imaging, this approach empowers researchers to explore the intricate subcellular landscapes of plants with unprecedented precision.
Materials and reagents
Biological materials
1. Arabidopsis thaliana transgenic fluorescent line pUBQ10::mCherry-MEMB12 and p35S::NAG-EGFP [9,10] or any relevant fluorescent transgenic line
Reagents
1. Distilled water
2. Murashige and Skoog medium (MS) (Duchefa Biochemie, catalog number: M0222.0050)
3. Sucrose (Sigma-Aldrich, catalog number: H4034-500G)
4. Plant agar (Duchefa Biochemie, catalog number: P1001.1000)
5. MES [2-(N-morpholino)ethanesulfonic acid] (Euromedex, catalog number: EU0033-A)
6. 1,4-piperazinediethanesulfonic acid (PIPES) (Sigma-Aldrich, catalog number: P6757-100G)
7. Ethylene glycol-bis(2-aminoethylether)-N,N,N′,N′-tetraacetic acid (EGTA) (Sigma-Aldrich, catalog number: E4378-100G)
8. Magnesium sulfate (MgSO4) (Euromedex, catalog number: P027-A)
9. Potassium hydroxide (KOH) (Sigma-Aldrich, catalog number: P5958-500G)
10. Paraformaldehyde (PFA) 16% (Ted Pella, catalog number: 18505)
11. Driselase (Sigma-Aldrich, catalog number: D9515-5G); store at -20 °C
12. Dimethyl sulfoxide (DMSO) (Sigma-Aldrich, catalog number: D8418-250ML)
13. IGEPAL CA-630 (Sigma-Aldrich, catalog number: I3021)
14. Normal donkey serum (NDS) (Abcam, catalog number: ab7475-10mL)
15. ChromoTek GFPboosterATTO647N (Proteintech, catalog number: gba647n)
16. ChromoTek RFPboosterATTO594 (Proteintech, catalog number: rba594)
17. FluoTag®-X4 anti-RFP abberior STAR 635P (Nanotag, catalog number: N0404-Ab635P-L)
18. Anti-MEMB (not commercially available [10])
19. Goat anti-rabbit IgG (H+L) cross-adsorbed secondary antibody, Alexa FluorTM 594 (Thermo Fisher Scientific, catalog number: A-11012)
20. Tris base (Sigma-Aldrich, catalog number: T6066)
21. Hydrochloric acid (HCl) 37% (Sigma-Aldrich, catalog number: 320331-2.5L)
22. Glycerol (Sigma-Aldrich, catalog number: G5516)
23. Mowiol 4-88 (Merck, catalog number: 475904)
24. 1.4-Diazabicyclo-2.2.29-octan (DABCO) (Sigma-Aldrich, catalog number: 27802)
Solutions
1. MES 0.5% pH 5.8 (see Recipes)
2. 1/2 Murashige and Skoog agar plate (1/2 MS agar plate) (see Recipes)
3. Microtubule Stabilizing Buffer 4/3 solution (MTSB 4/3 solution) (see Recipes)
4. Microtubule Stabilizing Buffer 1× solution (MTSB 1× solution) (see Recipes)
5. Fixation solution (see Recipes)
6. Cell wall digestion buffer (see Recipes)
7. Permeabilization buffer (see Recipes)
8. Blocking solution (see Recipes)
9. Primary antibody solution (see Recipes)
10. Secondary antibody solution (see Recipes)
11. Nanobody solution (see Recipes)
12. Tris 0.2 M pH 7.4 (see Recipes)
13. Mowiol (see Recipes)
Recipes
1. MES 0.5% pH 5.8
| Reagent | Final concentration | Quantity or volume |
|---|---|---|
| MES | 0.5% | 0.5 g |
| Water | n/a | Complete to 100 mL |
Adjust the pH with KOH 10 N.
Note: The solution can be stored for several months at room temperature.
2. 1/2 MS agar plate
| Reagent | Final concentration | Quantity or volume |
|---|---|---|
| MS | 0.22% | 0.55 g |
| Sucrose | 1% | 2.5 g |
| Agar plant | 0.8% | 2 g |
| MES 0.5% pH 5.8 | 0.05% | 25 mL |
| Water | n/a | Complete to 250 mL |
a. Mix the solution.
b. Autoclave for 30 min at 110 °C.
c. Under sterile conditions, add 50 mL of solution per square plate.
d. Let it polymerize for 30 min at room temperature.
Note: The plates can be stored for several weeks at 4 °C in sterile conditions.
3. MTSB 4/3 solution
| Reagent | Final concentration | Quantity or volume |
|---|---|---|
| PIPES | 66.66 nM | 2.52 g |
| EGTA | 506.66 g/mol | 0.315 g |
| MgSO4 | 6.66 mM | 0.205 g |
| Water | n/a | Complete to 250 mL |
Adjust pH to 7 with KOH.
Note: The MTSB 4/3 solution can be sterilized (110 °C, 30 min) and stored for several months at 4 °C.
4. MTSB 1× solution
| Reagent | Final concentration | Quantity or volume |
|---|---|---|
| PIPES | 50 nM | 7.5 g |
| EGTA | 380 g/mol | 0.95 g |
| MgSO4 | 5 mM | 0.61 g |
| Water | n/a | Complete to 500 mL |
Adjust pH to 7 with KOH.
Note: The MTSB solution can be sterilized (110 °C, 30 min) and stored for several months at 4 °C.
5. Fixation solution
| Reagent | Final concentration | Quantity or volume |
|---|---|---|
| PFA 16% | 4% | 10 mL |
| MTSB 4/3 solution | n/a | 30 mL |
Note: Store PFA at 4 °C. PFA is a carcinogen and needs to be manipulated under a flow hood.
6. Cell wall digestion buffer
| Reagent | Final concentration | Quantity or volume |
|---|---|---|
| Driselase | 2 g/100mL | 0.02 g |
| MTSB 1× solution | n/a | 1 mL |
Note: This solution needs to be freshly prepared. After resuspension, centrifuge briefly at 500× g at room temperature to pull the debris of the Driselase extract powder.
7. Permeabilization buffer
| Reagent | Final concentration | Quantity or volume |
|---|---|---|
| DMSO | 10 g/100 mL | 250 μL |
| IGEPAL | 3 g/100 mL | 75 μL |
| MTSB 1× solution | n/a | 2.175 mL |
Note: This solution needs to be freshly prepared.
8. Blocking solution
| Reagent | Final concentration | Quantity or volume |
|---|---|---|
| NDS | 5% | 250 μL |
| MTSB 1× solution | n/a | 2.25 mL |
Note: This solution needs to be freshly prepared.
9. Primary antibody solution
| Reagent | Final concentration | Quantity or volume |
|---|---|---|
| Anti-MEMB | 1/300 | 0.66 μL |
| Blocking solution | n/a | Complete to 200 μL |
Note: In this study, we used anti-MEMB, but any relevant primary antibody can be used. For other antibodies, we advise testing a range of dilutions from 1/100 to 1/600. This solution needs to be freshly prepared, and a range of dilutions needs to be tested to optimize the immunolabeling.
10. Secondary antibody solution
| Reagent | Final concentration | Quantity or volume |
|---|---|---|
| Goat anti-rabbit IgG (H+L) cross-adsorbed secondary antibody, Alexa FluorTM 594 | 1/400 (5 μg/mL) | 0.5 μL |
| Blocking solution | n/a | Complete to 200 μL |
Note: In this study, we used anti-rabbit secondary antibodies, but, obviously, the secondary antibody needs to target the host species of the relevant primary antibody previously used. This solution needs to be freshly prepared, and a range of dilutions needs to be tested to optimize the immunolabeling.
11. Nanobody solution
| Reagent | Final concentration | Quantity or volume |
|---|---|---|
| ChromoTek GFPboosterATTO647N | 1/400 | 0.5 μL |
| Blocking solution | n/a | Complete to 200 μL |
Alternative labeling strategies: If a double marker transgenic line is used with GFP- and RFP-tagged (or other fluorescent protein derived from GFP and RFP) proteins, select one of the combinations below:
| Reagent | Final concentration | Quantity or volume |
|---|---|---|
| ChromoTek GFPboosterATTO594 | 1/400 | 0.5 μL |
| FluoTag RFP Star635P | 1/500 (10 nM) | 0.4 μL |
| Blocking solution | n/a | Complete to 200 μL |
Note: These dilutions are set up for NAG1-EGFP and MEMB-mCherry; if other fluorescently tagged proteins are used, we advise testing a range of dilutions from 1/200 to 1/2,000. This solution needs to be freshly prepared, and a range of dilutions needs to be tested to optimize the immunolabeling. Several nanobodies can be incubated simultaneously.
12. Tris 0.2 M pH 7.4
| Reagent | Final concentration | Quantity or volume |
|---|---|---|
| Tris base | 0.2 M | 1.21 g |
| Distilled water | n/a | 50 mL |
Adjust pH to 7.4 with the addition of HCl 37%.
13. Mowiol
| Reagent | Final concentration | Quantity or volume |
|---|---|---|
| Glycerol | 0.12 g/mL | 6 g |
| Mowiol 4-88 | 0.048 g/mL | 2.4 g |
| Distilled water | - | 6 mL |
| Tris 0.2 M pH 7.4 | 0.048 M | 12 mL |
| DABCO | 2.5% | 625 mg |
a. Shake the solution for 4 h at room temperature on a rotative wheel.
b. Let the solution rest for 2 h at room temperature.
c. Incubate for 10 min at 50 °C in a water bath.
d. Centrifuge at 5,000× g for 15 min.
e. Recover the supernatant.
f. Adjust the pH to 7.4 using HCl 37%.
Note: The use of pH paper is recommended for this step. If the pH level is exceeded by mistake, discard the solution and make it again (see Troubleshooting).
g. Prepare 500 μL aliquots in 1.5 mL Eppendorfs and store at -20 °C for long-term storage.
Laboratory supplies
1. Falcon 50 mL (Sarstedt, catalog number: 62.547.254)
2. 1.5 mL Eppendorf (Sarstedt, catalog number: 72.706.400
3. Square Petri dish 120 × 120 mm (Dutscher, catalog number: 030555S)
4. 6-well plate (SARSTEDT, catalog number: TC-Plate 6 wall, suspension F 83.3920500)
5. Fine dissection clamp (Fisher Scientific, catalog number: 13-812-41)
6. SuperFrost Plus ground edge 90° clipped corner x72 (Labelians, catalog number: LSFPLUSCC)
7. Razor blade (Swann-Morton, catalog number: 0213 No26)
8. Hydrophobic pen (VectorLab ImmEdge, catalog number: H-4000 (ZL0627)
9. Slide box (Merck, catalog number: HS15991A)
10. Coverslip (VWS, catalog number: 631-0125 thickness N°1.5 Borosilicate Glass)
11. Transparent nail polish (Rimmel london, catalog number: 740 clear-8mL)
12. Magnetic stirrer (Thermo Scientific, catalog number: 88880007)
13. Magnetic bar (Thermo Scientific, catalog number: 50087930)
Equipment
1. Autoclave PBI Stematic III (GEMINI, catalog number: 05523)
2. Table shaker (Infors HT, model: Orbitron)
3. Balances (Sartorius)
4. Centrifuge for Falcon tubes 50 (Beckman Coulter, model: Allegra21R)
5. pH meter (Mettler TOLEDO, model: seven compact)
6. Microscopy: The equipment used included a Leica SP8 WLL2 confocal microscope mounted on an inverted DMI6000 stand (Leica Microsystems, Mannheim, Germany), equipped with a HC PL APO CS2 motCORR 93× glycerol objective (NA 1.3). The system featured an 80 MHz pulsed white light laser 2 (WLL2) with tunable excitation from 470 to 670 nm in 1 nm increments. Scanning was performed using a conventional scanner operating at frequencies ranging from 10 to 1,800 Hz. Detection was achieved via two internal photomultiplier tubes (PMTs), two internal hybrid detectors, and one external PMT for transmission. Additionally, the microscope was outfitted with a 3D STED module, enabling STED microscopy in both XY and Z directions. A variable allocator split the laser beam into two paths to shape the light: a two-dimensional (2D) STED doughnut using a vortex phase plate and a three-dimensional (3D) STED z-doughnut using a pi-step phase mask. The STED setup included a 775 nm depletion pulsed laser (80 MHz) and was exclusively used with the 93× glycerol 1.3 objective. The FALCON module allowed for fluorescence lifetime measurement, enhancing STED images through photon filtering by lifetime (tau-STED).
Software and datasets
1. FIJI (ImageJ, Version 1.54p)
2. LASX 3.5.10
Procedure
登录/注册后免费查看全文
文章信息
稿件历史记录
提交日期: Apr 23, 2026
接收日期: Jun 21, 2026
在线发布日期: Jul 9, 2026
出版日期: Aug 5, 2026
版权信息
© 2026 The Author(s); This is an open access article under the CC BY-NC license (https://creativecommons.org/licenses/by-nc/4.0/).
如何引用
Fougère, L., Poujol, C., Boutté, Y. and Grison, M. (2026). Dual Color tau-STED Super Resolution Microscopy in Arabidopsis Root Tip. Bio-protocol 16(15): e5774. DOI: 10.21769/BioProtoc.5774.

 Download Citation in RIS Format
分类
植物科学 > 植物细胞生物学 > 细胞成像
植物科学 > 植物细胞生物学 > 细胞结构
您对这篇实验方案有问题吗?
在此处发布您的问题,我们将邀请本文作者来回答。同时,我们会将您的问题发布到Bio-protocol Exchange,以便寻求社区成员的帮助。
 发布问题
发布问题


