


direct Stochastic Optical Reconstruction Microscopy to Determine the Oligomeric State of Proteins on the Plasma Membrane and Their Accessibility for Immunotherapeutic Antibodies
利用直接随机光学重建显微术分析质膜蛋白的寡聚状态及其对免疫治疗抗体的可及性

(*contributed equally to this work) 发布: 2026年08月05日第16卷第15期 DOI: 10.21769/BioProtoc.5767 浏览次数: 311
评审: David PaulDevika AndhareAnonymous reviewer(s)
 PDF
PDF  Q&A
Q&A
参见作者原研究论文
The authors used this protocol in:

Feb 2026
Advertisement






Abstract
Super-resolution fluorescence microscopy enables the visualization of protein structures at nanometer resolution, providing insights into receptor organization on the plasma membrane that are essential for the development and optimization of immunotherapies. In this context, monoclonal antibodies are employed, which typically bind only a subset of available membrane receptors, due to steric hindrance or otherwise limited epitope accessibility, to quantify the accessible targets. These accessible targets, rather than the total receptor density, are critical for determining therapeutic efficacy. Here, we present a simplified, robust protocol to quantify antibody-accessible endogenous receptors using monoclonal antibodies directly labeled with fluorescent dyes in combination with total internal reflection fluorescence (TIRF) direct stochastic optical reconstruction microscopy (dSTORM). The method employs optimized labeling and fixation conditions to preserve the native receptor distribution, enabling precise quantification of accessible receptors and their stoichiometry at single-molecule resolution. Omitting secondary antibodies and minimizing fixation-induced artifacts prevents artificial clustering and maintains the physiological binding pattern of therapeutic antibodies. The standardized workflow delivers therapy-relevant information about receptor accessibility and organization underlying therapeutic antibody binding, thereby advancing the mechanistic understanding of immunotherapy resistance and personalized treatment strategies across diverse membrane protein targets.
Key features
• Influence of fixation conditions on receptor epitope accessibility.
• Use of therapeutic antibodies for quantitative estimation of receptor availability relevant to immunotherapy.
• Fluorophore localizations provide information on antibody binding events below the optical resolution limit.
Keywords: Single-molecule localization microscopy (单分子定位显微术) Super-resolution fluorescence microscopy (超分辨率荧光显微术)
Membrane proteins (膜蛋白)
Live-cell staining (活细胞染色)
Immunofluorescence (免疫荧光)
Immunotherapy (免疫治疗)
Super-resolution fluorescence microscopy (超分辨率荧光显微术)
Membrane proteins (膜蛋白)
Live-cell staining (活细胞染色)
Immunofluorescence (免疫荧光)
Immunotherapy (免疫治疗)
Graphical overview
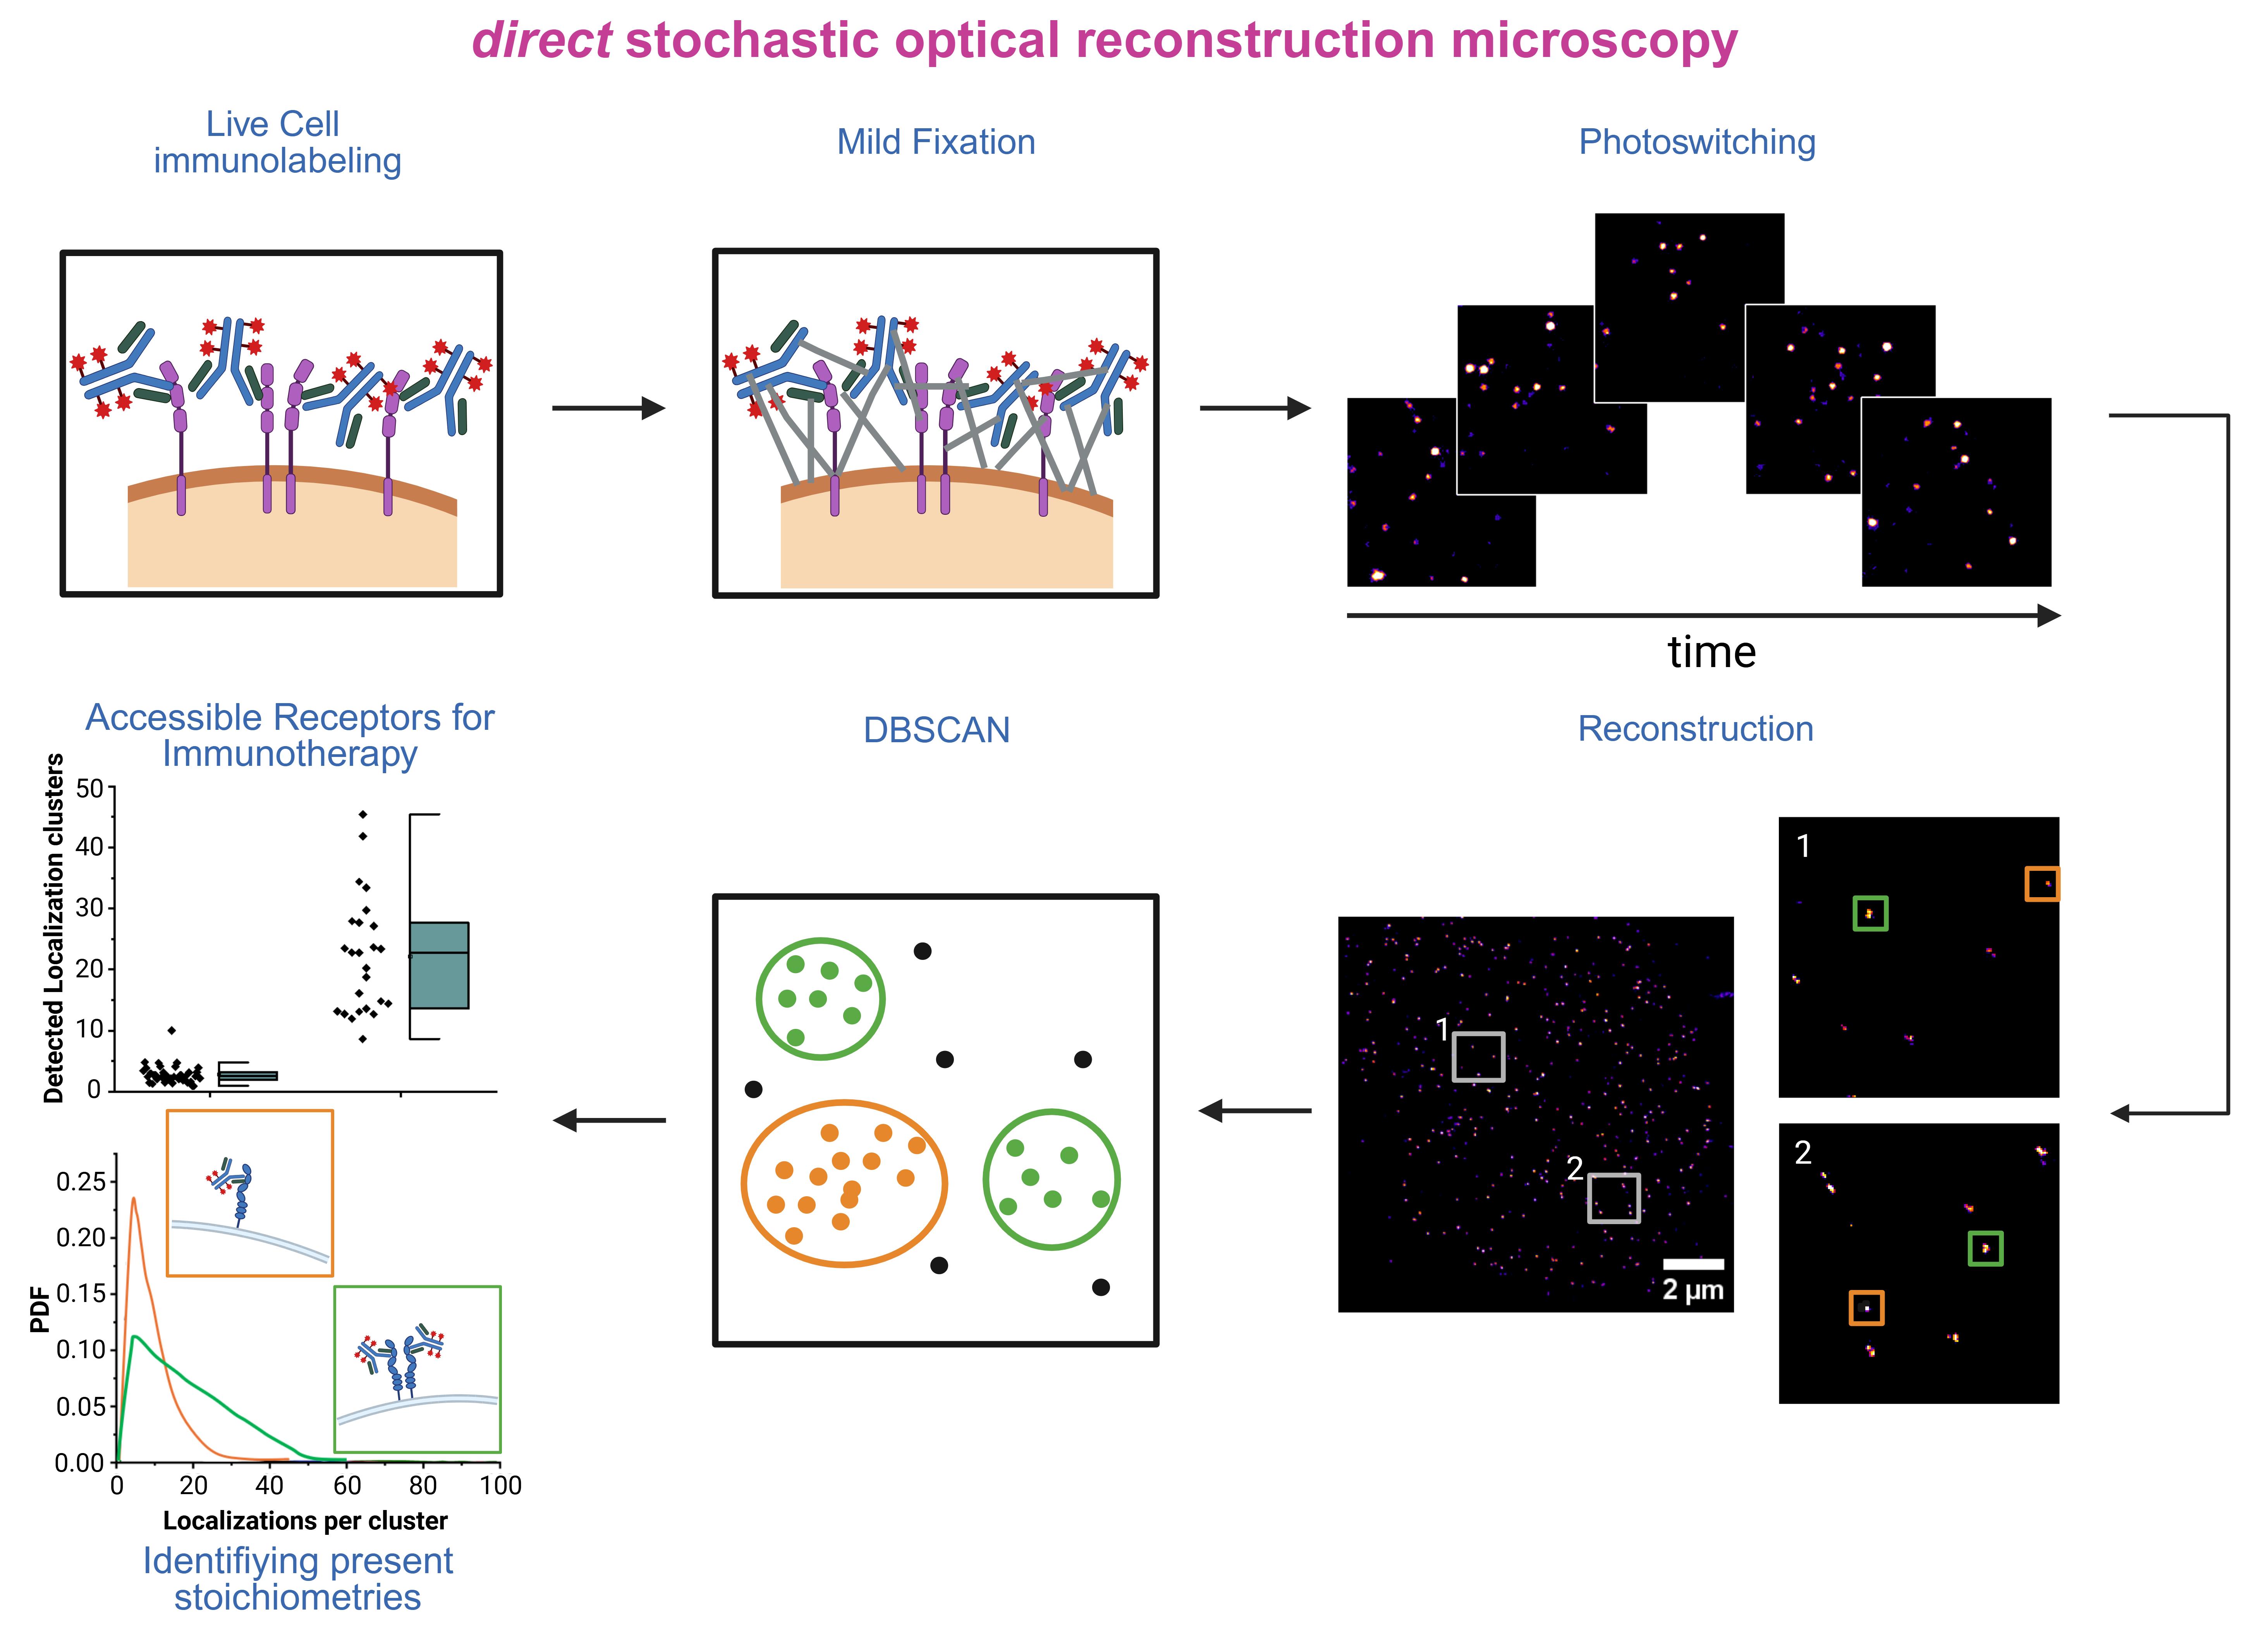
Graphical overview of the direct stochastic optical reconstruction microscopy (dSTORM)-based workflow for quantification of antibody-accessible endogenous membrane receptors. The schematic summarizes the complete workflow, including live-cell immunolabeling, fixation, imaging using dSTORM, and analysis with combined rapidSTORM and Python-based tools like LOCAN and DBSCAN.
Background
Advances in immunofluorescence microscopy, particularly super-resolution techniques, have enabled the visualization of molecular structures far below the classical diffraction limit of ~200 nm [1,2]. Membrane receptors are of special interest in such studies, as they mediate essential cellular processes such as signal transduction, adhesion, and metabolic regulation [3,4]. Because receptor malfunction contributes to a wide range of diseases, membrane proteins have become central targets in biomedical research and therapeutic development [5]. In particular, personalized immunotherapies have established membrane receptors as key targets in the treatment of autoimmune disorders and, even more prominently, for combating various malignancies, including B-cell lymphomas and multiple myeloma [6–10].
For these applications, precise quantification of antibody-addressable receptor densities on the cell membrane and their nanoscale organization is essential, as therapeutic efficacy depends not only on overall receptor quantities but also on accessibility, spatial distribution, and local stoichiometry. However, this information remains largely inaccessible to standard clinical methods. For example, flow cytometry enables rapid analysis of large cell populations but fails to detect low-expressed receptors (<1,000 per cell) and provides no spatial or organizational information [11,12]. In contrast, super-resolution microscopy techniques, especially direct stochastic optical reconstruction microscopy (dSTORM), resolve these limitations by offering nanometer precision and molecular quantification using the same antibodies as employed in therapeutic targeting [13–16]. By correlating receptor density and organization with treatment outcomes across samples, dSTORM-based imaging can serve as an early analytical indicator of antibody treatment efficacy.
Despite these promises, quantitative dSTORM of membrane proteins remains technically challenging because standardized workflows for labeling, fixation, and data interpretation are still missing. Having a validated workflow available is particularly important when using monoclonal antibodies that are identical or closely related to widely used clinical therapeutic antibodies, as such antibodies preserve the native epitope specificity of the therapeutic setting. Typical immunofluorescence protocols use secondary antibodies that can dramatically induce artificial clustering via multivalent crosslinking and thus may distort data interpretation [17]. Erroneous secondary antibody effects can be minimized by prefixation, a strategy commonly used in immunofluorescence, which often leads to epitope masking or membrane artifacts [18]. Therefore, live-cell staining with labeled primary antibodies followed by mild fixation offers the most effective compromise between structural preservation and labeling efficacy for quantitative dSTORM analysis.
Subsequent data analysis combines single-molecule localization with density-based clustering algorithms. Quantitative analysis of localization cluster properties yields information on spatial distribution, heterogeneity, and average receptor molecules per cluster (so-called stoichiometry) of membrane receptors. The analysis scheme enables estimation of receptor cluster stoichiometries [19,20] and therefore helps with detecting immunotherapy-relevant trends despite steric limitations that prevent the determination of absolute stoichiometric ratios.
This protocol provides a detailed workflow for quantifying therapy-relevant receptor densities and nanoscale receptor organization. It outlines critical steps for immunolabeling, dSTORM imaging, and data quality control and includes guidelines for DBSCAN-based analysis in the context of clinically relevant receptor assessment. The protocol offers a standardized approach for investigating antibody-accessible membrane receptors in mechanistic studies of receptor organization with applications for immunotherapy research and clinical decision support.
Materials and reagents
Biological materials
1. Cell lines or primary cells expressing the membrane proteins to analyze
Note: The protocol was tested and validated on the following cell lines: Raji, Jurkat, OPM-2, RPMI-8266, MM1.S, HEK293T, and COS-7, as well as primary B and T and multiple myeloma cells.
Reagents
1. Fetal bovine serum (FBS) (Merck, catalog number: F7524); store at -20 °C
2. Penicillin-streptomycin solution (Merck, catalog number: P4333); store at -20 °C
3. RPMI1640 (Merck, catalog number: R8758); store at 4 °C
4. 1× phosphate-buffered saline without calcium and magnesium (PBS) (Merck, catalog number: D8537); store at 4 °C
5. Therapeutic antibody (e.g., anti-CD38 antibody Daratumumab) or antibody of interest, either unconjugated or conjugated to AF647 at a degree of labeling (DOL, or molar dye:antibody ratio) between 2 and 4
6. Alexa Fluor 647 (AF647) NHS-ester (N-hydroxysuccinimide ester) (Thermo Fisher Scientific, catalog number: A20006); store at -20 °C
7. Dimethylsulfoxide (DMSO) (Thermo Fisher Scientific, catalog number: D12345); store at room temperature (RT)
8. Sodium bicarbonate (NaHCO3) (Thermo Fisher Scientific, catalog number: 11428856); store at RT
9. Cysteamine hydrochloride (MEA) (Merck, catalog number: M6500); store at 4 °C under inert gas
10. Potassium hydroxide (KOH) (Merck, catalog number: 1.05032.1000); store at RT
11. Formaldehyde (Merck, catalog number: F8775); store at RT
12. Glutaraldehyde (EMS, catalog number: 16220); store at RT
13. Poly-D-lysine (PDL) (optional) (Merck, catalog number: P6407); store at -20 °C
14. Sodium azide (NaN3) (Merck, catalog number: S2002-25G); store at RT
Solutions
1. Supplemented RPMI1640 (see Recipes)
2. Labeling buffer (see Recipes)
3. Antibody storage buffer (see Recipes)
4. Poly-D-lysine solution (see Recipes)
5. Staining solution (10 μg/mL antibody) (see Recipes)
6. Fixation solution (see Recipes)
7. dSTORM switching buffer (pH 7.4) (see Recipes)
Recipes
1. Supplemented RPMI1640
| Reagent | Final concentration | Quantity or volume |
|---|---|---|
| RPMI1640 | n/a | 500 mL |
| FBS | ~10% | 50 mL |
| Penicillin-streptomycin solution | ~1% | 5 mL |
| Total | n/a | 555 mL |
In our example, we use multiple myeloma cell lines. Depending on the cells used, the cell medium may vary.Please note that cell culture should generally be performed in a biosafety cabinet and that all cell culture solutions should be sterile. Depending on the cell type and handling conditions, penicillin-streptomycin may be added.
2. Labeling buffer
| Reagent | Final concentration | Quantity or volume |
|---|---|---|
| ddH2O | n/a | 20 mL |
| NaHCO3 | 200 mM | 336.04 mg |
| Total | 200 mM | 20 mL |
Dissolve 336.04 mg of NaHCO3 in 20 mL of ddH2O to get a 200 mM solution. Check if the pH is around 8.3–8.7. If not, verify the quality of the NaHCO3 and replace it if necessary. The buffer can be stored at 4 °C for several months.
3. Antibody storage buffer
| Reagent | Final concentration | Quantity or volume |
|---|---|---|
| 1× PBS | n/a | 50 mL |
| NaN3 | 0.02% | 10 mg |
| Total | 0.02% | 50 mL |
Dissolve 10 mg of NaN3 in 50 mL of 1× PBS to get a 0.02% solution. The buffer can be stored at 4 °C for several months.
4. Poly-D-lysine solution
Dissolve 5 mg of PDL in 50 mL of ddH2O.
5. Staining solution
Dilute the AF647-labeled antibody to a final concentration of 10 µg/mL in 200 µL of supplemented RPMI1640 to prepare the staining solution for one well. If multiple wells are stained, adjust the total volume accordingly.
6. Fixation solution
| Reagent | Final concentration | Quantity or volume |
|---|---|---|
| 1× PBS | n/a | 1,864 μL |
| 36%–38.5% formaldehyde solution | ~2.3% | 120 μL |
| 25% glutaraldehyde solution | 0.2% | 16 μL |
| Total | n/a | 2,000 μL |
Besides using formaldehyde as a fixative, the addition of glutaraldehyde is recommended for better immobilization and crosslinking of the proteins. The fixation solution should be prepared in a fume hood, as concentrated formaldehyde and glutaraldehyde are harmful.
7. dSTORM switching buffer (pH 7.4)
| Reagent | Final concentration | Quantity or volume |
|---|---|---|
| 1× PBS | n/a | 4,900 μL |
| MEA (5 M) | 100 mM | 100 μL |
| KOH (5 M) | n/a | 8 μL |
| Total (optional) | n/a | 5,008 μL |
First, prepare a 5 M MEA stock solution: Dilute 568.05 mg of MEA in 1 mL of 1× PBS. The MEA stock solution can be stored at -20 °C for at least 3 months. For the dSTORM switching buffer, add 100 μL of the 5 M MEA to 4,900 μL of 1× PBS to generate a 100 mM solution. Adjust the pH with ~8 μL of 5 M KOH to 7.4–7.5 at room temperature.
Note: The amount of KOH needed for pH adjustment may vary. It is crucial that the pH of the switching buffer lies within this range. Slight deviations may lead to inefficient removal of oxygen or unreliable photoswitching behavior.
Laboratory supplies
1. T25 cell-culture flasks (Sarstedt, catalog number: 83.3910.502)
2. 10 mL serological pipettes
3. 1.5 mL reaction tubes (Safe-Lock)
4. 15 mL conical tubes
5. 10 μL pipette tips
6. 200 μL pipette tips
7. 1,000 μL pipette tips
8. 8-well or 18-well imaging chamber with high precision coverslip (Cellvis, model: C8-1.5P)
9. 40 kDa Zeba spin desalting columns, 0.5 mL volume (Thermo Fisher Scientific, catalog number: A57760)
10. Cell counter (Logosbio, model: LUNA-FX7, catalog number: L70001)
Equipment
1. LAQUAtwin pH-11 pH-Meter (Horiba Europe GmbH, catalog number: 895650)
2. Centrifuge (Thermo Scientific, model: Heraeus Fresco 21)
3. Nanophotometer (Implen GmbH, Brand, catalog number: P300)
4. Custom-made dSTORM microscope based on an Olympus IX-71 inverted microscope body with TIRF illumination and a high NA oil-immersion objective (60×, NA 1.45; Olympus)
5. Water bath (37 °C) (GFL, model: 1003, catalog number: 46685)
6. CO2 incubator (Binder, model: KT053, catalog number: 9020-0311)
7. Class II biological safety cabinet (Heraeus, model: HeraSafe HS12, catalog number: 1511)
8. Pipetboy (Brand, model: accu-jet S)
9. Racks for 1.5 mL reaction tubes and for 15 and 50 mL conical tubes
10. Refrigerator
11. Box with ice
Software and datasets
1. rapidSTORM (https://stevewolter.github.io/rapidSTORM, GPL-3.0 license, free access)
2. Python 3.10, 3.11, or 3.12 (https://www.python.org, Python Software Foundation License Version 2, free access)
3. Jupyter Lab (https://github.com/jupyterlab/jupyterlab, BSD-3-Clause license, free access)
4. Locan (https://github.com/super-resolution/Locan, BSD-3-Clause license, free access)
5. napari (https://napari.org, BSD-3-Clause license, free access)
6. napari-locan (https://github.com/super-resolution/napari-locan, BSD-3-Clause license, free access)
7. OriginPro2023b (Origin2023b, https://www.originlab.com) (paid license required)
Example data and code have been deposited to GitHub: https://github.com/super-resolution/Eiring-et-al-2025-supplement (BSD-3-Clause license).
Procedure
登录/注册后免费查看全文
文章信息
稿件历史记录
提交日期: May 10, 2026
接收日期: Jun 21, 2026
在线发布日期: Jul 2, 2026
出版日期: Aug 5, 2026
版权信息
© 2026 The Author(s); This is an open access article under the CC BY license (https://creativecommons.org/licenses/by/4.0/).
如何引用
Readers should cite both the Bio-protocol article and the original research article where this protocol was used:
- Eiring, P., Doose, S., Bauer, N. and Sauer, M. (2026). direct Stochastic Optical Reconstruction Microscopy to Determine the Oligomeric State of Proteins on the Plasma Membrane and Their Accessibility for Immunotherapeutic Antibodies. Bio-protocol 16(15): e5767. DOI: 10.21769/BioProtoc.5767.
- Eiring, P., Steinhardt, M. J., Bauer, N., Vogt, C., Munawar, U., Han, S., Nerreter, T., Einsele, H., Kortüm, K. M., Doose, S., et al. (2026). Single-molecule localization microscopy reveals the molecular organization of endogenous membrane receptors. Sci Adv. 12(6): eaea2310. https://doi.org/10.1126/sciadv.aea2310

 Download Citation in RIS Format
分类
生物物理学 > 单分子技术
细胞生物学 > 细胞成像 > 超分辨率成像
生物信息学与计算生物学
您对这篇实验方案有问题吗?
在此处发布您的问题,我们将邀请本文作者来回答。同时,我们会将您的问题发布到Bio-protocol Exchange,以便寻求社区成员的帮助。
 发布问题
发布问题


