


Quantitative Analysis of Cell and Tissue Shape During Mouse Cranial Neural Tube Closure
小鼠颅部神经管闭合过程中细胞与组织形态的定量分析

发布: 2026年06月05日第16卷第11期 DOI: 10.21769/BioProtoc.5711 浏览次数: 279
评审: Komuraiah MyakalaAnonymous reviewer(s)
 PDF
PDF  Q&A
Q&A
参见作者原研究论文
The authors used this protocol in:
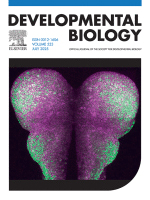
Jul 2025
Advertisement








Abstract
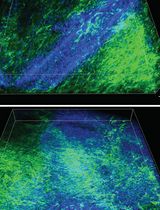
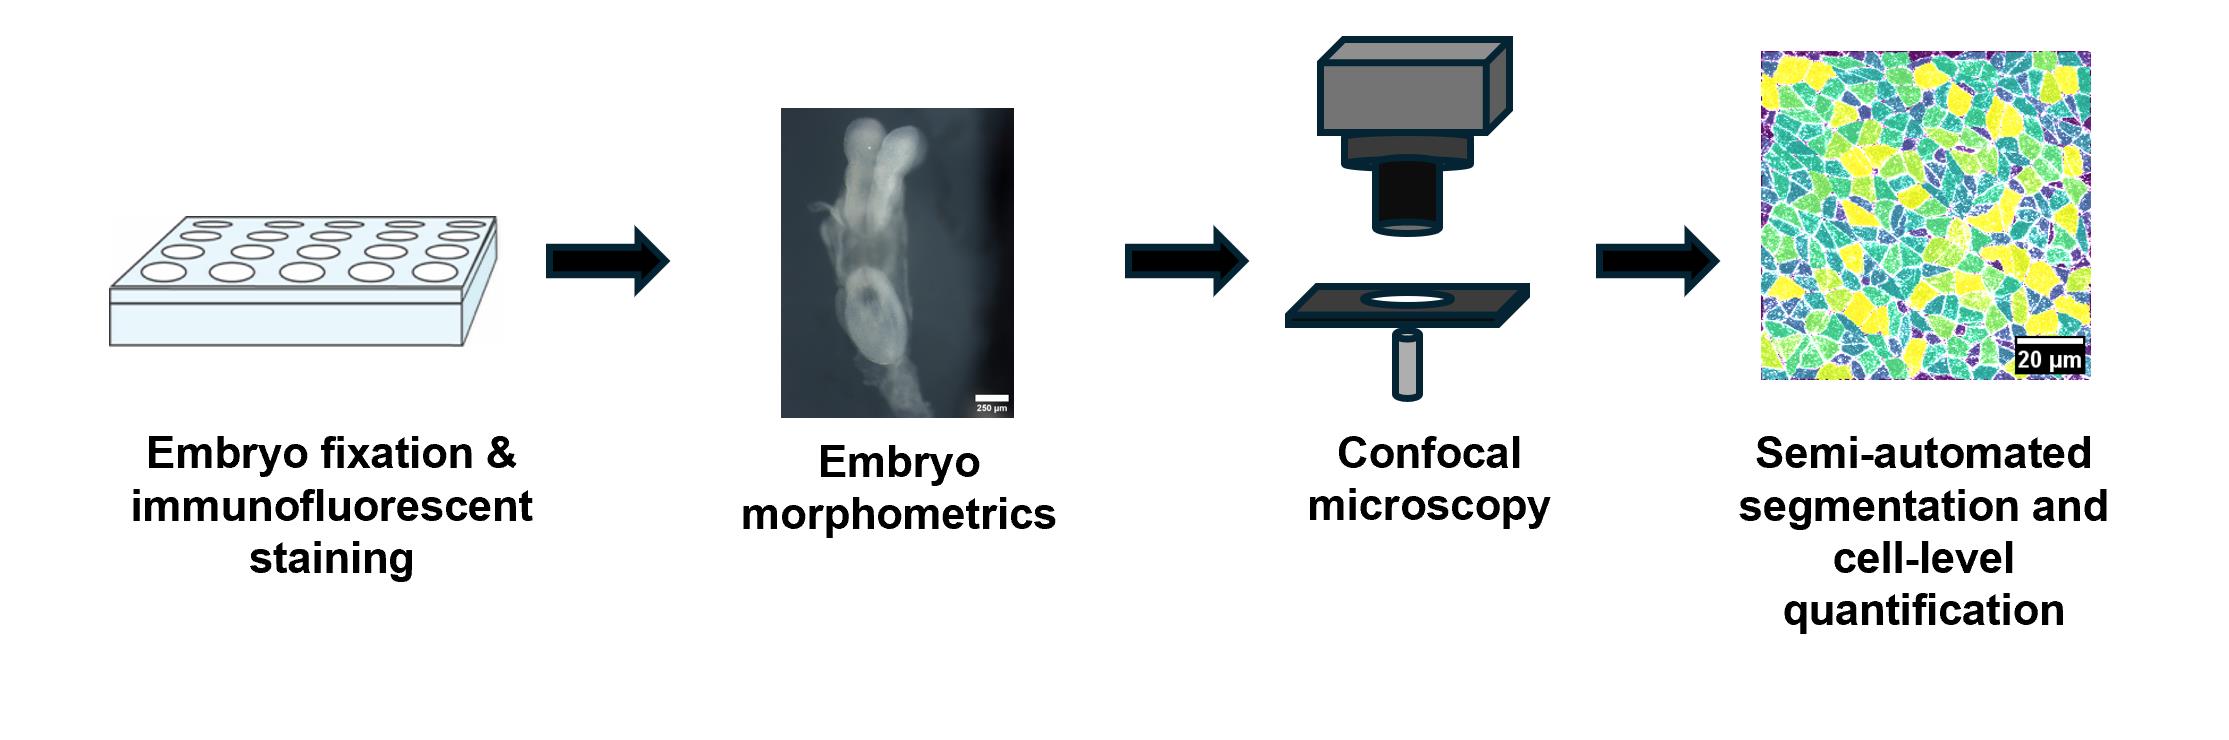
Neural tube closure is a critical process that transforms the neural plate, an open epithelial tissue, into the closed tube that serves as the structural basis of the central nervous system. Defects in this process are among the most common and severe developmental diseases in the human population, with failures in cranial closure accounting for approximately one-third of total defects. However, the cell and tissue mechanisms that drive cranial closure remain opaque relative to the better studied process of spinal closure, in large part due to the unique challenges in characterizing cranial tissues. Here, we present protocols for quantifying cell dynamics and tissue-level remodeling events that enable highly spatiotemporally resolved investigations of the causes of cranial closure defects in mouse embryos. These include brightfield morphometric approaches, fluorescent staining and confocal imaging, and quantitative pipelines to analyze these image-based datasets. At the conclusion of these approaches, users will be able to quantify several parameters of overall tissue shape in the cranial neural tissues and produce rich quantitative datasets about cell-level parameters, particularly apical cell area. These can be used to identify correlative and causative differences between mutants and control embryos. Given their flexibility, many of these approaches can be generalized to other tissue morphogenetic contexts.
Key features
• Provides flexible and quantitative pipelines for cell and tissue-scale morphometrics, which can be expanded to many morphogenetic problems.
• Presents robust mounting and imaging methods for cranial tissues.
• Allows assessing the role of cellular-scale remodeling events in deforming tissues during cranial closure and how these are changed in mutants.
Keywords: Neural tube closure (神经管闭合) Cranial tissues (颅部组织)
Mouse development (小鼠发育)
Quantitative image analysis (定量图像分析)
Segmentation (图像分割)
Cranial tissues (颅部组织)
Mouse development (小鼠发育)
Quantitative image analysis (定量图像分析)
Segmentation (图像分割)
Graphical overview
Background
Neural tube closure converts the early neuroepithelial tissues—a sheet of cells also known as the neural plate—into the closed tube that provides the structural basis of the brain and spinal cord. Defects in this process are among the most common and deleterious developmental defects in humans and occur in specific regions along the head-to-tail axis [1–4]; defects specifically in cranial closure account for approximately one-third of reported human neural tube defects [5,6]. Several cellular mechanisms have been identified as drivers of closure in spinal tissues, including apical constriction and convergent extension (reviewed in [7–11]). However, less is known about the mechanisms of cranial closure, due in part to the challenges presented by the larger size and highly curved nature of the anterior neuraxis. Recently, we and others have developed approaches to adapt to these challenges, allowing the examination of cranial closure at high spatiotemporal resolutions, leading to increased understanding of the mechanisms of closure in more posterior domains [12–20]. Given the large library of mouse mutants and the vast array of environmental toxicants that can disrupt cranial closure [21–25], these approaches will be central to understanding the cellular and tissue-level drivers of these defects.
Here, we present our workflows for quantitative analysis of cell and tissue-level properties of the cranial neural plate during closure. We have used these approaches to show the role of Sonic hedgehog and Wnt signaling in patterning apical constriction, as well as the role of Wnt signaling in setting the scale of cranial neural tissues [12-14]; similar approaches from other groups have also been used to investigate the mechanics of apical constriction, apical-basal polarization, and pseudo-stratification within cranial tissues [15,17,18,20]. While we include specific approaches to enable analysis of the large and highly curved cranial tissues, large portions of the downstream workflows we present here can also be readily adapted to the analysis of other problems in tissue morphogenesis in the mouse embryo or other species contexts. Thus, these pipelines represent generalizable tools for investigating the molecular, cellular, and tissue-level drivers that reshape tissues for function during embryonic development.
Materials and reagents
Biological materials
1. Mouse embryos at timepoints between embryonic day 7.5 (E7.5) and E8.75 (0–9 somites) with resected yolk and amniotic sacs fixed in 4% paraformaldehyde (see section A for recommended fixation conditions and embryo staging)
Reagents
1. 10× phosphate-buffered saline (PBS) (Fisher, catalog number: BP399-500); an equivalent solution can be prepared from salts, as in [26]
2. Triton X-100 (ThermoFisher, catalog number: A16046.AP)
3. 4% paraformaldehyde in PBS (e.g., Fisher, catalog number: AAJ61899AP), aliquoted in 1 mL tubes and stored at -20 °C until use or up to 1 year
4. Bovine serum albumin (BSA) (e.g., Fisher, catalog number: BP9703100)
5. Agarose, low melt (ThermoFisher, catalog number: H26417.14)
6. Rabbit anti-N-cadherin (Cell Signaling Technology, catalog number: 13116S)
7. Fluorescent conjugated anti-mouse secondary antibodies (e.g., Donkey anti-mouse Alexa488) (Invitrogen, catalog number: A32787)
8. Fluorescent conjugated phalloidin (e.g., Alexa546 conjugated phalloidin) (ThermoFisher, catalog number: A22283)
Solutions
1. 1× PBS + 0.1% Triton X-100 (PBTriton) (see Recipes)
2. Blocking solution (see Recipes)
Recipes
1. PBTriton
| Reagent | Final concentration | Quantity or volume |
|---|---|---|
| 10× PBS | 1× | 100 mL |
| Triton X-100 | 0.1% (v/v) | 1 mL |
| Deionized or reverse osmosis water | n/a | 899 mL |
| Total | 1,000 mL |
This solution is stable for up to one year at 4 °C.
2. Blocking solution
| Reagent | Final concentration | Quantity or volume |
|---|---|---|
| 10× PBS | 1× | 100 mL |
| Triton X-100 | 0.1% (v/v) | 1 mL |
| BSA | 10% (w/v) | 100 g |
| Deionized or reverse osmosis water | n/a | 899 mL |
| Total | 1,000 mL |
As an alternative, you can buy premade 10% BSA in PBS blocking solution (e.g., ThermoFisher, catalog number: 37525) and add 0.1% Triton X-100. This is stable and—with the addition of detergent—exhibits no biological contamination in our experience for up to one year at 4 °C. If biological contamination is a concern, a small amount of preservative (e.g., 0.05% sodium azide) can be added without impacting downstream use.
Make solutions in 1,000 mL glass bottles. Triton should be added after diluting the 10× PBS stock with water. At stock concentration, it is quite viscous, so cutting a small portion off a pipette tip can help in transferring. Use a magnetic stir bar and plate to thoroughly incorporate Triton into the solution (~30 min).
Laboratory supplies
1. 35 mm untreated plastic or glass Petri dishes (e.g., Fisher, catalog number: FB0875711YZ, though this can be any small Petri dish)
2. Plastic transfer pipettes (e.g., Fisher, catalog number: 13-711-7M)
Note: Ensure that the mouth of the pipette is large enough in diameter to allow the embryo to enter the pipette; if the diameter is too narrow, a pair of scissors can be used to cut off the tip.
3. 24-well untreated plastic well plates (e.g., Genesee Scientific, catalog number: 25-103) or 2 mL Epi tubes (e.g., Genesee Scientific, catalog number: 24-283) for fixing and staining embryos
4. 25 mm circular #1 or #1.5 cover glasses for imaging dishes (e.g., Fisher, catalog number: 50-948-978)
5. Square or rectangular cover glass cut or broken into <10 mm squares
6. Molykote vacuum grease (Fisher, catalog number: 14-635-5D)
7. 1 mL Luer Lock syringe (e.g., Fisher, catalog number: 14-823-30) with a 200 μL pipette tip screwed onto the Luer Lock
Equipment
1. Watchmakers forceps, ideally #55 or #5 (e.g., Fine Science Tools, catalog number: 11295-51)
2. Orbital shaker or nutator
3. Attofluor reusable aluminum imaging dishes (ThermoFisher, catalog number: A7816)
4. Dissecting stereomicroscope or macroscope equipped with brightfield camera (e.g., Zeiss Lumar, model: V12)
5. Confocal laser scanning microscope in inverted light path configuration and equipped with lasers appropriate to the fluorescent conjugates of your antibodies (e.g., Zeiss, model: LSM 980)
6. Computer for image analysis
Software and datasets
1. FIJI/ImageJ (https://fiji.sc/; NIH, and worldwide contributors, see [27,28], free to use)
2. The MorphoLibJ plugin for FIJI/ImageJ (https://github.com/ijpb/MorphoLibJ, INRA-IJBP modeling lab, see [29], free to use)
3. Cellpose (https://www.cellpose.org/, see [30], free to use); alternatively, cell-wise segmentation program (e.g., SeedWater segmenter, David Mashburn/Hutson Lab, see [31], free to use)
Note: We routinely update our FIJI/ImageJ distributions, the MorphoLibJ plugin, and the Cellpose software; to date, it has not impacted the workflow presented below. As of this writing, the versions we used were: FIJI/ImageJ- ImageJ 2 16.0/1.54p (running on Java 1.8.0_172); MorphoLibJ-1.6.5; Cellpose-4.1. For Cellpose, we recommend starting with the pretrained CP (cyto fluorescent) model and retraining it on manually corrected data from 10 embryos for any given stain to increase the accuracy of the automatic segmentation.
Procedure
登录/注册后免费查看全文
文章信息
稿件历史记录
提交日期: Feb 18, 2026
接收日期: Apr 27, 2026
在线发布日期: May 15, 2026
出版日期: Jun 5, 2026
版权信息
© 2026 The Author(s); This is an open access article under the CC BY license (https://creativecommons.org/licenses/by/4.0/).
如何引用
Borys, K. A. and Brooks, E. R. (2026). Quantitative Analysis of Cell and Tissue Shape During Mouse Cranial Neural Tube Closure. Bio-protocol 16(11): e5711. DOI: 10.21769/BioProtoc.5711.

 Download Citation in RIS Format
分类
发育生物学 > 形态建成 > 器官形成
细胞生物学 > 组织分析 > 组织成像
发育生物学 > 器官形成 > 大脑
您对这篇实验方案有问题吗?
在此处发布您的问题,我们将邀请本文作者来回答。同时,我们会将您的问题发布到Bio-protocol Exchange,以便寻求社区成员的帮助。
 发布问题
发布问题


