


Computational Quantification of Mouse Retinal Vasculature Using ImageJ
基于 ImageJ 的小鼠视网膜血管图像定量分析

发布: 2026年06月05日第16卷第11期 DOI: 10.21769/BioProtoc.5705 浏览次数: 416
评审: Nona FarbehiAbhishek VatsMatt Govendir
 PDF
PDF  Q&A
Q&A
参见作者原研究论文
The authors used this protocol in:

Feb 2026
Advertisement








Abstract
Postnatal mouse retinal vascular development is a widely used model for studying retinal vascular diseases and evaluating candidate therapies. This is particularly relevant for inherited disorders such as familial exudative vitreoretinopathy (FEVR), in which impaired vascular growth and organization are central to disease pathogenesis. Numerous approaches have been used to assess retinal vasculature in mouse flat mounts, ranging from qualitative descriptions to limited quantitative measurements of vascular growth. However, phenotypic variability across genetic models, including different models of FEVR, complicates comparisons and underscores the need for standardized, comprehensive multi-parameter analyses that are suitable for rapid and cost-effective screening studies. We describe a standardized morphometric protocol using ImageJ software to quantitatively analyze mouse retinal vasculature in a reproducible manner. The protocol begins with measurement of areas of vascular disorganization (meshes) as well as total vascular and retinal area. Two defined regions in the peripheral and midperipheral retina are then selected to quantify cell clusters, followed by image processing, binarization, and skeletonization. From these processed images, vascular density, branch number, branch length and thickness, junction number, triple points, and box-counting fractal dimension and lacunarity are quantified. Overall, this protocol provides a rapid, cost-effective, and standardized framework for quantifying retinal vascular phenotypes across diverse mouse models. By capturing multiple structural features and accommodating phenotypic variability, it is well-suited for comparative studies and therapeutic screening in retinal vascular disease.
Key features
• Computational method for mouse retina vessel image analysis for multi-parameter vascular quantification for user-selected regions of interest.
• Free open-source ImageJ-based workflow combining disorganization mapping, skeletonization, and fractal analysis for reproducible vascular network characterization.
• Optimized for rapid, cost-effective screening of structural vascular outcomes across developmental stages, disease states, and therapeutic interventions.
Keywords: Retina (视网膜) Vessels (血管)
Mice (小鼠)
Screening tool (筛选工具)
Disease models (疾病模型)
Candidate treatments (候选治疗方法)
Image analysis (图像分析)
ImageJ (ImageJ)
FIJI (FIJI)
Fractal analysis (分形分析)
Image processing (图像处理)
Morphometry (形态计量学)
Vessels (血管)
Mice (小鼠)
Screening tool (筛选工具)
Disease models (疾病模型)
Candidate treatments (候选治疗方法)
Image analysis (图像分析)
ImageJ (ImageJ)
FIJI (FIJI)
Fractal analysis (分形分析)
Image processing (图像处理)
Morphometry (形态计量学)
Graphical overview
Background
Development and maintenance of the retinal vasculature is essential for proper ocular function and vision. Disease states where retinal vascularization is abnormal are common causes of blindness [1–3] and include diabetic retinopathy [4–7], retinopathy of prematurity (ROP) [8–12], and inherited retinal vascular diseases exemplified by familial exudative vitreoretinopathy (FEVR) [9,13–29]. In humans, the retinal vasculature is initiated by vascular precursors that lay down the primary vessels that project radially from the optic disc to the retinal periphery by term gestation to form the superficial vascular plexus. From this plexus, starting around 25–26 weeks of gestation, secondary vessels penetrate the retina to form two networks, the deep capillary plexus, on either side of the inner nuclear layer [27–35].
In rodents, as in humans, a primary vascular bed first extends from the optic nerve to the peripheral retina in a single plane along the superficial retina, and the superficial plexus then sends sprouts vertically into the deeper layers of the retina that will form two intraretinal networks. Unlike humans, who exhibit fully formed retinal vessels by term birth, the primary vascular plexus in rodents develops in the first postnatal week, and the formation of the deeper layers is completed by postnatal day 14 (P14). Rodent models offer a unique opportunity to study the evolution of developmental retinal vascular disorders [29,34,36] and, as such, are widely used to study mechanisms of human retinal disease. To do so, retinal vasculature is often determined by flat mounts of retinas followed by staining, visualization, and analysis. However, there is no standard approach that can quantify relevant parameters and capture the phenotypic diversity observed in the various genetic and environmental mouse models, comparing them and assessing responses to candidate treatments. An extensive number of parameters can be individually quantified (Tables 1 and 2). We devised and tested a computational protocol for determining clinically relevant retinal vascular properties ranging from size to network complexity.
Other computational tools have been published in the past, such as Angiogenesis Analyzer, REAVER, Vessel Analysis, AngioQuant, RAVE, SIVA, and AngioTool, among others [37–43]. However, they do not have a wealth of scientific literature regarding their application, they are inflexible regarding which parameters are quantified and how, they are not customizable, they do not have an active developer community, most are not open source, which prevents full transparency regarding the underlying algorithms, they present financial barriers, and they are not available on multiple operating systems. Our protocol thus responds to all of these limitations by using ImageJ, a free and fully open-source software with an active community, vast customizability, compatibility across iOS, Windows, and Linux operating systems, and extensive use in the literature [44].
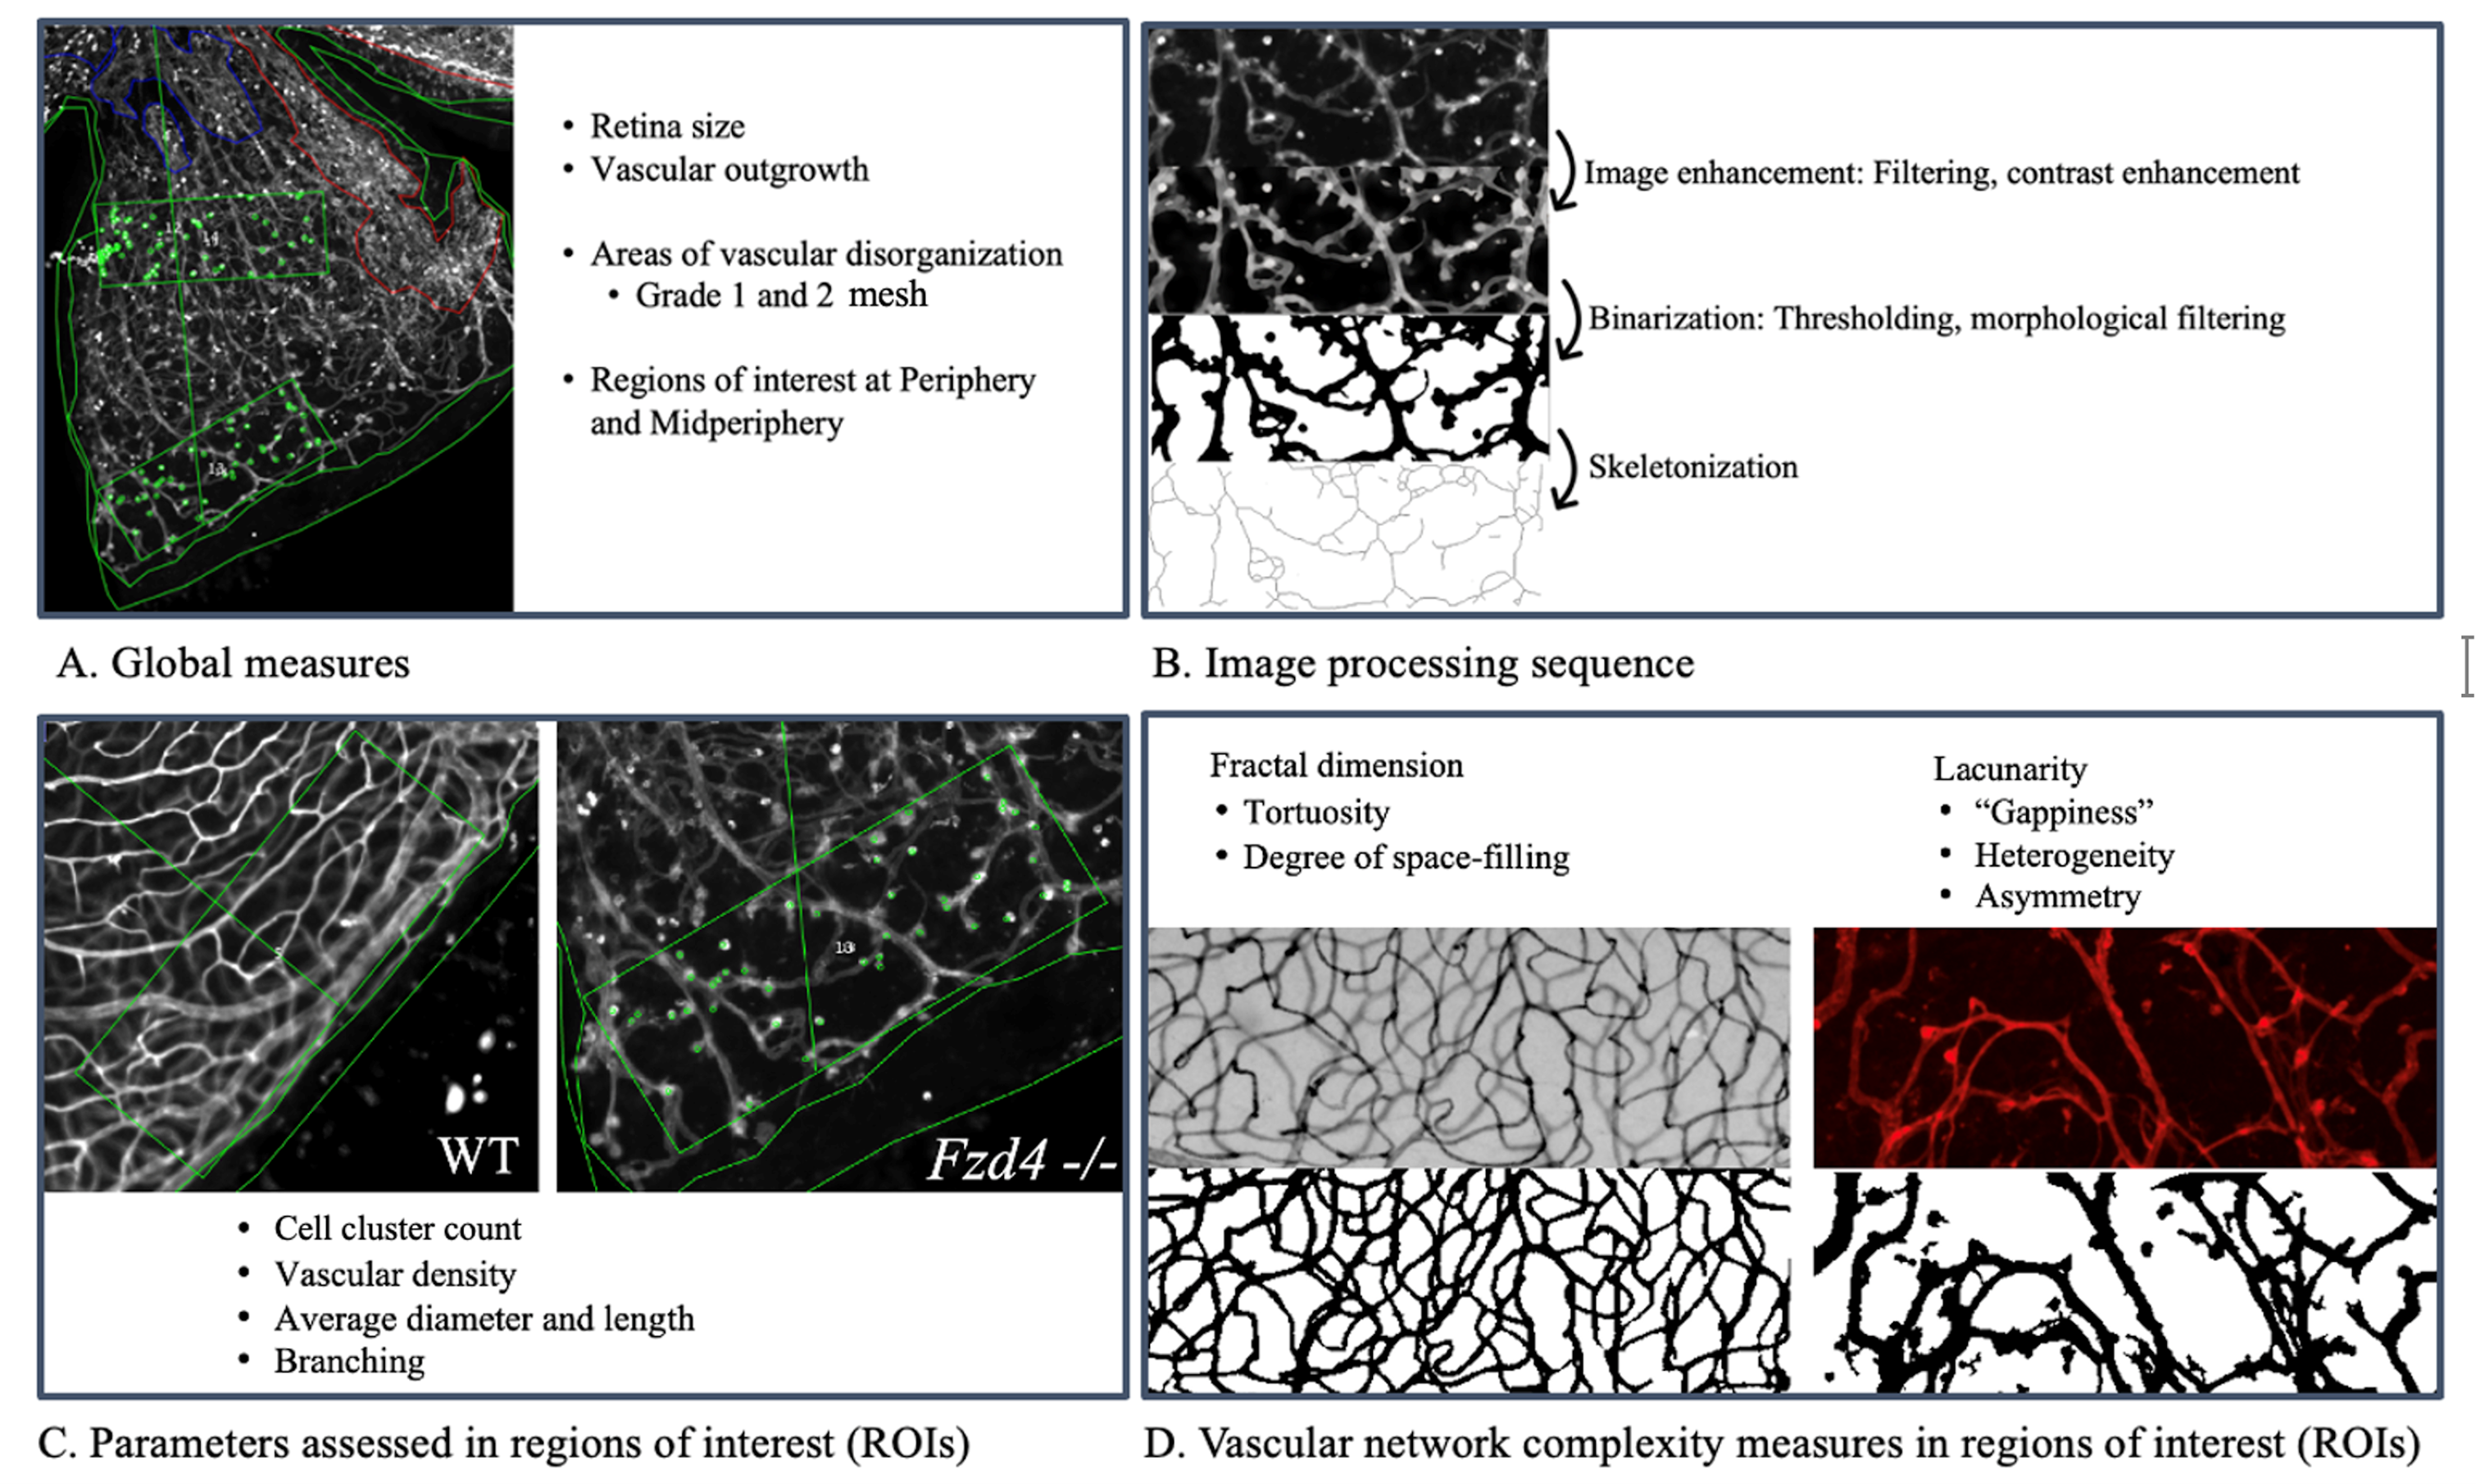
Global vascular development of the mouse retina depends on the postnatal age and body weight and is measured as percent vascularized area (PVA) of the total retinal area and vessel density (VD). VD is affected by the number, length, and diameter of the vessels. Therefore, we include average branch length (BL), average branch thickness (BT), number of branches (BN), number of junctions (JN, a point where a branch divides), and triple points (TP, junctions where there are two branches emerging from one) in regions of interest (ROIs) (Table 1). Together, these parameters can clarify whether a large VD consists of many small, interconnected capillaries or fewer but larger vessels.
Table 1. Parameters and techniques used to quantify retinal vascular networks and their relevant regions of interest (ROIs)
| Parameter | Description | Reference |
|---|---|---|
| Retinal area | Total area of the whole retina | N/A |
| Percent vascularized area | Proportion of total retinal area with vessels | N/A |
| Vascular outgrowth | Distance from optic nerve to vascular front | [36] |
| Vessel density | Area of the vessels divided by the total area of the ROI | [36,38,45] |
| Histogram integrated density | The product of the length of the fibers and the average radius | [46,47] |
| Vascular length | Total length of skeletonized vessels | [36, 38, 45–48] |
| Average branch length | Average length of all the branches in the network | [48–50] |
| Branch length density | Average branch length per area of ROI | N/A |
| Vessel length density | Total vessel length per area of ROI | [38,45–47] |
| Characteristic length | Total length of all centerlines (skeleton) divided by the number of intersections | [45–47] |
| Average vessel diameter | Average vessel diameter/thickness | [45–47] |
| Vessel diameter density | Average vessel diameter per area of ROI | N/A |
| Diameter histogram | Histogram of measured diameters with mean, mode, median, standard deviation, skewness, and kurtosis | [46,47] |
| Vessel Perimeter Index | Ratio between vessel perimeter and total area | [49–51] |
| Branchpoint density | Number of branching points in the skeletonized network per area | [36,38,45] |
| Branching angle | The first angle subtended between two daughter vessels at each branch point | [50–52] |
| Branching coefficient | Coefficient relating the diameter of the parent branch and the two daughter branches according to an equation | [51–53] |
| Vessel segment partitioning | Number of segments divided by total vessel segment lengths | [52–54] |
| Nearest neighbor distance | Average minimum distance and variability in distribution between the vessels in the region | [36,38,45] |
| Tortuosity | Measure of the degree of twisting and turning in the path of the vessel | [51–53] |
| Vessel Complexity Index | Index relating vessel perimeter to area | [51–53] |
Parameters such as VD, BL, BT, BN, JN, and TP rely on the assumption that defined vessels are present in a ROI, but this is not always the case. Retinas from a genetic mouse model of the childhood blinding disorder FEVR, the Fzd4-/- mouse model, may manifest large areas of vascular disorganization—termed meshes—with no defined vascular network. To capture these characteristics, each of these areas is outlined and measured, and its ratio to the total vascularized area is reported. We define meshes with a significant lack of defined vasculature as Grade 1 mesh, and areas with an almost complete lack of structure as Grade 2 mesh.
Table 2. Examples of fractal analysis methods
| Name | Reference |
|---|---|
| Box-counting fractal dimension (DB) | [53–55] |
| Information dimension | [53–56] |
| Correlation dimension | [53–56] |
| Local connected fractal dimension | [56–58] |
| Differential box-counting method | [59–72] |
| Extended box-counting method | [61–63] |
| Isarithm method | [62–64] |
| Blanket method | [64–66] |
| Triangular prism method | [65–67] |
| Hausdorff fractal dimension | [67–69] |
| Modified Hausdorff fractal dimension | [67–69] |
| Fourier fractal dimension | [68–71] |
The term complexity can relate to branching, vessel overlap, tortuosity, density, symmetry, space-filling, and the heterogeneity of any of these factors. Quantifying this complexity in our vessel networks can be addressed by applying fractal geometry (Table 2). In combination with the other quantified structural characteristics of this vessel network (e.g., length, thickness, and number), we can glean information on both the development of vessels at the local level and how that impacts the network’s global complexity and vice versa. Each approach complements the other, as they capture information from different perspectives. Fractal analysis has been used to investigate retinal vascular development in many circumstances. The box-counting fractal dimension (DB) method is the most widely utilized to analyze retinal vasculature complexity [53,60,68], thus being selected for our protocol. Box-counting fractal dimension quantifies how complex and space-filling a branching pattern is by counting how many grid boxes contain vessel segments as the box size decreases. In the context of the retinal vasculature, this measure reflects the geometric complexity and curvature of the vessel network.
Although DB is a powerful tool, it can be nonspecific, as different patterns with similar DB can remain qualitatively very different [71]. To mitigate this, lacunarity used in conjunction with fractal dimension characterizes the heterogeneity and symmetry of gaps surrounding an object and together form a more specific impression of the vascular network [71]. Lacunarity measures how evenly or unevenly a pattern fills space, capturing the size and variability of gaps within a structure. Low lacunarity indicates a uniform, tightly packed network with consistent spacing between elements, whereas high lacunarity reflects larger, more irregular gaps and a less cohesive pattern.
In this publication, we report the development of a standardized computational approach that captures and measures structural and pathological features in a mouse retina flat mount in a rapid and reproducible fashion in ImageJ tables, using the software and plugins in Table 3. More specifically, it quantifies the total retina size (μm2), the percent vascularized area (%), and the proportion of area of significant vascular disorganization (meshes) that have no definable network structure (%). Then, in chosen regions of interest at the periphery and midperiphery, we calculate VD (ratio), BL (μm), BT (μm), BN, JN, TP, number of cell clusters (CCs, microaneurysm-like structures), DB (unitless), and lacunarity (Λ unitless).
Equipment
1. Laptop or desktop computer with the required software installed. We used a MacBook Pro (2.4 GHz Quad-Core Intel Core i5/ 8 GB 2133 MHz LPDDR3/macOS 15.7.4 24G517).
Minimum requirements to download the latest versions of FIJI are:
a. Windows 10 or later, x86–64 or arm64
b. macOS 11 “Big Sur” or later, Apple Silicon or Intel
c. Ubuntu 22.04 LTS or later, x86-64 or arm64
d. Any other system with a Java 21 runtime, except plugins using native libraries (e.g., 3D Viewer)
Software and datasets
Table 3. Software and plugins used in the FIJI retinal vasculature analysis protocol
Procedure
登录/注册后免费查看全文
文章信息
稿件历史记录
提交日期: Feb 12, 2026
接收日期: Apr 17, 2026
在线发布日期: May 12, 2026
出版日期: Jun 5, 2026
版权信息
© 2026 The Author(s); This is an open access article under the CC BY license (https://creativecommons.org/licenses/by/4.0/).
如何引用
Readers should cite both the Bio-protocol article and the original research article where this protocol was used:
- Nader, M., Feridooni, H. A., Tavasoli, M., Van Der Ende, S., McMaster, C. R. and Robitaille, J. M. (2026). Computational Quantification of Mouse Retinal Vasculature Using ImageJ. Bio-protocol 16(11): e5705. DOI: 10.21769/BioProtoc.5705.
- Feridooni, H. A., Fody, R., Tavasoli, M., Alkandari, M., van der Ende, S., Nader, M., Robitaille, J. M. and McMaster, C. R. (2026). Sphingosine-1-phosphate receptor 2 inhibition ameliorates familial exudative vitreoretinopathy models. J Biol Chem. 302(2): 111107. https://doi.org/10.1016/j.jbc.2025.111107

 Download Citation in RIS Format
分类
生物信息学与计算生物学
神经科学 > 感觉和运动系统 > 视网膜
细胞生物学 > 组织分析 > 组织形态学
您对这篇实验方案有问题吗?
在此处发布您的问题,我们将邀请本文作者来回答。同时,我们会将您的问题发布到Bio-protocol Exchange,以便寻求社区成员的帮助。
 发布问题
发布问题


