


Using Single-Particle Fluorescence Microscopy to Quantify Substrate Binding of Peptidoglycan-Modification Enzymes
利用单颗粒荧光显微成像定量分析肽聚糖修饰酶的底物结合

发布: 2026年05月20日第16卷第10期 DOI: 10.21769/BioProtoc.5696 浏览次数: 543
评审: Alba BlesaDevika AndhareAnonymous reviewer(s)
 PDF
PDF  Q&A
Q&A
参见作者原研究论文
The authors used this protocol in:

Sep 2023
Advertisement







Abstract
Peptidoglycan (PG), a network of glycan strands crosslinked by short peptides, is an essential and bacterial-specific structure that determines cell shape and protects cells from lysis. Understanding how bacteria assemble, maintain, and modify their PG not only addresses fundamental questions in cell biology but also provides a basis for developing strategies to treat bacterial infections. Although several in vitro methods, such as zymography, Remazol Brilliant Blue (RBB) assay, and LC-MS analyses, are available to quantify the activities of PG-modification enzymes, these approaches are not readily applicable in vivo. Here, we describe a single-particle tracking photo-activated localization microscopy (sptPALM)-based method to quantify the binding of enzymes to PG in vivo, which serves as a proxy for their enzymatic activities. Because the PG meshwork is relatively immobile, fluorescently tagged enzymes that transiently or stably bind it exhibit reduced mobility, reflected by lower diffusion coefficients. This approach provides sensitive, quantitative, and real-time insights into enzyme behavior in vivo under diverse physiological conditions or genetic backgrounds. The protocol is particularly valuable for investigating PG-modification enzymes that are essential or functionally redundant, which are often difficult to analyze using traditional genetic methods.
Key features
• Builds upon the method developed by Fu et al. [1] for single-particle tracking with high spatial and temporal resolution.
• Streamlined imaging and data processing workflow.
• Automatic analysis on large datasets with minimum human bias.
• Reveals the regulatory relationship between PG-modification enzymes, bypassing complex genetic experiments.
Keywords: Peptidoglycan (肽聚糖) Peptidoglycan synthases (肽聚糖合成酶)
Peptidoglycan hydrolases (肽聚糖水解酶)
Single particles (单颗粒)
Fluorescence microscopy (荧光显微镜)
Single-particle tracking (单颗粒追踪)
sptPALM (sptPALM)
Peptidoglycan synthases (肽聚糖合成酶)
Peptidoglycan hydrolases (肽聚糖水解酶)
Single particles (单颗粒)
Fluorescence microscopy (荧光显微镜)
Single-particle tracking (单颗粒追踪)
sptPALM (sptPALM)
Graphical overview
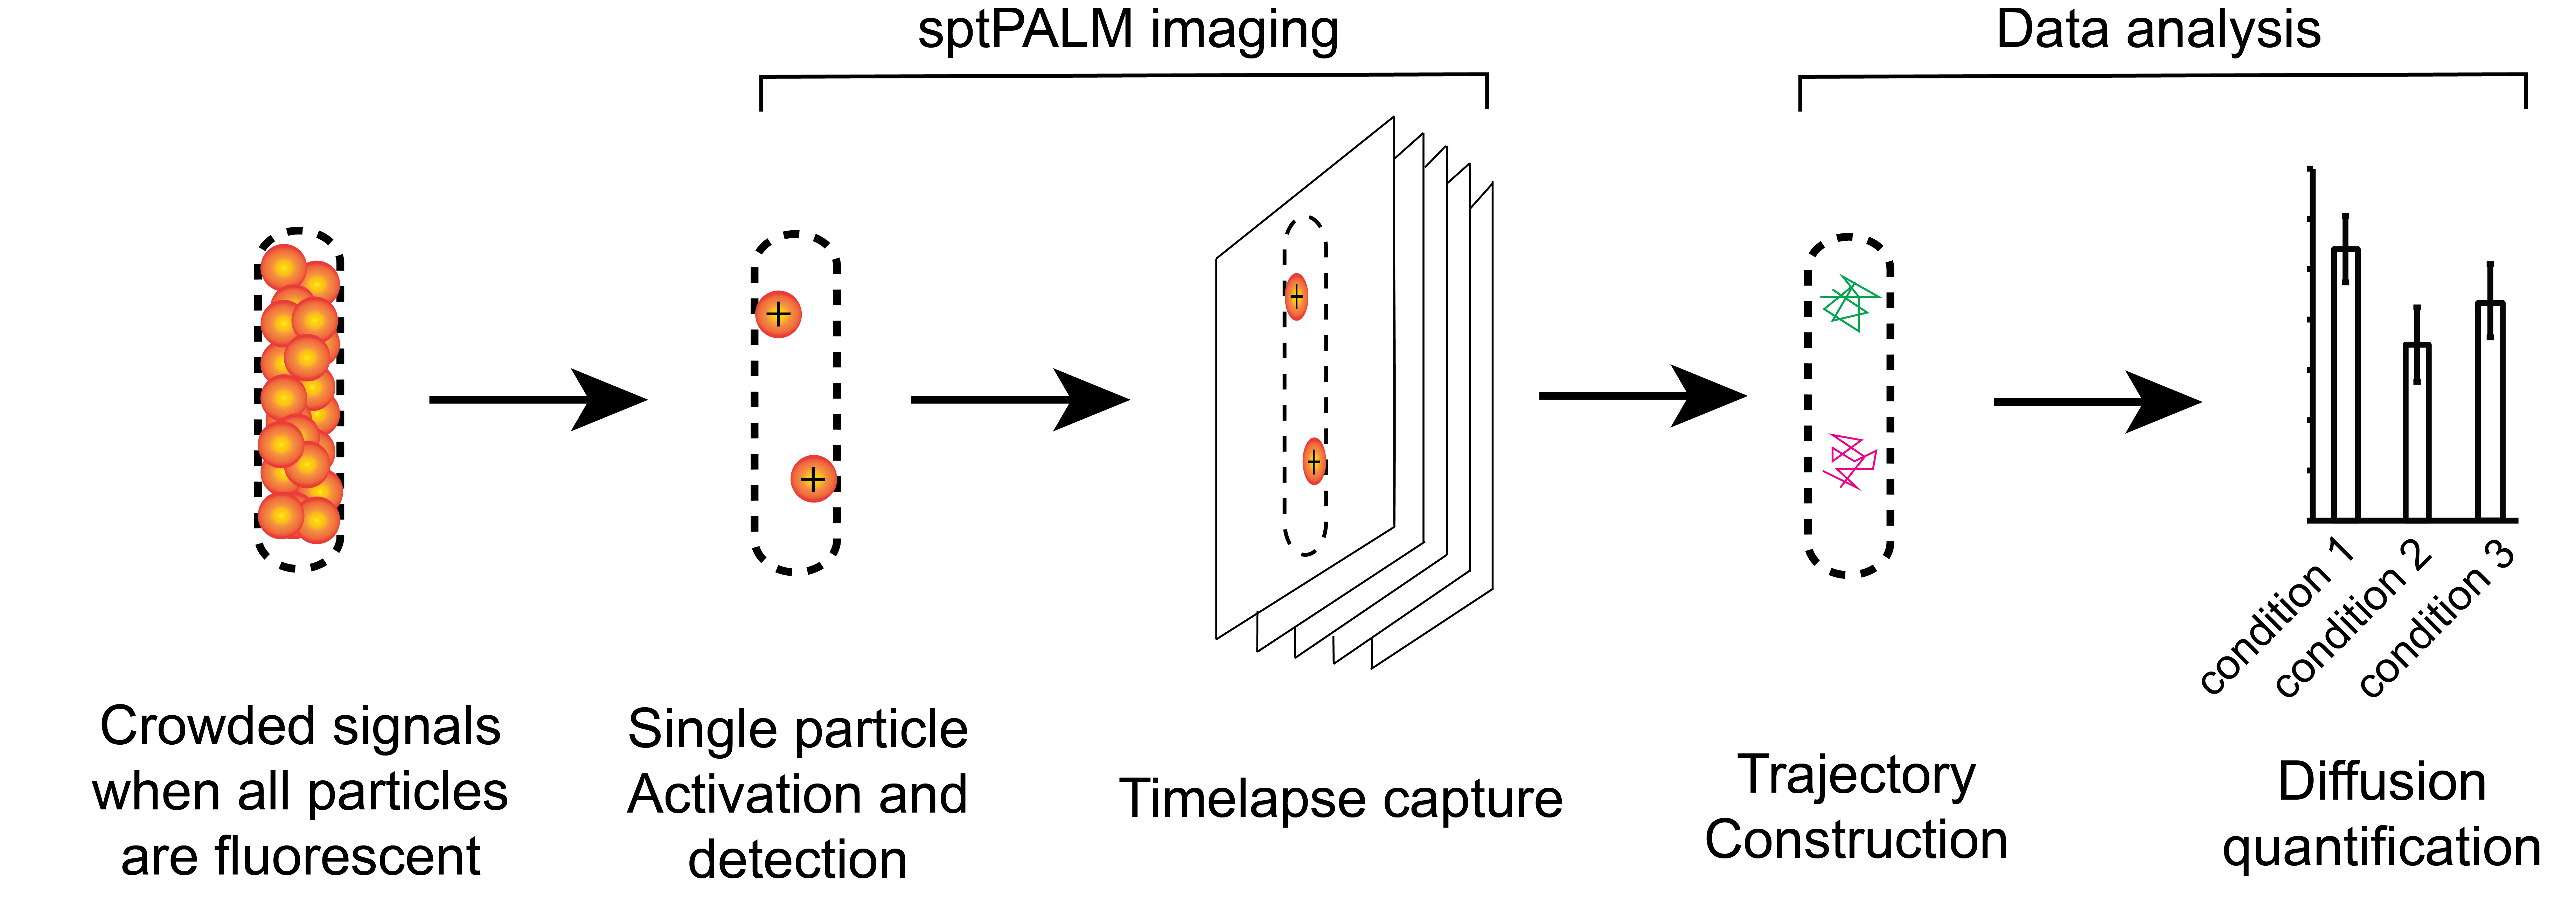
Overview of the imaging and data analysis procedures
Background
The peptidoglycan (PG) cell wall is a crosslinked polymer network that surrounds most bacterial cells, defines their morphology, and protects them against osmotic lysis. This polymer is made of muropeptide units, which consist of two amino sugars, N-acetylglucosamine (NAG) and N-acetylmuramic acid (NAM), with a peptide side chain that contains unique D-amino acids attached to the latter. The sugar subunits are polymerized into glycan strands by glycosyltransferases (GTases) via β-1,4 glycosidic bonds, and adjacent glycan strands are crosslinked by transpeptidases (TPases) through their peptide moieties [5]. While class A penicillin-binding proteins (aPBPs) contain both GTase and TPase domains, SEDS (shape, elongation, division, and sporulation) proteins are monofunctional GTases that work in concert with monofunctional TPases called class B PBPs (bPBPs) [6]. Additionally, many bacteria utilize LD-transpeptidases (LDTs), which are structurally distinct from PBP transpeptidase domains and facilitate different crosslinking reactions [7].
Because the entire PG layer of each bacterial cell is a covalently closed single molecule, PG expansion, e.g., the incorporation of new glycan strands, requires hydrolases, also known as autolysins, to generate openings in the existing PG network. Endopeptidases (EPs) are particularly important as “space-making” enzymes that cleave peptide crosslinks and thus allow such insertion [8–15]. Bacteria constantly remodel their PG using large repertoires of autolysins. Each bond in the PG matrix has a specific type of enzyme with the ability to break it: besides EPs, lytic transglycosylases (LTGs) break glycan strands, while amidases and carboxypeptidases (CPs) remove amino acids from different termini of peptides [10,15–19].
Quantitative analysis of the activities of PG-modification enzymes has been a major challenge in the field. PG labeling using fluorescence-conjugated D-amino acids [20,21], carbohydrates [22,23], and antibiotics [24,25] allows in situ probing of newly synthesized PG in live cells. In addition, high-performance liquid chromatography (HPLC), ultrahigh-performance liquid chromatography (UPLC), and mass spectrometry on purified, muramidase-digested PG sacculi produce high-resolution muropeptide profiles that provide quantitative architectural information, including muropeptide composition, glycan chain length, and the crosslinks between them [3,26,27]. However, rather than monitoring individual enzymatic activities, both methods reflect the combined activities of many PG-modification enzymes.
Many in vitro assays have been developed to study individual enzymes. For instance, purified lipid II, a PG precursor, after being labeled with fluorescent dyes or radioactive isotopes, can be used to quantify the activities of purified GTases [6,28]. Zymogram and Remazol Brilliant Blue (RBB) assays are widely used on autolysins. Zymogram runs denatured autolysins in SDS-polyacrylamide gels supplemented with PG as a substrate. After electrophoresis, the gel is transferred to a renaturation solution. The refolded autolysins then degrade PG, and their activities can be reflected by the clearing zones on gels [29]. In contrast, the RBB assay quantifies the release of RBB, a dye that covalently attaches to PG on its sugar moieties. Autolysins can degrade the insoluble, RBB-modified PG and thus release the dye into solution, whose absorbance can be readily measured using a spectrophotometer [2,3,30,31]. However, as most PG-modification enzymes reside in the membrane and periplasm, these techniques face significant hurdles in protein expression, solubilization, and refolding. Moreover, the techniques for lipid II purification and labeling are not available for most microbiology laboratories.
Single-particle microscopy is a powerful imaging technique in bacterial cell biology. Due to the diffraction of light, each fluorophore, no matter how small, generates a signal that covers an area of 300–500 nm in diameter [32]. Because conventional fluorescence microscopy detects all fluorophores in the sample, hundreds to thousands of such signals inside a small bacterial cell (typically ~1 μm wide) create a blurry picture, where the dynamics of single protein particles cannot be resolved [33]. Using single-particle tracking photo-activated localization microscopy (sptPALM), only a few fluorophores are randomly switched on in each cell, enabling accurate determination of their locations. Capturing time-lapse images, we can track the movement of individual particles with high spatial and temporal resolution (~160 nm and up to 10-ms, e.g., 100 frames/s) and quantify their distribution in subcellular regions [1–4,34–36]. Here, we refer to isolated, single fluorescent spots under sptPALM as “single particles” rather than “single molecules” because they could represent protein complexes [37,38].
Here, we describe a sptPALM-based method to quantify the binding of enzymes to PG in vivo, which serves as a proxy for their enzymatic activities. Biochemical reactions on the PG scaffold are unique due to the stark size difference between the enzymes and their substrates. While enzyme particles are in nanometer scales, their substrates, the PG sacculi, span several micrometers. Under the microscope, PG remains stationary, but PG-related enzymes are free to move. When diffusive enzymes bind to PG, their mobility decreases. Consequently, increased enzyme binding to PG under specific growth or genetic conditions leads to a decrease in its diffusion coefficient. Using this method, the diffusion of many PG-modification enzyme particles, including both synthases and autolysins, has been documented [3,4,39,40]. In these studies, the diffusion coefficient (D) was used to quantify particle mobility, where high D values indicate high particle mobility and thus reflect low PG binding. However, the negative correlation between D and PG binding is not necessarily linear.
Much of our knowledge on PG assembly and modification is based on mutant phenotypes. However, many SEDS and their partner bPBPs are essential and thus undeletable. In addition, aPBPs and PG hydrolases are notoriously redundant in most bacteria, where strains lacking single or several of these enzymes rarely display significant phenotypes (B. subtilis remains viable when 41 of the 42 PG hydrolases are absent) [10,17,41–44]. Phenotypes, if they exist, are unreliable for assigning functions to PG-related enzymes, because even when two enzymes have distinct functions, their null mutants could produce similar phenotypes [4,16]. This method captures the diffusion of hundreds to thousands of protein particles, enabling us to elucidate how PG-modification enzymes regulate each other in live cells, even in the absence of pronounced “macro-phenotypes” in morphology, growth, or division. For this reason, this protocol is especially useful for studying the PG-modification enzymes that are either redundant (such as some aPBPs and most autolysins) or essential (such as the Rod components).
Materials and reagents
Bacterial strains
As single-particle imaging has been successfully applied to many bacteria, this protocol is adaptable to all bacteria that express photo-activatable fluorophore-labeled proteins. Here, we use the Gram-negative bacterium Myxococcus xanthus to demonstrate the protocol. M. xanthus is a model organism for studying many functions in bacteria, including PG dynamics [45,46]. The M. xanthus BN312 strain expresses photo-activatable mCherry (PAmCherry)-labeled DacB using the native dacB locus and promoter [4]. BN312 was constructed in the wild-type Myxococcus xanthus DZ2 [46–48] background. Methods describing how to generate stable strains of M. xanthus expressing PAmCherry have been published elsewhere [1–4,49]. Both DZ2 and BN312 are available upon request. This protocol uses PAmCherry as an example for sptPALM. Numerous other photo-activatable proteins and synthetic dyes are available. Many equipment and chemical suppliers provide extensive guides on their biological and optical properties, such as https://www.leica-microsystems.com/science-lab/life-science/photoactivatable-photoconvertible-and-photoswitchable-fluorescent-proteins/ and https://app.fluorofinder.com/dyes.
Reagents
1. Agarose RATM (VWR Life Science, CAS: 9012-36-6)
2. MOPS (Thermo Fisher Scientific, CAS: 1132-61-2)
3. KOH (Thermo Fisher Scientific, CAS: 1310-58-3)
4. BactoTM Casitone (Thermo Fisher Scientific, CAS: 9000-71-9)
5. BD yeast extract (Sigma-Aldrich, CAS: 8013-01-2)
6. MgSO4 (Sigma-Aldrich, CAS: 7487-88-09)
7. Antibiotics
Note: Many antibiotics target peptidoglycan enzymes, such as moenomycin, which inhibits the GTase activities of the aPBPs, and mecillinam, which blocks the TPase activity of the Rod system. Choose antibiotics based on the targets and determine their working concentrations based on phenotypes and minimum inhibitory concentrations (MICs). In this protocol, we use moenomycin at 4 μg/mL, which does not stop M. xanthus growth but turns rod-shaped cells into spheres [4].
Solutions
1. 0.8% agarose gel (see Recipes)
2. 1 M MOPS pH 7.6 (see Recipes)
3. 0.8 M MgSO4 (see Recipes)
4. CYE medium (See Recipes)
Recipes
1. 0.8% agarose gel (w/v)
| Reagent | Final concentration | Quantity or volume |
|---|---|---|
| Agarose | 0.8% (w/v) | 8.0 g |
| 1 M MOPS pH 7.6 | 10 mM | 10 mL |
| ddH2O | n/a | 980 mL |
| Total | n/a | 1 L |
Note: Agarose concentration can be modified according to the specific requirements of each organism. However, a concentration lower than 0.4% makes the agarose pad unstable. The buffer system, its concentration, and pH can be modified according to the specific requirements of each organism. Autoclave to sterilize, aliquot to 15 mL centrifuge tubes, tighten the tube caps, and store at room temperature. In our experience, such premade agarose gel remains stable for 3 months.
2. 1 M MOPS pH 7.6
| Reagent | Final concentration | Quantity or volume |
|---|---|---|
| MOPS powder | 1 M | 209.27 g |
| ddH2O | n/a | 980 mL |
| Total | n/a | 1 L |
Note: First, dissolve 209.27 g of MOPS powder into 600–800 mL of ddH2O. The initial pH is about 5. Adjust pH with KOH. Begin with pellets or a 10 N KOH stock solution and then slow down when the pH is approaching 7.6. After pH is adjusted, adjust the volume to 1 L by adding ddH2O. A cylinder is required. Filtrate the final solution to sterilize. Wrap the bottle with foil and store it at 4 °C. MOPS solution is sensitive to light. It will turn yellow when exposed to light.
3. 0.8 M MgSO4
| Reagent | Final concentration | Quantity or volume |
|---|---|---|
| MgSO4 powder | 0.8 M | 96.3 g |
| ddH2O | n/a | 980 mL |
| Total | n/a | 1 L |
Note: After the MgSO4 powder is dissolved in ddH2O, adjust the volume to 1L. Autoclave immediately after preparation.
4. CYE medium
| Reagent | Final concentration | Quantity or volume |
|---|---|---|
| BD Casitone | 1% (w/v) | 10 g |
| BD yeast extract | 0.5% (w/v) | 5 g |
| 1 M MOPS pH 7.6 | 10 mM | 10 mL |
| 0.8 M MgSO4 | 8 mM | 10 mL |
| ddH2O | n/a | 390 mL |
| Total | n/a | 1 L |
Note: Autoclave immediately after preparation. CYE medium was used in this protocol to grow M. xanthus. For other organisms, choose appropriate media according to their growth requirements.
Laboratory supplies
1. 15 mL centrifuge tubes, NuncTM conical sterile polypropylene centrifuge tubes (Thermo Fisher Scientific, catalog number: 339650)
2. FisherbrandTM SelectfrostTM microscope slides (Fisher Scientific, catalog number: 1255001)
3. VMR micro cover glasses, square, no. 1 1/2 (VWR, catalog number: 48366-249)
4. Pipettes (20-μL, 200-μL, and 1,000-μL) and tips
Equipment
1. Eppendorf BioPhotometer model #6131 (or comparable brands and models)
2. VWR Incubator Model #1920 (or comparable brands and models)
3. Inverted Nikon Eclipse-TiTM microscope with a 100× 1.49 NA TIRF objective
Note: PAmCherry is activated using a 405-nm laser (0.3 kW/cm2), and excited and imaged using a 561-nm laser (0.2 kW/cm2).
4. Hamamatsu ImagEM X2TM EM-CCD C9100-23B or Andor iXon UltraTM 897 EMCCD camera
Note: These experimental procedures, though demonstrated on the above equipment, are adaptable to a wide range of microscopy and camera configurations. A total internal reflection fluorescence (TIRF) objective is required for reducing background noise in single-particle microscopy. Under the TIRF setup, only a section of ~200 nm of the cells close to the coverslip is illuminated, which includes the space where PG-modification enzymes reside. When paired with a 100× 1.49 NA TIRF objective, both cameras provide an effective pixel size of 160 nm. Pixel sizes must be entered into the MATLAB data analysis script in accordance with the hardware utilized.
Software and datasets
1. We developed a MATLAB-based script for single-particle data analysis (https://github.com/NanLabMyxo/Rod_shape_paper) under the “/Matlab 1 population” folder [1,4].
2. MATLAB R2018b (The MathWorks, Inc. https://www.mathworks.com/help/install/ug/install-products-with-internet-connection.html)
3. Optimization Toolbox (https://www.mathworks.com/products/optimization.html)
4. NIS-Elements AR 5.30.02 64-bit (https://www.microscope.healthcare.nikon.com/products/software/nis-elements/software-resources)
Note: Single-particle imaging, although demonstrated using NIS-ElementsTM, is adaptable to a wide range of software.
Procedure
登录/注册后免费查看全文
文章信息
稿件历史记录
提交日期: Mar 10, 2026
接收日期: Apr 22, 2026
在线发布日期: May 9, 2026
出版日期: May 20, 2026
版权信息
© 2026 The Author(s); This is an open access article under the CC BY license (https://creativecommons.org/licenses/by/4.0/).
如何引用
Ramírez Carbó, C. A. and Nan, B. (2026). Using Single-Particle Fluorescence Microscopy to Quantify Substrate Binding of Peptidoglycan-Modification Enzymes. Bio-protocol 16(10): e5696. DOI: 10.21769/BioProtoc.5696.

 Download Citation in RIS Format
分类
生物物理学 > 显微技术 > 单分子定位显微技术
生物化学 > 糖类 > 肽聚糖
生物信息学与计算生物学
您对这篇实验方案有问题吗?
在此处发布您的问题,我们将邀请本文作者来回答。同时,我们会将您的问题发布到Bio-protocol Exchange,以便寻求社区成员的帮助。
 发布问题
发布问题


