


Kinetic Determination of Cytochrome b6f Activity In Vitro
体外动力学测定细胞色素 b6f 复合体活性

发布: 2026年05月05日第16卷第9期 DOI: 10.21769/BioProtoc.5677 浏览次数: 498
评审: Anonymous reviewer(s)
 PDF
PDF  Q&A
Q&A
参见作者原研究论文
The authors used this protocol in:
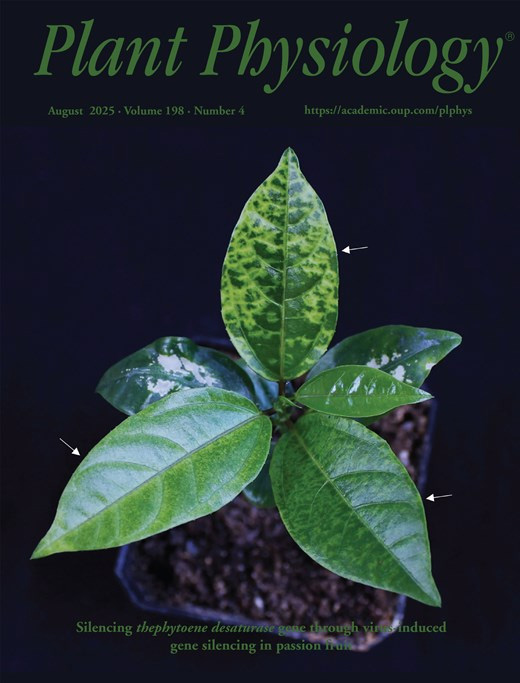
Aug 2025
Advertisement









Abstract
While traditional kinetic studies of the cytochrome b6f complex have frequently relied on measurements within the complex environment of intact leaves or whole-organism systems, such approaches can be limited by overlapping signals and physiological variables. This protocol advances existing frameworks by introducing a streamlined, multi-wavelength spectroscopic approach utilizing a reconstituted in vitro system to elucidate the inter-complex electron transfer kinetics between photosystem I and cytochrome b6f. Utilizing the JTS-150 pulsed spectrometer, supplied with a Smart Lamp, we monitored the redox transitions of P700+ and Cytf by simultaneously measuring the absorbance changes of our isolated complexes system in six different wavelengths (546, 554, 563, 574, 705, and 740 nm). Kinetic analysis was divided into two phases: laser-induced flash kinetics and steady-state actinic induction. We resolved the second-order re-reduction of P700+ by plastocyanin, accounting for detector saturation constraints with a 2 ms post-flash delay. Steady-state measurements under actinic light revealed complex Cytf turnover, characterized by a double-exponential decay. Furthermore, dark relaxation kinetics were used to quantify ferredoxin-mediated re-reduction of the cytochrome pool. By allowing the incorporation of specific regulatory and inhibitory factors, this methodology sets the ground for the deconvolution of competing electron pathways. It can therefore be used as a robust framework for assessing the mechanism of regulatory processes on photosynthetic flux.
Key features
• Activity measurement of isolated photosynthetic complexes.
• Assessing interactions between complexes in the photosynthetic apparatus.
Keywords: Cytochrome b6f (细胞色素 b6f) Plastocyanin (质体蓝素)
Photosystem I (光系统 I)
Joliot-type spectrophotometer (Joliot 型分光光度计)
Photosynthesis (光合作用)
Electron-flow (电子流)
Plastocyanin (质体蓝素)
Photosystem I (光系统 I)
Joliot-type spectrophotometer (Joliot 型分光光度计)
Photosynthesis (光合作用)
Electron-flow (电子流)
Graphical overview
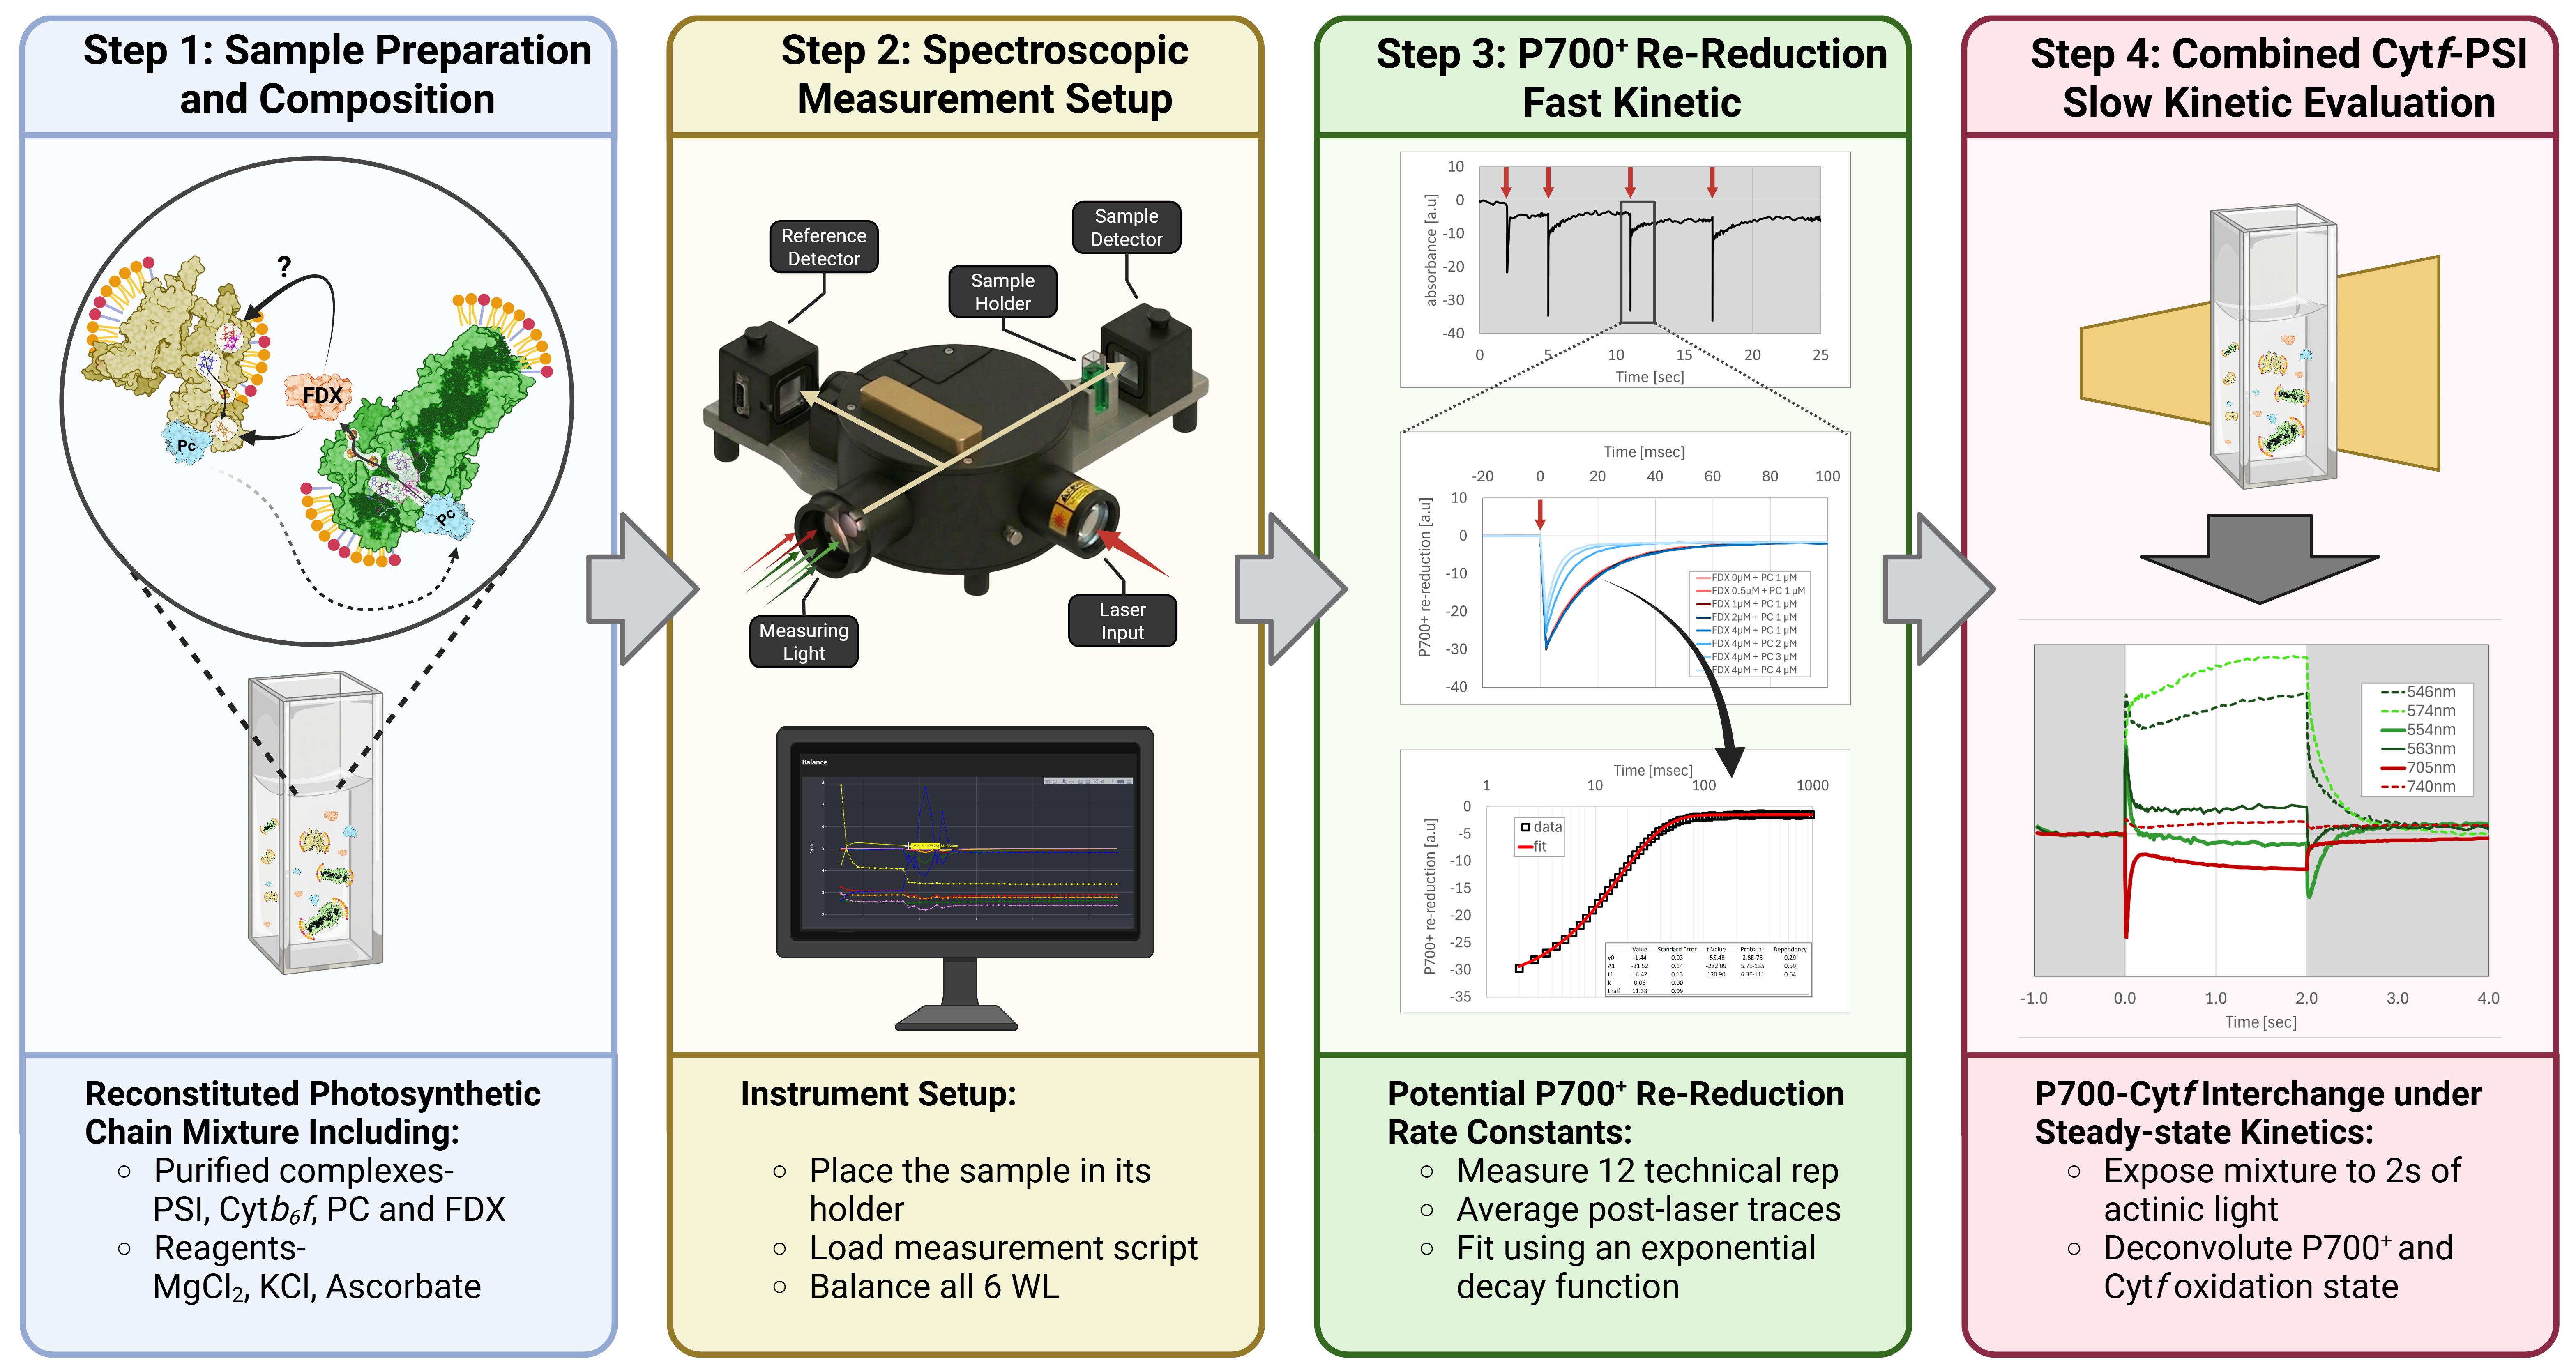
Schematic overview of our experimental setup. (Step 1) Reconstitution of the photosynthetic chain between cytochrome b6f (Cytb6f, yellow) and photosystem I (PSI, green) via plastocyanin (PC, cyan) and ferredoxin (FDX, orange), using ascorbate as a reducing agent. To generate this chain, first place all purified complexes and proteins in a measuring cuvette. (Step 2) Spectroscopic measurement configuration, including sample placement, script loading, and light configuration measurement. Make sure to use the multi-LED probing source smart lamp and remove all filters (of both measuring and detection). Start by balancing the six wavelengths (546, 573, 554, 563, 705, and 740 nm). Make sure that no trace is saturated beyond 10 V by rotating the measuring lamp. (Step 3) Evaluation of fast P700+ re-reduction kinetics. Prior to each actinic light exposure, a series of three laser flashes is initiated (with an additional laser control pre-flash). Data from 12 technical replicates (4 measurement rotations, 3 flashes each) are averaged and fitted with an exponential decay function to determine rate constants, amplitudes, and other parameters. (Step 4) Analysis of slow kinetics under steady-state conditions. The mixture is exposed to 2 s of actinic light to assess the kinetic relationship between the oxidative state of the two complexes (PSI-Cytb6f). Use all 6 wavelengths to deconvolute P700+ and Cytf state. Add increasing FDX and PC concentrations (for additional suggestions, see Procedure. Additional Perspectives and Future Applications) to assess their impact on kinetics.
Background
The cytochrome b6f (Cyt6bf) complex serves as the essential electronic bridge within the photosynthetic electron transport chain [1]. Situated between the two photosystems, it mediates electron transfer from the mobile, membrane-bound carrier plastoquinol (PQH2) to the luminal shuttle plastocyanin (PC); the latter then delivers the electrons to photosystem I (PSI) (Graphical overview). This process is coupled with the translocation of protons across the thylakoid membrane, contributing significantly to the proton motive force (PMF) required for ATP synthesis [2,3]. Since the oxidation of PQH2 at the Qo site of Cytb6f is considered to be a major rate-limiting step, the complex acts as the primary gatekeeper of photosynthetic flux, directly influencing photosynthesizers’ ability to balance energy assimilation with photoprotection [4,5]. The structural and spectral complexity of the Cytb6f complex is defined by its chromophores, centered around four internal heme groups, each of which possesses unique spectroscopic properties. These include two b-type hemes, bl and bh, located on the cytochrome b6 subunit, and two c-type hemes: ci (also known as cn), located on the stromal side of Cytb6, and heme f, located on Cytf, serving as the electron donor site for PC [6,7]. Because each of these hemes exists in a slightly different protein environment, their absorbance spectra shift relative to one another. This spectral diversity enables researchers to dissect the activity of the complex with remarkable precision. By choosing specific wavelengths, one can isolate the electronic transitions of a single heme amidst the background of the others [8]. Most studies monitored the Cytf reduction state. In its reduced state, Cytf exhibits a sharp, prominent absorption peak at 554 nm, known as the α-band (Figure 1) [9]. This peak is highly sensitive to the redox state of the iron center; upon oxidation (by PC, in our case), the absorbance at 554 nm decreases sharply. This relatively high extinction coefficient allows for the detection of minute changes in electron occupancy even in complex biological samples like intact leaves or isolated thylakoid membranes. In addition to this, the ability to monitor the b-hemes (typically around 560 nm) allows for the study of the Q-cycle, a bifurcation mechanism by which the complex doubles its proton-pumping efficiency. Most contemporary research takes advantage of these overlapping but distinct fingerprints to map the internal electron pathway of the complex.
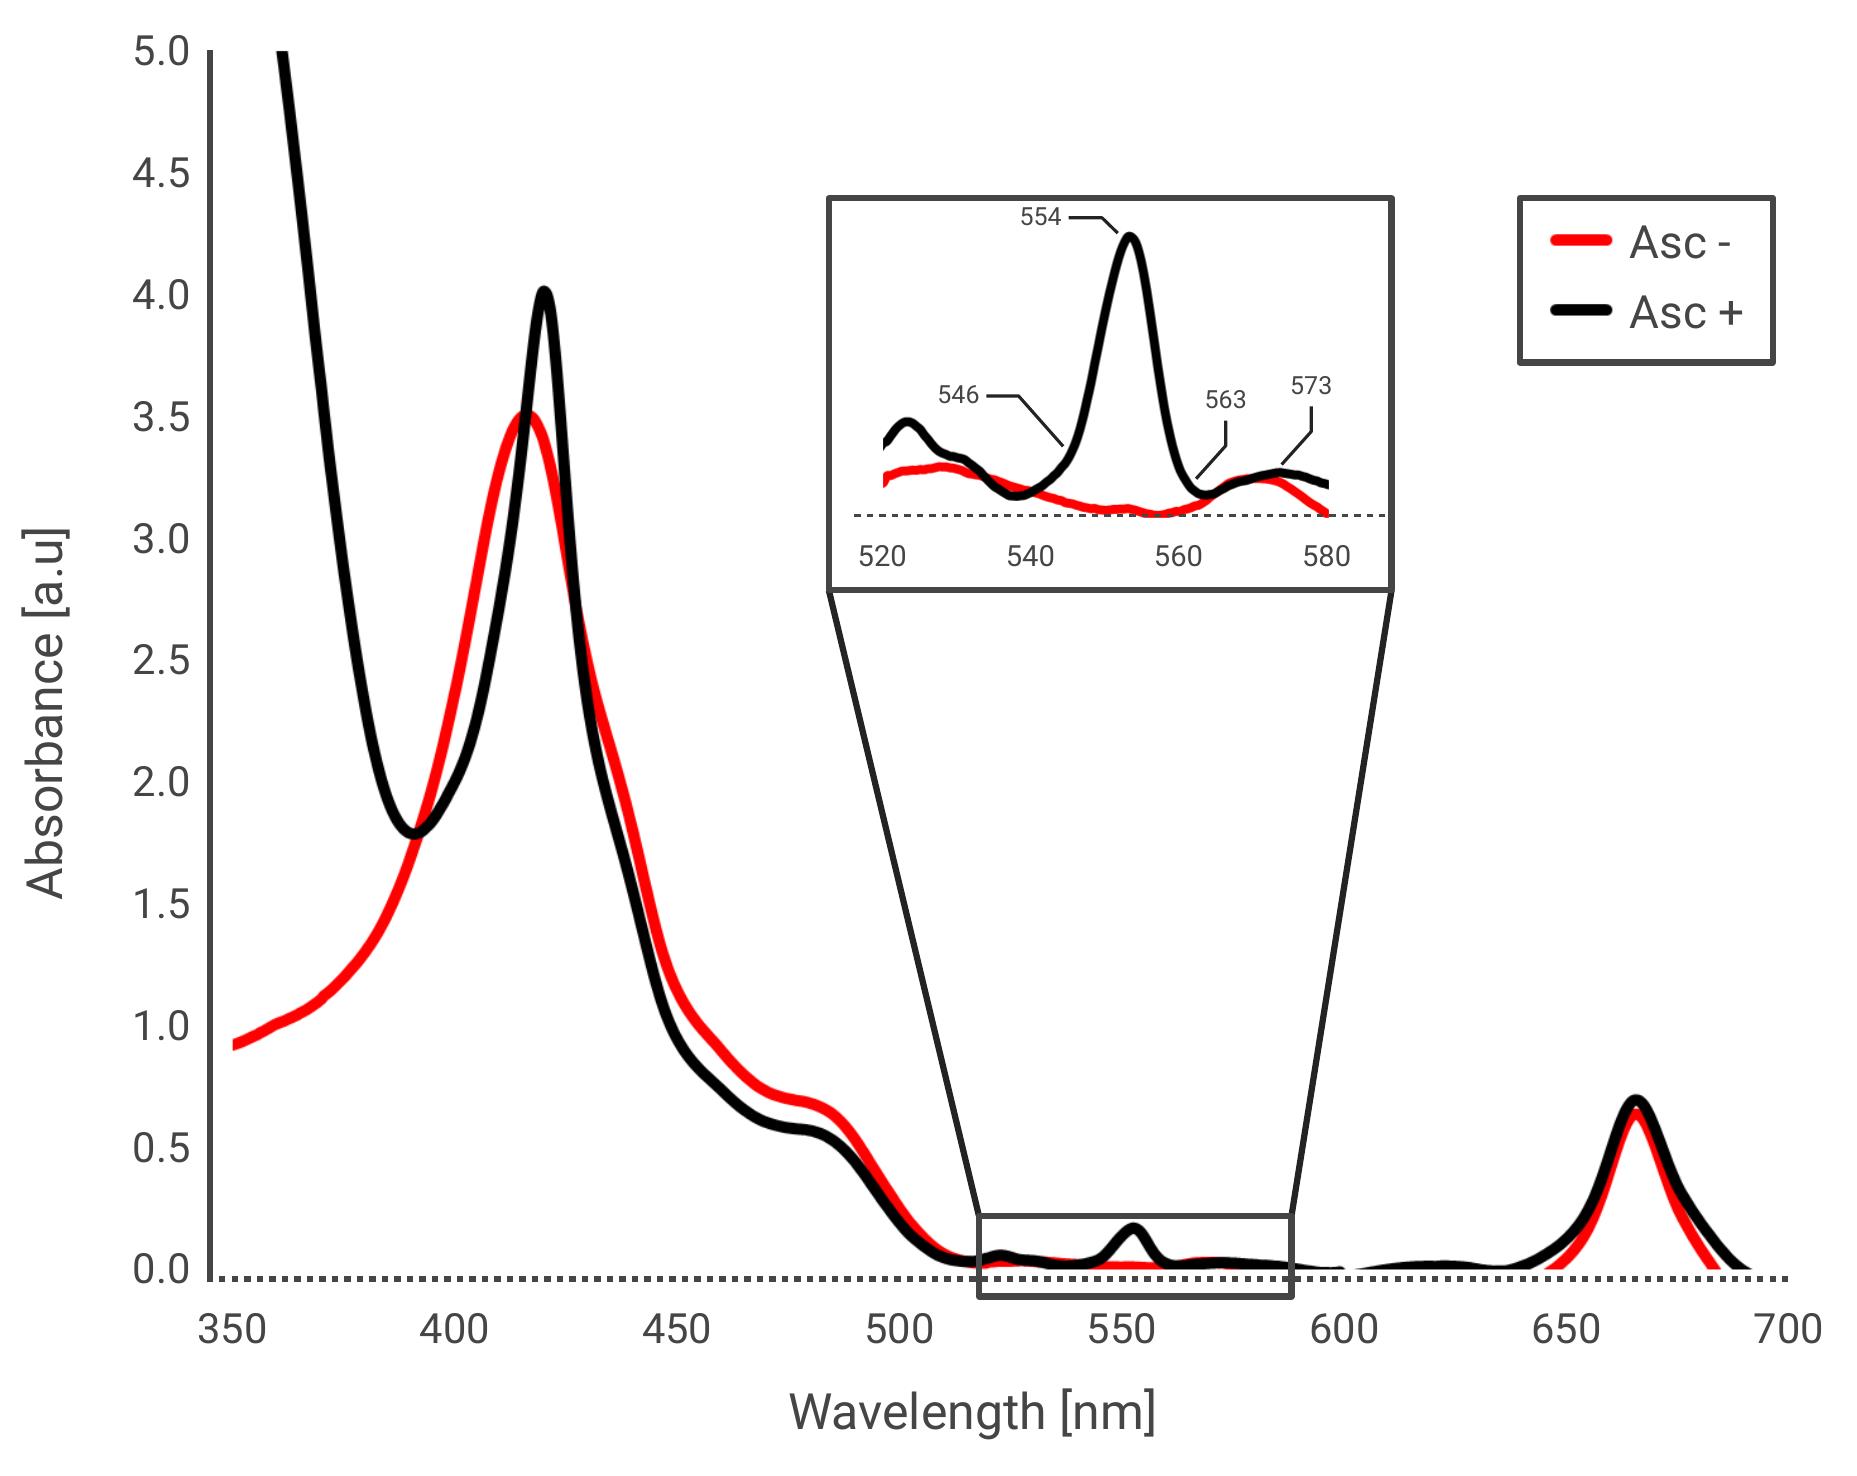
Figure 1. Absorbance spectrum of isolated Cytb6f. Isolated complexes of Cytb6f were diluted in Cytb6f purification solution (CPs, see Recipe 8). The complexes were tested in the absence (red) or presence (black) of 10 mM ascorbate, a known reducer. Insert focuses on the region between 520 and 580 nm. The absorbance increases dramatically and peaks at 554 nm, due to the presence of c-type hemes, such as in the subunit of Cytf.
Spectroscopic analysis of cytochrome b6f kinetics was fundamentally established by Joliot and Joliot, who introduced the pulsed LED-based spectrophotometry required to resolve rapid absorbance changes in photosynthetic complexes [10]. While later work refined these techniques to quantify absolute electron fluxes in intact systems [11], these approaches are often complicated by the physiological variables of whole organisms. Our protocol builds upon these foundational kinetic principles by applying them to a reconstituted in vitro system using purified complexes from green algae and other organisms. This allows for a streamlined, high-resolution analysis of inter-complex electron transfer without the interference of overlapping signals inherent to more complex biological matrices. To capture these transitions in real-time, the photosynthetic community has turned to Joliot-type spectroscopy (JTS) as a well-established method [12–14]. This type of spectral measurement relies on a series of weak monochromatic light pulses that are sent through the sample at microsecond intervals. By measuring the transmission of these probe pulses, we can reconstruct the kinetic trace of Cytf oxidation and its subsequent re-reduction. This grants it the ability to provide millisecond-scale temporal resolution, while maintaining high sensitivity to these specific heme absorbance changes. While recent advancements have successfully applied JTS to monitor Cytb6f kinetics in vivo [8,15], there remains a significant need for a streamlined, accessible in vitro system within the photosynthetic community. In vivo measurements, though physiologically relevant, are often confounded by the sheer complexity of the cellular environment and competing electron sinks. Conversely, traditional in vitro studies focusing on Cytb6f interactions have historically relied on ultra-fast techniques such as stopped-flow spectroscopy [9,16]. While powerful, stopped-flow systems are often limited to tracking a single, isolated electron transfer event and lack the flexibility to integrate multiple regulatory components. Our protocol addresses this gap by creating a modular, reconstituted system that incorporates isolated PSI complexes to act as the primary oxidizer. In this setup, light exposure triggers PSI to oxidize PC, which subsequently oxidizes Cytf, allowing us to monitor the entire kinetic chain at a resolution previously reserved for much more complex setups. By using PSI as a light-mediated biochemical switch, we can move beyond these limitations and begin adding specific regulatory factors, such as ferredoxin (FDX), into the reaction mix. This allows us to investigate multifaceted interactions, including the potential role of FDX in reducing the cytochrome complex from the stromal side—an area of ongoing investigation that this protocol is uniquely equipped to explore. One other advantage of using JTS for this type of research is the ability to incorporate a high-intensity laser flash, which synchronizes the photosynthetic population. This flash, typically lasting only a few nanoseconds, induces a single turnover of PSI, leading to the immediate oxidation of the P700 reaction center. Since we change the concentration of electron carriers such as PC, we de facto alter the kinetics and possibly reach the maximal capacity of PSI, which operates as an oxidizer for our system. Therefore, tracking the rate at which the P700 reaction centers are being re-reduced by the electron carrier grants us the ability to monitor the system. In addition, since we are not really limited by the number of simultaneously measured wavelengths, we can track the slow kinetics of PSI oxidation in light and its re-reduction in darkness. One of the key concepts guiding us in this type of research is attempting to evaluate the effect of Cytb6f on the apparent concentration of PC, which is available to PSI. Furthermore, since the kinetics of P700+ re-reduction serves as a mirror view of Cytf oxidation, the technique described herein may prove beneficial in future studies.
Materials and reagents
Biological materials
1. The purified complexes used in this study (PSI, Cytb6f, PC, and FDX) were isolated from green algae following the specific protocols described in [17]. These procedures were followed exactly as described without any further modifications. Each protein fraction was verified for purity and activity via absorbance spectroscopy and SDS-PAGE prior to being aliquoted and stored at -80 °C.
Reagents
1. 3-(Morpholin-4-yl)propane-1-sulfonic acid (MOPS) (Sigma, catalog number: 106129)
2. Antimycin A (AA) (Sigma, catalog number: A8674)
3. Ascorbate (Asc) (Sigma, catalog number: 255564)
4. Hydrochloridic acid (HCl) (Roth, catalog number: 7647-01-0)
5. Magnesium chloride (MgCl2) (Sigma, catalog number: M8266)
6. Potassium chloride (KCl) (Sigma, catalog number: P9541)
7. Trans-PCC α-maltoside (t-PCCαM) (Glycon, catalog number: D99019)
8. Tricine (C6H13NO5) (AppliChem, catalog number: A10585)
9. Water (ddH2O), in-house Millipore-purified water (18.2 MΩ/cm)
Solutions
1. MOPS stock, pH 7.0, 1 M (see Recipes)
2. Tricine stock, pH 7.8, 1 M (see Recipes)
3. KCl stock, 3 M (see Recipes)
4. Ascorbate stock, 1 M (see Recipes)
5. MgCl2 stock, 1 M (see Recipes)
6. t-PCCαM stock, 10% (see Recipes)
7. JTS activity solution (JAs) (see Recipes)
8. Cytb6f purification solution (CPs) (see Recipes)
9. PSI purification solution (PPs) (see Recipes)
10. Plastocyanin column buffer (PC-B) (see Recipes)
Recipes
1. MOPS stock, pH 7.0, 1 M
| Reagent | Final concentration | Quantity or Volume |
|---|---|---|
| MOPS | 1 M | 20.9 g |
| ddH2O | n/a | Top up to 100 mL |
a. Set pH to 7.0 using HCl 5 M.
b. Keep cool (4 °C) to avoid contaminations; life span ~6 months.
2. Tricine stock, pH 7.8, 1 M
| Reagent | Final concentration | Quantity or volume |
|---|---|---|
| Tricine | 1 M | 17.9 g |
| ddH2O | n/a | Top up to 100 mL |
a. Set pH to 7.8 using HCl 5 M.
b. Keep cool (4 °C) to avoid contaminations; life span ~6 months.
3. KCl stock, 3 M
| Reagent | Final concentration | Quantity or volume |
|---|---|---|
| KCl | 3 M | 224 g |
| ddH2O | n/a | Top up to 100 mL |
Keep at room temperature (24 °C); life span unlimited.
4. Ascorbate stock, 1 M
| Reagent | Final concentration | Quantity or volume |
|---|---|---|
| Ascorbate | 1 M | 198 mg |
| ddH2O | n/a | Top up to 1 mL |
Keep in a dark tube. It is better to use a fresh solution mixed at the day of experimenting; short lifespan.
5. MgCl2 stock, 1 M
| Reagent | Final concentration | Quantity or volume |
|---|---|---|
| MgCl2 | 1 M | 2.38 g |
| ddH2O | n/a | Top up to 100 mL |
Keep cool (4 °C) to avoid contamination; life span unlimited.
6. t-PCCαM stock, 10%
| Reagent | Final concentration | Quantity or volume |
|---|---|---|
| t-PCCαM | 10% | 1 g |
| ddH2O | n/a | Top up to 10 mL |
Dissolves better in hot water. Aliquot to 1 mL tubes and keep at -20 °C to increase lifespan (~6 months).
7. JTS activity solution (JAs)
| Reagent | Final concentration | Quantity or volume |
|---|---|---|
| MOPS (Recipe 1) | 30 mM | 35 mL |
| t-PCCαM (Recipe 6) | 0.01% | 1 mL |
| ddH2O | n/a | Top up to 1 L |
Keep cool (4 °C) to avoid contaminations; life span 2–3 months.
8. Cytb6f purification solution (CPs)
| Reagent | Final concentration | Quantity or volume |
|---|---|---|
| JAs (Recipe 7) | MOPS 30 mM t-PCCαM 0.01% | 100 mL |
| KCl (Recipe 3) | 30 mM | 1 mL |
Keep cool (4 °C) to avoid contaminations; life span 2–3 months.
9. PSI purification solution (PPs)
| Reagent | Final concentration | Quantity or volume |
|---|---|---|
| JAs (Recipe 7) | MOPS 30 mM t-PCCαM 0.01% | 100 mL |
| MgCl2 1 M (Recipe 5) | 5 mM | 500 μL |
Keep cool (4°C) to avoid contaminations; life span 2–3 months.
10. Plastocyanin column buffer (PC-B)
| Reagent | Final concentration | Quantity or volume |
|---|---|---|
| Tricine 1 M (Recipe 2) | 25 mM | 25 mL |
| KCl 3 M (Recipe 3) | 10 mM | 3.3 mL |
| dH2O | n/a | Top up to 1 L |
Keep cool (4 °C) to avoid contaminations; life span ~6 months.
Equipment
1. Joliot type spectrophotometer -150 (Bio-Logic) designed for fast kinetics and simultaneous multi-wavelength characterization.
a. Smart lamp (detection): multi-LED probing source with integrated interference filters; 546, 554, 563, 574, 705, and 740 nm wavelengths used (standard kit for cytochrome b6f and P700); pulsed LED measurements can be acquired as fast as 10 μs between samples.
b. Actinic light source, type: dual-ring LED array (integrated into the optical bench); output: 630 nm (red) and 720 nm (far-red); intensity range: 0 to >5,000 μE/m2/s1.
c. Detection system: Detectors: two large-area high-speed Si PIN photodiodes (signal and reference); resolution: 18-bit ADC for high dynamic range; sensitivity: capable of resolving absorbance changes down to 10 × 10-5 OD.
d. Synchronization: Integrated BNC ports for microsecond-precision triggering of the Nd:YAG laser and external flash lamps.
2. Laser flash (Quantel, Lumibird Group), Nd:YAG (neodymium-doped yttrium aluminum garnet) solid-state laser; primary output: frequency-doubled to 532 nm (green); wavelength shifting: the 532 nm beam is used to pump a red dye filter/cavity (e.g., using LDS 698 dye); effective output wavelength: saturating red flash cantered at ~640–700 nm; pulse duration: ultra-short pulses of ~6–10 ns; pulse energy (strength): calibrated to ~20–30 mJ at the source.
Experimental rationale: The energy is adjusted to ensure a single saturating turnover of all photosystem I (PSI) reaction centers within the cuvette while the red shift prevents spectral interference with the JTS detection wavelengths.
Procedure
登录/注册后免费查看全文
文章信息
稿件历史记录
提交日期: Dec 23, 2025
接收日期: Mar 17, 2026
在线发布日期: Apr 14, 2026
出版日期: May 5, 2026
版权信息
© 2026 The Author(s); This is an open access article under the CC BY license (https://creativecommons.org/licenses/by/4.0/).
如何引用
Readers should cite both the Bio-protocol article and the original research article where this protocol was used:
- Milrad, Y., Wegemann, D. and Hippler, M. (2026). Kinetic Determination of Cytochrome b6f Activity In Vitro. Bio-protocol 16(9): e5677. DOI: 10.21769/BioProtoc.5677.
- Milrad, Y., Wegemann, D., Kuhlgert, S., Scholz, M., Younas, M., Vidal-Meireles, A. and Hippler, M. (2025). Insights into plastocyanin–cytochrome b6f complex formation: The role of plastocyanin phosphorylation. Plant Physiol. 198(4): e1093/plphys/kiaf269. https://doi.org/10.1093/plphys/kiaf269

 Download Citation in RIS Format
分类
植物科学 > 植物分子生物学 > 蛋白质
分子生物学 > 蛋白质 > 蛋白质-蛋白质相互作用
您对这篇实验方案有问题吗?
在此处发布您的问题,我们将邀请本文作者来回答。同时,我们会将您的问题发布到Bio-protocol Exchange,以便寻求社区成员的帮助。
 发布问题
发布问题


