


Spatial Imaging and Quantification of Hydrogen Peroxide in Arabidopsis Roots: From Sample Preparation to Image Analysis
拟南芥根中过氧化氢的空间定位成像及定量分析:从样品制备到图像分析

(*contributed equally to this work) 发布: 2026年04月20日第16卷第8期 DOI: 10.21769/BioProtoc.5659 浏览次数: 956
评审: Samik BhattacharyaNicolás M. CecchiniAnonymous reviewer(s)
 PDF
PDF  Q&A
Q&A
参见作者原研究论文
The authors used this protocol in:
Feb 2026
Advertisement








Abstract
Reactive oxygen species (ROS) are central regulators of plant development and stress responses, with hydrogen peroxide (H2O2) acting as a key signaling molecule whose spatial distribution determines adaptive versus damaging outcomes. Accurate detection of H2O2 at tissue and cellular resolution is therefore essential for understanding redox-dependent regulation of plant growth. A variety of techniques have been used to monitor H2O2, including bulk spectrophotometric and fluorometric assays, genetically encoded sensors for real-time measurements, and chemical probes for in situ detection. While these approaches differ in sensitivity, specificity, and temporal resolution, many are limited by a lack of spatial information, technical complexity, or dependence on transgenic material. Here, we present a detailed protocol for 3,3′-diaminobenzidine (DAB)-based histochemical detection of H2O2 in seedling roots, covering staining, imaging, and semi-quantitative image analysis using open-source software (FIJI/ImageJ). The method relies on peroxidase-mediated oxidation of DAB, resulting in a stable, light-resistant, and insoluble precipitate that enables visualization of H2O2 accumulation with high spatial resolution. This protocol provides a robust, accessible, and genetically independent approach for spatial analysis of H2O2 in plant tissues. Its simplicity, compatibility with diverse genotypes and treatments, and suitability for semi-quantitative analysis make it a valuable tool for examining the spatial distribution of H2O2, thereby providing spatial insight into redox-related regulatory processes during plant development and stress responses.
Key features
• Built upon methods developed by Thordal-Christensen et al. [1] and Daudi and O’Brien [2], with a specific focus on root staining.
• Includes a downstream image analysis pipeline for semi-quantitative H2O2 measurement in DAB-stained roots using the open-source software FIJI/ImageJ.
• Provides detailed, step-by-step video tutorials for image analysis in FIJI/ImageJ.
• Includes a Fiji/ImageJ script (Macro 1) for automating the application of fixed-intensity scaling using Spectrum LUT.
Keywords: Hydrogen peroxide (过氧化氢) DAB staining (DAB 染色)
Image analysis (图像分析)
ROS quantification (活性氧定量)
FIJI/ImageJ (FIJI/ImageJ)
DAB staining (DAB 染色)
Image analysis (图像分析)
ROS quantification (活性氧定量)
FIJI/ImageJ (FIJI/ImageJ)
Graphical overview
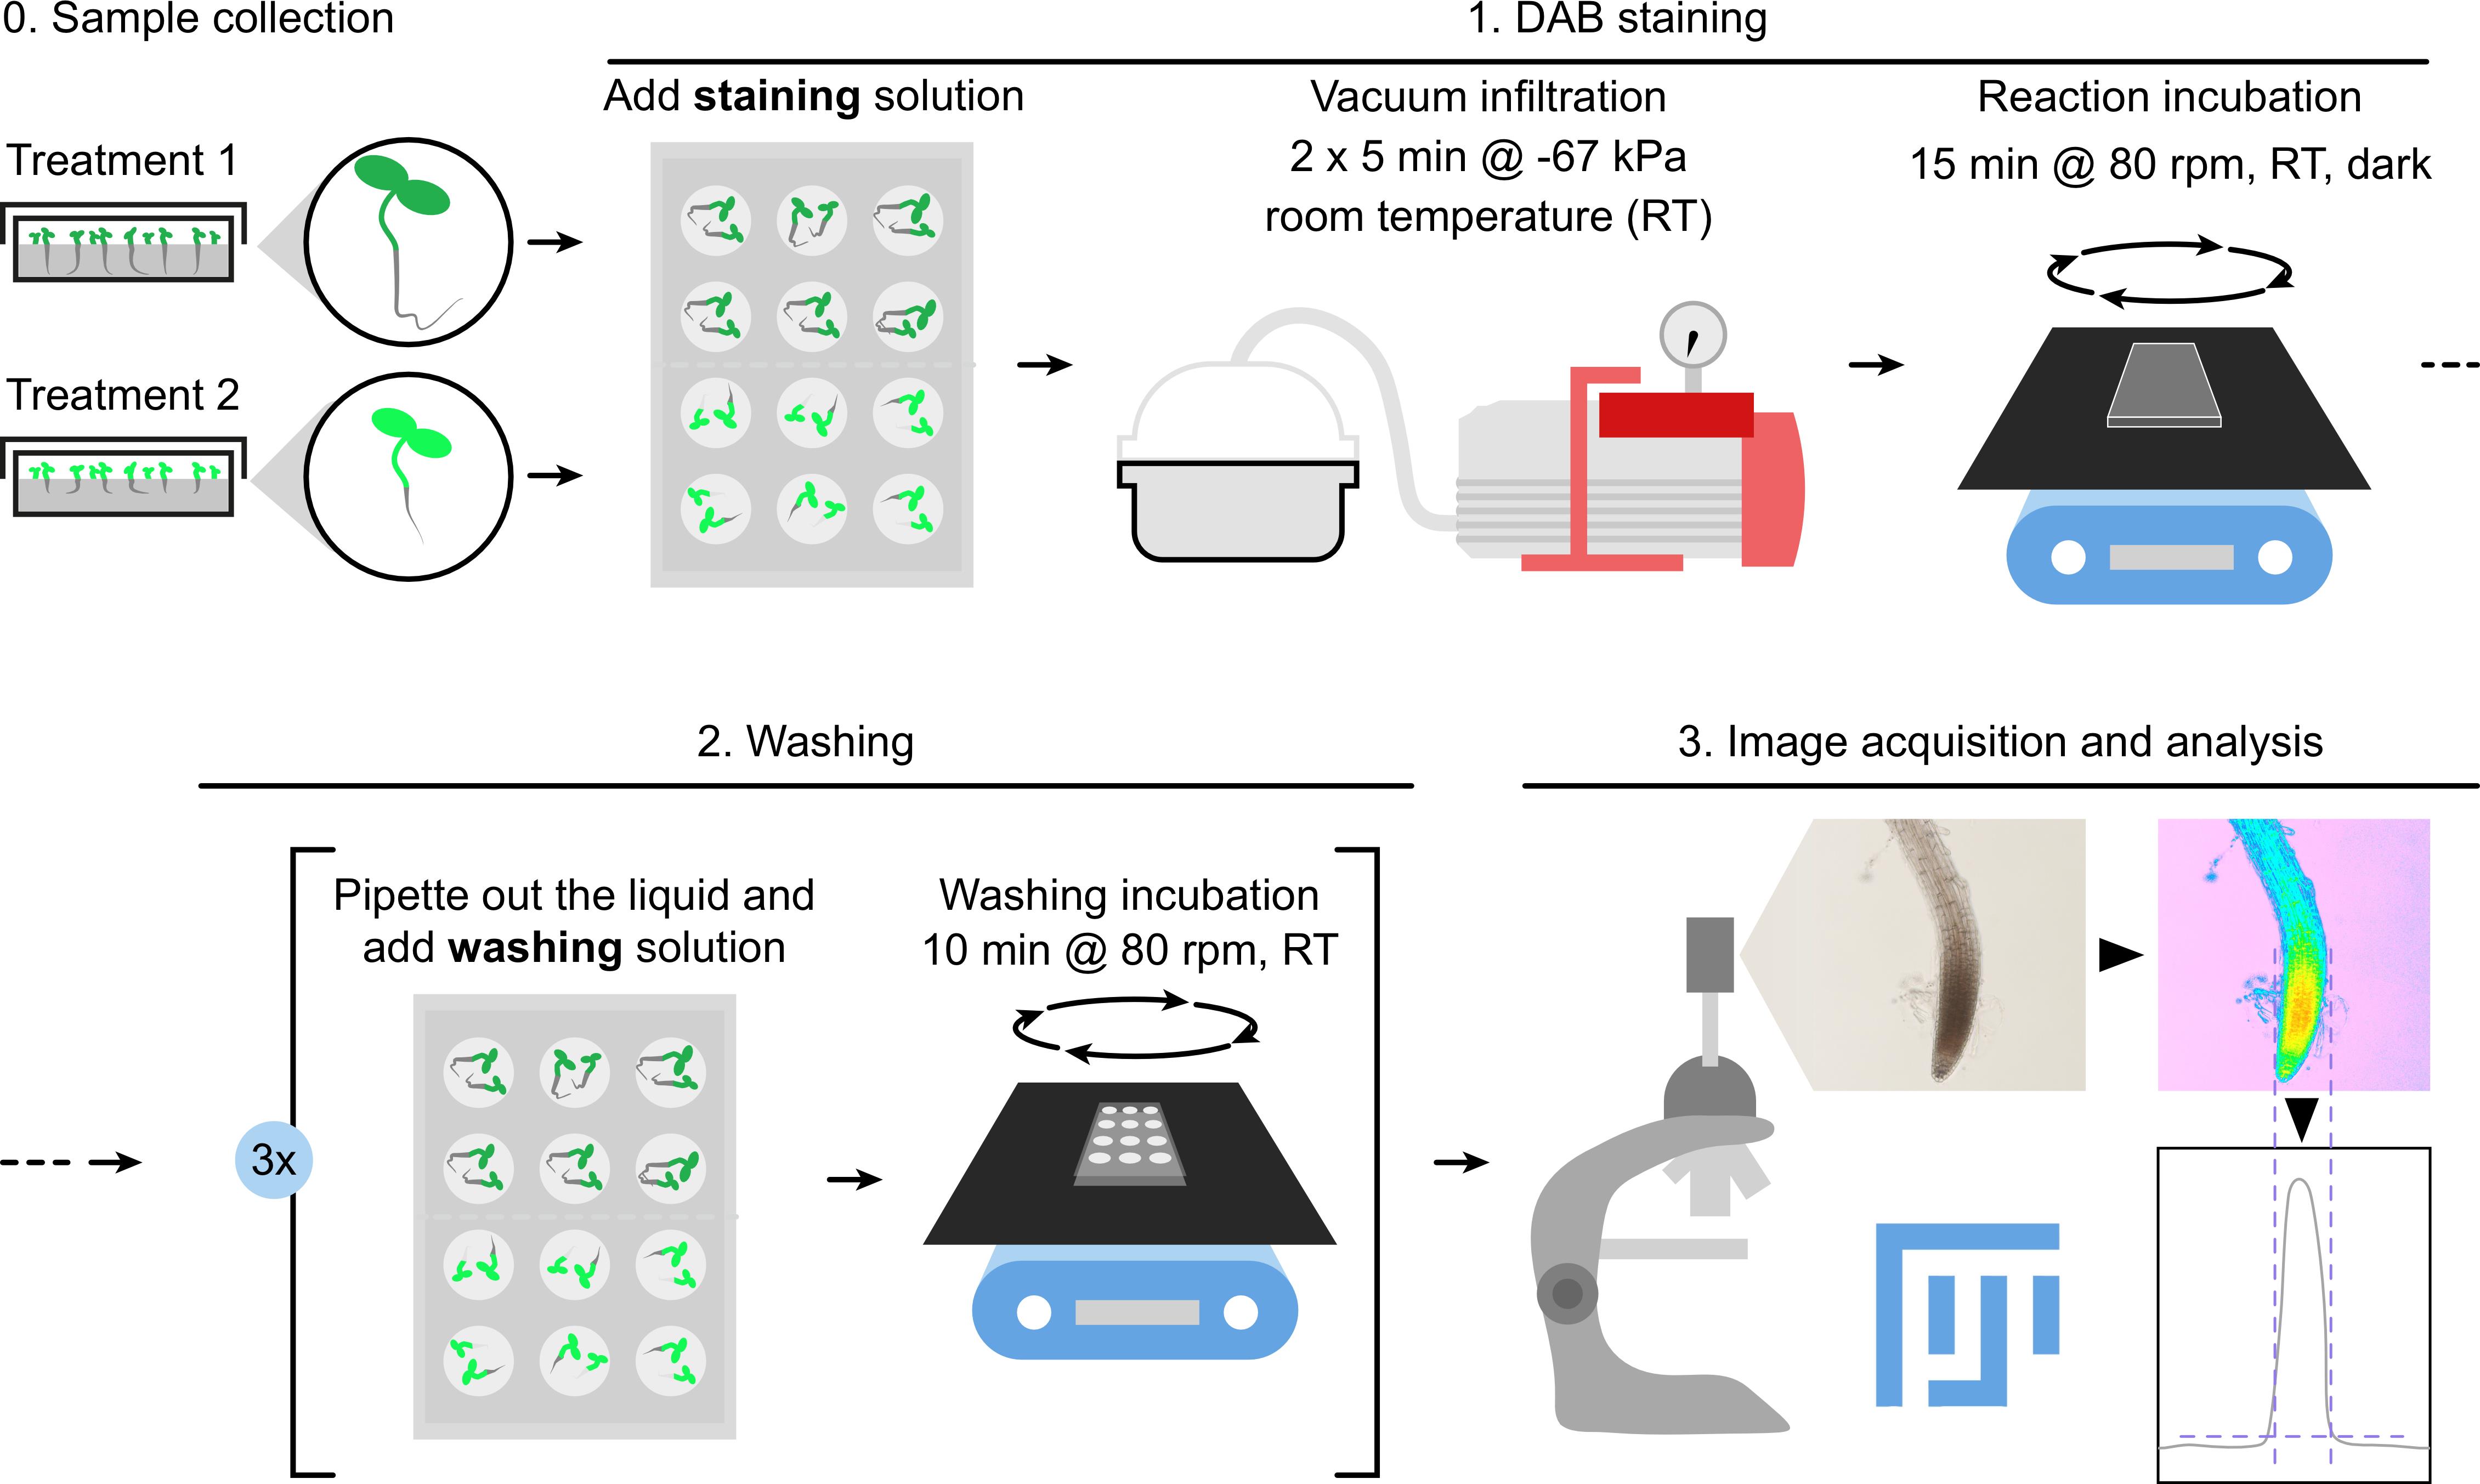
Background
Reactive oxygen species (ROS) lie at the core of redox biology. In plants, ROS fulfill a dual role, acting both as signaling molecules and as cytotoxic agents [3]. Owing to its relatively higher stability compared to other ROS, hydrogen peroxide (H2O2) represents a central regulator of plant development and stress responses [4]. H2O2 can directly interact with proteins, thereby modifying their structure and downstream signaling pathways [3]. Consequently, the spatiotemporal regulation of H2O2 accumulation determines whether plant cells mount appropriate responses to environmental cues or instead experience oxidative damage leading to cell death. Accurate quantification of H2O2 with spatial resolution is therefore essential for understanding how ROS mediate cell-specific adjustments of plant growth under changing conditions.
A wide range of approaches has been developed to detect and quantify H2O2, each with distinct advantages and limitations. In general, substrate specificity and spatial resolution are the primary factors guiding method selection. Available techniques include spectrophotometric assays, enzyme-coupled fluorometric assays, imaging of genetically encoded sensors that allow real-time detection in living tissues, and histochemical staining methods that provide spatial information. Accordingly, the choice of assay depends on whether the experimental focus lies on bulk quantification, dynamic measurements, or spatial localization.
Classical spectrophotometric assays, such as the titanium–peroxide complex method [5], enable straightforward and cost-effective bulk quantification of H2O2 but lack spatial resolution. Enzyme-coupled fluorometric assays, including Amplex Red and Amplex Ultra Red [6–8], or enzyme-independent assays, like the europium–tetracycline complex [7], provide high sensitivity and accurate quantification at low H2O2 concentrations; however, they require tightly controlled reaction conditions and are generally unsuitable for in situ applications. Genetically encoded sensors, such as HyPer [9] and roGFP2-Orp1 [10], offer high H2O2 selectivity together with real-time, quantitative, and compartment-specific measurements in vivo [11]. Despite these advantages, their reliance on transgenic systems limits their applicability across diverse genetic backgrounds. Chemical probes, including H2DCF-DA (2′,7′-dichlorodihydrofluorescein diacetate), CM-H2DCF-DA (chloromethyl-H2DCF-DA), and DAB (3,3′-diaminobenzidine), permit intracellular ROS detection without genetic manipulation. H2DCF-DA and CM-H2DCF-DA are cell-permeable and widely used in living tissues [8,12–15]; however, their poor specificity and susceptibility to oxidation by multiple reactive species mean that they primarily reflect general redox status rather than H2O2 levels specifically.
Among these approaches, DAB staining has long been established as a classical method for detecting hydrogen peroxide in plant tissues [1,16]. The assay relies on a peroxidase-mediated reaction in which DAB is oxidized by H2O2, resulting in the formation of an insoluble brown precipitate. This enables spatial visualization of H2O2 accumulation in roots (e.g., [17,18]) as well as in leaves and other pigmented tissues following chlorophyll removal [2,19–21]. Although DAB staining is semi-quantitative and dependent on endogenous peroxidase activity, its simplicity, robustness, and capacity for spatial resolution have led to its widespread use in studies of plant oxidative stress [22].
Despite its widespread use, DAB staining protocols are often applied qualitatively or rely on simplified quantification approaches that lack standardized image analysis workflows, particularly for roots. Here, we present a refined and accessible protocol for semi-quantitative H2O2 detection in Arabidopsis thaliana roots that builds on established DAB staining methods while placing specific emphasis on root tissues and reproducible downstream analysis. Compared with bulk biochemical assays or genetically encoded sensors, this approach offers a favorable balance between spatial resolution, experimental accessibility, and applicability across diverse genetic backgrounds without the need for transgenic lines. Although DAB staining remains inherently dependent on endogenous peroxidase activity and does not provide absolute H2O2 concentrations, our protocol minimizes variability by integrating controlled staining conditions with a standardized, background-corrected image analysis pipeline implemented in open-source FIJI/ImageJ. This protocol provides a complete workflow, including DAB staining and washing steps for roots, detailed guidance on image acquisition, a transparent and reproducible quantification strategy (ROI definition, background subtraction, peak integration), and step-by-step video tutorials to facilitate adoption and reproducibility across laboratories.
Materials and reagents
Biological materials
1. Previously grown 7-day-old Arabidopsis thaliana seedlings
Note: We also successfully tested this protocol using 3–7-day-old seedlings. Moreover, older seedlings can be used when larger cell-culture wells are employed. For details on the growth conditions used to quantify H2O2 in this protocol, see [18].
Reagents
1. HCl 37% (v/v) (Panreac AppliChem, catalog number: 471020.1611, CAS: 7647-01-0)
2. 3,3′-Diaminobenzidine (DAB) (Sigma-Aldrich, catalog number: D8001, CAS: 91-95-2)
Note: DAB should be stored at room temperature (RT). The bottle must be kept tightly closed and stored in a dry, well-ventilated place, away from direct light and moisture, to prevent degradation. Other variants of the product exist, so it is important to note the exact reference. It is recommended to consult the Certificate of Analysis for the specific batch to verify the retest or expiry date.
3. Ethanol (VWR ethanol AnalaR Normapur, catalog number: 20823.293)
4. Lactic acid (Panreac AppliChem, catalog number: 141034, CAS: 79-33-4)
5. Glycerol (Fisher BioReagents, catalog number: BP229-1, CAS: 56-81-5)
6. Deionized water (dH2O)
Solutions
1. Staining solution (see Recipes)
2. Washing solution (see Recipes)
3. Storage solution (see Recipes)
Recipes
1. Staining solution
| Reagent | Final concentration | Quantity or volume |
|---|---|---|
| DAB | 1 mg/mL | 20 mg |
| HCl (37%) | 8 mM (adjust to reach pH 3.8) | 16 μL |
| Total | n/a | 20 mL |
Dissolve DAB at RT with vigorous stirring and protect from light. Prepare fresh; storage at 4 °C for up to 2 days was tested without obvious loss of performance. Allow at least 2 h to ensure complete dissolution of DAB.
Note: A freshly prepared staining solution should ideally be clear to very light brown. Do not use it if it darkens and turns reddish-brown, which usually indicates oxidation.
2. Washing solution
| Reagent | Final concentration | Quantity or volume |
|---|---|---|
| Ethanol | 60% (v/v) | 30 mL |
| Lactic acid | 20% (v/v) | 10 mL |
| Glycerol | 20% (v/v) | 10 mL |
| Total | n/a | 50 mL |
The volumetric ratio (v/v/v) of ethanol:lactic acid:glycerol is 3:1:1. The solution can be stored at RT for long-term use (up to 6 months) in a sealed container.
3. Storage solution
| Reagent | Final concentration | Quantity or volume |
|---|---|---|
| Glycerol | 60% (v/v) | 30 mL |
| Total | n/a | 50 mL |
The solution can be stored at RT for long-term use (up to 2 years). After addition to samples, the mounted material can be stored at 4 °C for 7–10 days before fungal growth typically occurs.
Laboratory supplies
1. Cell culture multi-well plates (6- or 12-well plates to allow orbital movement) (BioFil, catalog numbers: TPC 011006 and TPC 011012)
2. 10 μL pipette tips (LLG, catalog number: 4668775)
3. 200 μL pipette tips (DasLab, catalog number: 162001)
4. 1 mL pipette tips (DasLab, catalog number: 162222)
5. Aluminum foil
6. 10 mL serological pipettes (LLG, catalog number: 6.268 240)
7. 50 mL serological pipettes (LLG, catalog number: 9.380 443)
8. (Optional) 50 mL conical plastic tubes (for storing solutions)
9. Glass slides and coverslips
10. Scalpel
Equipment
1. Fume hood (Walder, model: scala)
2. Water deionizer/filter/Milli-Q system (Merck Millipore, model: Milli-Q® IQ 7005)
3. Precision scale (Linear scale micrometer ruler 1 mm/0.01 mm) (WPI, catalog number: 500828)
4. 50 mL measuring cylinder (Normax, catalog number: 4.5149617)
5. 100 mL beaker (Normax, catalog number: 3.2110624N)
6. Microspoon or spatula (Carl Roth, catalog number: PX33.1)
7. Tweezers (to transfer seedlings into plates)
8. Pipette controller (Fisherbrand, catalog number: 15840053)
9. 1 mL micropipette (Gilson, model: PIPETMANTM P1000)
10. 200 μL micropipette (Gilson, model: PIPETMANTM P200)
11. 10 μL micropipette (Gilson, model: PIPETMANTM P10)
12. Magnetic stirrer and magnets [Merck, IKA®, catalog number: Z672378 and catalog number: Z744785 (Magnetic Stir Bar)]
13. Orbital shaker (VWR, model: 5000 Advanced Orbital Shaker)
14. 50/100 mL screw-cap glass bottles (for solution storage)
15. Timer
16. Vacuum pump (GAST, model: DCA-P504-BN)
17. Vacuum chamber (Merck, BRAND® desiccator, catalog number: BR65810)
18. Microscope (10× objective, 0.63× ocular; transmitted light, not reflected) and microscope-compatible camera
Note: We used a Zeiss Axio Scope A1 vertical microscope equipped with an AxioCam503 Color camera and Zeiss Zen Blue software.
19. Computer
Note: Image analyses described here were successfully performed without limitations on two different workstations: (1) ACER Nitro AN515-52, CPU: c2.30GHz Intel(R) Core(TM) i5-8300H; RAM: 32 GB 2666 MHz SO-DIMM DDR4; GPU: NVIDIA GeForce GTX 1050 (4096 MB GDDR5); OS: Windows 11 Pro (Version 10.0.26200); and (2) MacBook Pro, CPU: 1.4 GHz Quad-Core Intel Core i5; RAM: 16 GB 2133 MHz LPDDR3; GPU: Intel Iris Plus Graphics 645 (1536 MB); OS: macOS (Version 13.7.8).
Software and datasets
1. FIJI/ImageJ [23], open source (https://imagej.net/software/fiji/). Bio-Format Importer and Colour Deconvolution H DAB vector are built-in plugins in FIJI/ImageJ v1.54p or later.
Procedure
登录/注册后免费查看全文
文章信息
稿件历史记录
提交日期: Jan 30, 2026
接收日期: Mar 12, 2026
在线发布日期: Mar 23, 2026
出版日期: Apr 20, 2026
版权信息
© 2026 The Author(s); This is an open access article under the CC BY license (https://creativecommons.org/licenses/by/4.0/).
如何引用
Readers should cite both the Bio-protocol article and the original research article where this protocol was used:
- Fenech, M. and Amorim-Silva, V. (2026). Spatial Imaging and Quantification of Hydrogen Peroxide in Arabidopsis Roots: From Sample Preparation to Image Analysis. Bio-protocol 16(8): e5659. DOI: 10.21769/BioProtoc.5659.
- Fenech, M., Zulian, V., Moya-Cuevas, J., Arnaud, D., Morilla, I., Smirnoff, N., Botella, M. A., Stepanova, A. N., Alonso, J. M., Martin-Pizarro, C., Amorim-Silva, V. (2026). Arabidopsis lines with modified ascorbate concentrations reveal a link between ascorbate and auxin biosynthesis. Plant Physiol. 200(2): kiaf667. https://doi.org/10.1093/plphys/kiaf667

 Download Citation in RIS Format
分类
植物科学 > 植物细胞生物学 > 组织分析
生物化学 > 其它化合物 > 活性氧
细胞生物学 > 组织分析 > 组织染色
您对这篇实验方案有问题吗?
在此处发布您的问题,我们将邀请本文作者来回答。同时,我们会将您的问题发布到Bio-protocol Exchange,以便寻求社区成员的帮助。
 发布问题
发布问题


