- Protocols

- Articles and Issues
- For Authors
- About
- Become a Reviewer

Fluorescence Recovery After Photobleaching (FRAP) in the Fission Yeast Nucleus


Published: Vol 3, Iss 20, Oct 20, 2013 DOI: 10.21769/BioProtoc.941 Views: 11191
Reviewed by: Lin FangFanglian He
Original research article
The authors used this protocol in:

Jan 2013
Advertisement


Protocol Collections
Comprehensive collections of detailed, peer-reviewed protocols focusing on specific topics


Abstract
We use fluorescence recovery after photobleaching (FRAP) to calculate the diffusion coefficient of GFP in the nucleoplasm of fission yeast. The FRAP method can be generally used to measure the mobility of proteins inside the cell or its organelles.
In our experiment we only measured the diffusion of GFP inside the nucleoplasm of fission yeast mitotic cells. However, if GFP is fused to a protein, the mobility of the protein of interest can be calculated following the GFP signal in the bleached area. We did not, however, address this in our experiments; therefore other sources could be searched for this topic.
To compare FRAP and FLIP, both techniques can be used to measure protein mobility inside a cell. However, with FRAP, the diffusion of a protein is measured in the region of interest (ROI), to observe the recovering of fluorescence in this area. In FLIP, fluorescence recovery is measured in an area different from where the bleaching was done, to observe whether the tagged protein is able to move into that area, which would become darker, gaining the bleached proteins. The major difference here is that for FRAP a single bleaching event is sufficient, while FLIP requires a number of bleaching steps, in order to avoid reflux of fluorescent protein in the same region.
Technically FRAP in the nucleus und FRAP in the cytoplasm has no difference. However, we measured a difference between the diffusion coefficient inside the nucleus (D = 5.6 ± 2.8 μm2/s) and in the cytoplasm (D = 8.6 ± 2.2 μm2/s). This is due to the different compositions inside these compartments, consisting of differing amounts of proteins, DNA and RNA.
Materials and Reagents
- Fission yeast cells expressing GFP in the nucleus (e.g. PD31 from Kalinina et al., 2013)
- Lectin (Sigma-Aldrich, catalog number: L2380 )
- MgCl2.6H2O
- CaCl2.2H2O
- KCl
- Na2SO4
- Pantothenic acid
- Nicotinic acid
- Inositol
- Biotin
- Boric acid
- MnSO4
- ZnSO4.7H2O
- FeCl2.6H2O
- Molybdic acid
- KI
- CuSO4.5H2O
- Citric acid
- Edinburgh minimal medium (EMM) (see Recipes)
Equipment
- Glass bottom dish (35 mm dish with a coverslip number = 1.5 and thickness 0.16 – 0.19) (MatTek, catalog number: P35G-1.5-14-C ) covered with Lectin.Spinning disk confocal microscope with a scanner-based FRAP system
- We use the Andor Revolution Spinning Disc System (Andor Technology), consisting of a Yokogawa CSU-X1 spinning disk scan head (Yokogawa Electric), which is connected to an Olympus IX81 inverted microscope (OLYMPUS). The microscope is equipped with a Prior ProScanIII xy scanning stage (Prior Scientific, Rockland MA, USA) and an Olympus UPlanSApo 100x/1.4 NA oil objective (OLYMPUS). Excitation for acquisition and bleaching is done using a Sapphire 488 nm solid-state laser (50 mW; Coherent). Laser power is controlled using the acousto-optic tunable filter in the Andor Revolution laser combiner (ALC, Andor Technology). The microscope is equipped with an iXon EM + DU-897 BV back illuminated EMCCD camera, cooled to -80 °C, pre-amp gain 2.4, EM gain 300 (Andor Technology). The resulting xy-pixel size in the images is 129 nm.
Note: Prior to the FRAP experiments, calibration has to be done following the FRAP calibration routine of Andor iQ software using the Andor FRAPPA calibration slide. Briefly, the software guides the user through a series of point-bleach steps during which one has to indicate the bleached point location in the image. This way the scanner bleach position is calibrated with the point position in the image.
- BL HC 525/30 (Semrock)
- Spectrometer
Software
- Andor iQ2 software (Andor Technology)
- Fiji (http://fiji.sc/Fiji)
- Matlab (MathWorks) software
Procedure
- A 5 ml pre-culture of cells is grown in EMM plus supplements over night. The next day, the cells are refreshed in a 20 ml culture until exponential growth, which is done by diluting 1 ml pre-culture with 19 ml fresh EMM (1:20). Cell number can be measured via optical density measurements on a spectrometer. To obtain cells in exponential growth, an OD600 = 0.1 – 0.2 should be achieved. This would approximate to a cell number between 2 x 10⁶ cells/ml – 1 x 10⁷ cells/ml. An OD600 = 1, is linear to the cell number.
- Imaging culture dishes with a glass-bottom are covered with 1 μl Lectin (2 mg/ml) and left to dry.
- 100 μl of cells in EMM from the culture are added to the dish and left to settle for 10 minutes.
- Cells, which were stuck to the dish via lectin, are washed once with 2 ml EMM to remove loose/un-attached cells, and 1.5 ml EMM is added.
- FRAP Experiments are performed at room temperature in three successive steps (a. b. c. see below) controlled by Andor iQ2 software. Ideally 30 – 50 cells are measured and analysed.
- Prebleach: after focusing the cell of interest, a time-lapse of 50 images of a single plane of the nucleus is acquired with 50 ms exposure time with a 488 nm laser, at 10-15% (details see above, emission filter is BL HC 525/30).
- Bleach: bleaching is performed on a 2 x 2 square pixel area (inside the nucleus, away from the nucleolus) with 50% of the 488 nm laser, with a dwell time of 1 ms and 2 repeats on each pixel (details above, emission filter is BL HC 525/30).
- Postbleach: following the bleaching, imaging is continued as before for 400 times with 50 ms exposure time of 10-15% of the 488 nm laser (emission filter is BL HC 525/30).
Note: It is important to establish the appropriate laser exposure time and intensity before the FRAP experiment in a ‘not saturated fluorescence condition’ (Arbitrary units of fluorescence go from a range of 0 – 255. In order to have non- saturated conditions, the laser has to be set to an average saturation above 0 but below 255) to avoid excessive bleaching and allow fluorescence quantification for further analysis. This might mean that the image quality is rather poor.
- Prebleach: after focusing the cell of interest, a time-lapse of 50 images of a single plane of the nucleus is acquired with 50 ms exposure time with a 488 nm laser, at 10-15% (details see above, emission filter is BL HC 525/30).
- Analysis
- Briefly, a region of interest (ROI, see Figure 1) with a width of 5 pixels and a length roughly equal to the length of the nucleus, L, is drawn.
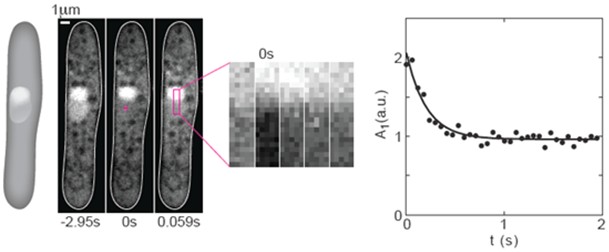
Figure 1. FRAP experiments on GFP in the nucleus of fission yeast. From left to right: A scheme and 3 images of a cell expressing NLS-GFP (strain PD31, Kalinina et al., 2013) before photobleaching (-2.95 s), just after photobleaching (0 s), and the subsequent image (0.059 s). The cross in the middle panel marks the center of the bleached region (2 x 2 pixels). A region of interest (ROI, magenta rectangle) was drawn along the nucleus. Next to the images of the cell, a time-lapse sequence of the enlarged ROI in consecutive images shows the recovery of the GFP. The graph on the right shows the temporal decay of the first Fourier mode. Circles indicate data points, the solid line is a 3-parameter fit (C++) to the function A1(t) = A1(0) exp(-π2Dt/L2) + offset. Here, A1 is the amplitude of the first Fourier mode, t is time, D is the diffusion coefficient, and L is the length of the bleached area. Figure was taken and modified from Kalinina et al. 2013.
- The intensities inside the ROI on each image of the movie are summed along the short axis of the ROI.
- The resulting one-dimensional fluorescence intensity profiles, corresponding to consecutive time points, are used to calculate the temporal decay of the first Fourier mode.
- The diffusion coefficient D was calculated from the decay rate of the amplitude of the first Fourier mode A1(t), as described by Elowitz et al. 1999. For this particular example we get a diffusion coefficient D = 3.7 μm2/s.
- Briefly, a region of interest (ROI, see Figure 1) with a width of 5 pixels and a length roughly equal to the length of the nucleus, L, is drawn.
Recipes
- Depending on the strain, the appropriate medium should be used. For imaging the transparent EMM is best (Forsburg and Rhind, 2006)
For 1 liter solution, weigh in the following components:
3 g/L Potassium hydrogen phthallate 14.7 mM
2.2 g/L
Na2HPO4
15.5 mM
5 g/L
NH4Cl
93.5 mM
20 g/L
Glucose
2% w/v
20 ml/L
Salts (see below, stock solutions)
1 ml/L
Vitamins (see below, stock solutions)
0.1 ml/L
Minerals (see below, stock solutions)
225 mg/L
Leucin (for PD31, which is auxotroph for Leucin)
Note: Taken and modified from: http://www-bcf.usc.edu/~forsburg/media.html.Salts: 50x Stock solution
Amount
Component
Final concentration
52.5 g/L
MgCl2.6H2O
0.26 M
0.735 g/L
CaCl2.2H2O
4.99 mM
50 g/L
KCl
0.67 M
2 g/L
Na2SO4
14.1 mM
Vitamins: 1,000x Stock
1 g/L
Pantothenic acid
4.20 mM
10 g/L
Nicotinic acid
81.2 mM
10 g/L
Inositol
55.5 mM
10 mg/L
Biotin
40.8 μM
Minerals: 10,000x Stock
5 g/L
Boric acid
80.9 mM
4 g/L
MnSO4
23.7 mM
4 g/L
ZnSO4.7H2O
13.9 mM
2 g/L
FeCl2.6H2O
7.40 mM
0.4 g/L
Molybdic acid
2.47 mM
1 g/L
KI
6.02 mM
0.4 g/L
CuSO4.5H2O
1.60 mM
10 g/L
Citric acid
47.6 mM
Acknowledgments
We thank E. Guarino and the Yeast Genetic Resource Center (YGRC, Japan) for strains and plasmids; the Light Microscopy Facility of MPI-CBG (Dresden, Germany) for discussions and advice; the German Research Foundation (DFG) and the Human Frontier Science Program for financial support. M.R.C. was supported by a Marie Curie Intra-European Fellowship. This protocol was adapted from Kalinina et al. (2013).
References
- Elowitz, M. B., Surette, M. G., Wolf, P. E., Stock, J. B. and Leibler, S. (1999). Protein mobility in the cytoplasm of Escherichia coli. J Bacteriol 181(1): 197-203.
- Forsburg, S. L. and Rhind, N. (2006). Basic methods for fission yeast. Yeast 23(3): 173-183.
- Kalinina, I., Nandi, A., Delivani, P., Chacon, M. R., Klemm, A. H., Ramunno-Johnson, D., Krull, A., Lindner, B., Pavin, N. and Tolic-Norrelykke, I. M. (2013). Pivoting of microtubules around the spindle pole accelerates kinetochore capture. Nat Cell Biol 15(1): 82-87.
Article Information
Copyright
© 2013 The Authors; exclusive licensee Bio-protocol LLC.
How to cite
Delivani, P., Chacón, M. R., Schroth-Diez, B. and Tolić-Nørrelykke, I. M. (2013). Fluorescence Recovery After Photobleaching (FRAP) in the Fission Yeast Nucleus. Bio-protocol 3(20): e941. DOI: 10.21769/BioProtoc.941.
Category
Cell Biology > Cell imaging > Fluorescence
Do you have any questions about this protocol?
Post your question to gather feedback from the community. We will also invite the authors of this article to respond.