- Protocols

- Articles and Issues
- For Authors
- About
- Become a Reviewer

Measurement of Junctional Protein Dynamics Using Fluorescence Recovery After Photobleaching (FRAP)


Published: Vol 3, Iss 20, Oct 20, 2013 DOI: 10.21769/BioProtoc.937 Views: 14516
Reviewed by: Lin FangFanglian HeAnonymous reviewer(s)
Original research article
The authors used this protocol in:

Aug 2012
Advertisement


Protocol Collections
Comprehensive collections of detailed, peer-reviewed protocols focusing on specific topics


Related protocols
Abstract
Fluorescence Recovery After Photobleaching (FRAP) (Lippincott-Schwartz et al., 2003; Reits and Neefjes, 2001) was employed to determine dynamic properties of proteins localized at the ephitelial zonula adherens (ZA) (Kovacs et al., 2011; Otani et al., 2006). The proteins of interest were expressed in cells using a knockdown and reconstitution approach in which endogenous proteins were depleted by RNA interference (RNAi) and replaced by expression of an RNAi-resistant gene fused to GFP (Priya et al., 2013; Smutny et al., 2010; Smutny et al., 2011; Vitriol et al., 2007). By choosing expression levels of GFP-tagged proteins that were comparable to endogenous levels, we minimized transient overexpression artifacts due to overcoming regulatory mechanisms that directly affect protein dynamics (Goodson et al., 2010). Using this approach, junctional E-cadherin-GFP or GFP-Ect2 were subjected to FRAP analysis in small areas corresponding to the ZA using confocal microscopy (Priya et al., 2013; Ratheesh et al., 2012; Gomez et al., 2005; Trenchi et al., 2009). Although in principle this approach is similar in every case, bleaching conditions, acquisition parameters and analysis details might differ depending on the time scale of the recovery process (Lippincott-Schwartz et al., 2003). In this protocol we will describe the experimental procedure to perform FRAP experiments and how to optimize bleaching and acquisition conditions for optimal measurements of protein dynamics at cell-cell junctions.
Keywords: E-cadherinMaterials and Reagents
- MCF-7 cells, mammary carcinoma epithelial cells derived from metastatic site (ATCC® HTB22 TM)
- HEK293T cells
- Plasmids
pLL5.0 lentiviral vector (Figure 1) and packaging plasmids pMDLg/pRRE, pMD2.G (VSV G) and pRSV-Rev. pLL5.0 is a modified version of pLL3.7 and it was generously provided by Jim Bear, Department of Cell and Developmental Biology, University of North Carolina, Chapel Hill, NC 27599 (Vitriol et al., 2007; Rubinson et al., 2003)
pLL5.0 containing both a shRNA against the ORF of human CDH1 (NM_004360) (5′-GGGTTAAGCACAACAGCAA-3′) cloned downstream of the U6 promoter (HpaI and XhoI) (Figure 1) and a mouse E-Cadherin(NM_009864)-GFP fusion construct cloned at SacII and SbfI sites. The E-cadherin-EGFP fusion protein expression was driven by a 5’LTR promoter to facilitate lower expression levels of GFP fusion proteins for imaging (Smutny et al., 2011 )
pLL5.0 containing both a shRNA against the 3’UTR of human ECT2 (NM_001258315) (5'-GCTGTTTCAAAGTGTGATA-3') and cloned downstream of the U6 promoter (HpaI and XhoI) (Figure 1) in a modified version of pLL5.0. In this modified pLL5.0 the GFP reporter was replaced by the sequence that encompasses both the coding region for GFP and the multiple cloning site of pEGFP-C1 (Clontech) using EcoRI and SbfI sites. These restriction sites were not preserved after this cloning step. Then the human ECT2 coding sequence (NM_001258315) was cloned into the vector using EcoR1 and BamH1 sites (pLL5.0 GFP–shRNA resistant ECT2)
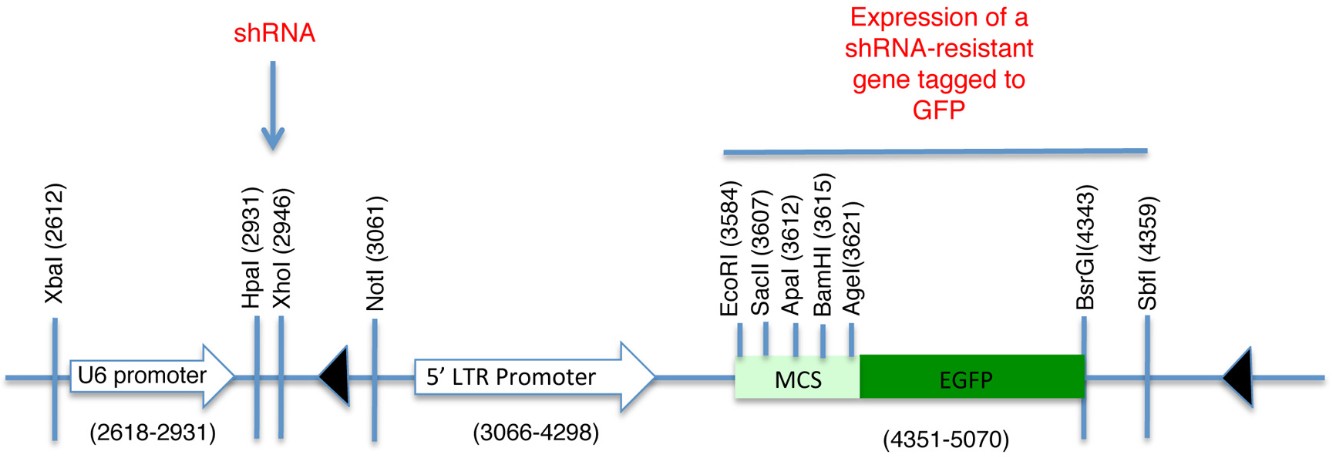
Figure 1. Schematic of pLL5.0 vector. Sites HpaI and XhoI are used for the subcloning of shRNA sequences desired to knockdown endogenous levels of the protein of interest. The U6 promoter drives the expression of this shRNA sequence. Contrarily, a shRNA resistant version of the same protein can be subcloned downstream of the 5’LTR promoter and fused to GFP. Thus, it is possible to achieve endogenous levels of expression for a fluorescent-tagged protein and preventing effects associated to its overexpression. MCS = Multiple cloning site
- Dulbecco’s Modified Eagle’s Medium High glucose with stable L-glutamine (DMEM) (Gibco, catalog number: 11995-073 )
- Foetal Bovine Serum (FBS) (Life Technologies, Gibco®, catalog number: 26140079 )
- Phosphate buffered saline (PBS) without Ca2+ and Mg2+ (Astral Scientific, catalog number: 09-8912-100 )
- 16% Paraformaldehyde (formaldehyde) (PFA) aqueous solution (ProSciTech, catalog number: C004 )
- Hank’s balanced salt solution (HBSS) (Sigma-Aldrich, catalog number: H8264 )
- In-Fusion cloning kit (Clontech, catalog number: 638909 )
- Hank’s Balanced Salt Solution (Sigma-Aldrich, catalogue number: H8264 )
- 2.5% Trypsin (10x) (Life Technologies, catalogue number: 15090046 )
Note: This solution is diluted to 0.25% final concentration with PBS.
- Poly(vinylidene difluoride) spin columns (Amicon Ultra Centrifugal filters, UltraCel-100K) (EMD Millipore, catalog number: UFC910024 )
- Sodium butyrate (Sigma-Aldrich, catalogue number: B5887 ) (see Recipes)
- Hexadimethine bromide (polybrene) (Sigma-Aldrich, catalog number: H9268 ) (see Recipes)
- Imaging media (see Recipes)
- 4% Paraformaldheyde in PBS (see Recipes)
Equipment
- 25 cm2 Nunclon Delta Flasks (Thermo Fisher Scientific, Nunc®, catalog number: 156367 )
- 175 cm2 Nunclon Delta Flasks (Thermo Fisher Scientific, Nunc®, catalog number: 159910 )
- Laser scanning confocal microscope equipped with acousto-optic tunable filters (AOTF) for bleaching of selected areas and heated chamber (37 °C) for live cell imaging. The microscope must also be equipped with dichroic and emission filter for the use of the 405 and 488 nm laser lines and detection of GFP fluorescence. The experiments shown were performed on LSM 510 Meta or LSM 710 inverted confocal microscopes (ZEISS)
- 30 mW Argon (458, 488 and 514 nm laser lines) and 25 mW (405 nm) diode lasers (LASOS Lasertechnik GmbH)
- Plug-in FRAP profiler (McMaster University, Canada)
- Glass bottom dishes (#1.5) (MatTek, catalog number: P35G-1.5-20-C or Shengyou Biotechnology, catalog number: D29-10-1.5-N)
Software
- Image J software
- Prism, GraphPad
- Matlab, MathWorks
Procedure
- Cell preparation
- Expression of GFP-tagged proteins in a knockdown background
We have used this approach in our recent article published in Nature Cell Biology (Ratheesh et al., 2012) to characterize the dynamic properties of the adhesion molecule E-cadherin and the RhoA GEF, Ect2. For the expression of these proteins at endogenous levels, we used the pLL5.0 lentiviral vector (Vitriol et al., 2007; Rubinson et al., 2003). This vector contains two promoters, a U6 promoter that drives the expression of shRNA and a 5’LTR promoter that drives the expression of a shRNA-resistant gene (Figure 1).
- Lentivirus preparation and viral transduction
- HEK293T cells were cultured in 20 ml DMEM supplemented with 10% FBS at 37 °C and maintained under these condition during the following steps.
- Constructs made in the pLL5.0 vector were simultaneously transfected with packaging vectors into HEK-293T cells by CaCl2 precipitation.
- 48 h after transfection, cells were treated with sodium butyrate (10 mM final concentration) to increase gene induction.
- Virus-like particles (VLPs) were harvested 48–72 h after transfection and concentrated on poly(vinylidene difluoride) spin column as follows:
- Collect media of cells and spin down in 50 ml conical tube.
- Filter the supernatant into new tubes using 0.2 μm syringe filters.
- Add 10 ml filtrate to the poly(vinylidene difluoride) spin column and centrifuge at 3,200 rpm on a bench top centrifuge for 20 min at room temperature. This will reduce the volume of the suspension of VLPs to ~800 μl per tube.
- Discard the flow trough and add the remaining supernatant (~10 ml) to the the poly(vinylidene difluoride) spin column and repeat the above step.
- Aliquots of virus were subsequently used for titration or stored at -80 °C. Titers were determined as described before (Smutny et al., 2010).
- Collect media of cells and spin down in 50 ml conical tube.
- HEK293T cells were cultured in 20 ml DMEM supplemented with 10% FBS at 37 °C and maintained under these condition during the following steps.
- Preparation of the cells for image acquisition
- For FRAP experiments, MCF-7 cells were cultured in DMEM supplemented with 10% FBS and infected with lentiviral particles at a multiplicity of infection of 10 per cell on 25 cm2 flasks.
- Cells were incubated at 37 °C with the lentivirus in DMEM + FBS and Polybrene (8 μg ml-1) and harvested by trypsinization three days after infection.
- Single-cell suspensions were seeded on glass bottom dishes at 80% confluence and allowed to grow for 48 h (or until they reach full confluence) for FRAP experiments.
- Prior to image acquisition, cells were washed with imaging media and incubated with 1.5 ml of it for the duration of the experiment.
- For FRAP experiments, MCF-7 cells were cultured in DMEM supplemented with 10% FBS and infected with lentiviral particles at a multiplicity of infection of 10 per cell on 25 cm2 flasks.
- Expression of GFP-tagged proteins in a knockdown background
- Image Acquisition
- FRAP experiments were performed on a LSM 510 Meta or LSM 710 Zeiss confocal microscope for E-cadherin-GFP or GFP-Ect2, respectively. Microscopes were equipped with a heated stage maintained at 37 °C and a 30 mW Argon laser (458, 488 and 514 nm laser lines). The LSM 710 Zeiss confocal microscope was also equipped with a 405 nm (25 mW) diode laser. Images (pre and post-bleach, Figure 1) were acquired using 60x objective, 1.4 NA oil Plan Apochromat immersion lens at 4x digital magnification with 0.7 μm optical section. A 488 nm laser line of an argon laser (30 mW) was used for fluorescence excitation at 1-3% transmission.
- For E-cadherin-GFP dynamics, time-lapse images (416 x 416 pixels, 0.086 μm/pixel) were acquired before and after photobleaching with an interval of 5 seconds per frame for the total time of 280 seconds (Figure 1A). A constant region of interest (ROI) of 2.8 x 1.7 μm with the longer axis parallel to the cell-cell contact was marked for each experiment and E-cadherin-GFP was bleached with 50 iterations of the 488 nm laser with 100% transmission. This resulted in maximum bleach of approximately 70%.
- Ect2 dynamics was assessed using GFP-Ect2 co-expressed with Ect2 shRNA by lentiviral infection. A constant circular ROI (1.4 μm diameter) in approximately the center of the cell-cell contact was bleached to ~ 70% with both the 488 and the 405 nm lasers turned on simultaneously at 100% transmission. Time-lapse images of the same region were acquired before (20 frames, 5 seconds) and after (210 frames, 50 seconds) photobleaching with an interval of ~ 250 m per frame (Figure 1B).
- For these experiments, cells with slanted contacts were chosen which allowed us to precisely identify and photobleach the ZA.
Special considerations
- For any experimental setup, it is important to consider that the bleaching process and the frequency of acquisition has to match the dynamics of the protein of interest (Lippincott-Schwartz et al., 2003; Weiss, 2004). The above technical details should be first be tested to achieve the optimal conditions for FRAP experiments of specific proteins or for different subcellular compartments. Bleaching and acquisition conditions can be optimized by doing FRAP in fixed cells. We routinely grow cells on glass bottom dishes and fix using 4% PFA in PBS for 15 min at room temperature. After fixation, PFA solution is replaced by imaging media and the FRAP protocols tested on this set of cells. Following this approach, optimization can be achieved in conditions that match the real experimental setup.
The major aims of these optimization experiments are to:
- Determine the best conditions suitable for a fast and efficient photobleaching of molecules in a region of interest that would be used in the real experiments.
- Optimize the time-lapse settings for acquisition during pre- and, more importantly, post- bleaching regimes. The main aim is to acquire images without causing photobleaching (< ~5%) of the sample at a given frequency that does not compromise FRAP analysis.
- Determine the best conditions suitable for a fast and efficient photobleaching of molecules in a region of interest that would be used in the real experiments.
- Following the optimization steps, a FRAP test is performed in living cells. There are two important points that needs to be considered that are related to the half time of the observed recovery process (Weiss, 2004). Firstly, if the half time is comparable to the bleaching step, then there is a high chance that recovery is underestimated as bleached molecules can diffuse away from the bleached area during the bleaching step (Weiss, 2004). If so, it is necessary to optimize the bleaching protocol to make this step faster (~< 3 times the half time of recovery). This can be achieved for example, by reducing the area of the region that is wanted to be bleached or, by increasing the laser power and reducing the number of iterations during the bleaching step or, by increasing the number of laser lines activated during the bleaching step or, by reducing the scan speed of the bleaching step at the same time the number of iterations it is also reduced. The conditions mentioned for the bleaching step of E-cadherin and Ect2 are good standard initial conditions to perform FRAP experiments on proteins that exhibits very distinctive dynamics. Secondly, slow post acquisition frames can compromise recovery measurements. As the half time of a FRAP curve is calculated with the information acquired during the first 1.5 half times of the recovery process, confident estimation of FRAP parameters requires that acquisition be fast enough to accurately sample this early period. To satisfy this requirement, increasing scan speed or reducing the area of sampling during pre and postbleaching acquisition can increase the speed of acquisition. This second option was chosen in order to capture the fast dynamics of Ect2 mobility.
- After these conditions are set, it is essential to consider that the optimized protocol does not compromise the viability of cells. Normally, UV irradiation causes toxicity, which is evident by changes in the morphology of the cell and membrane blebbing (Frigault et al., 2009). Acquisition of phase contrast or Differential interference contrast (DIC) images before and after FRAP acquisition is a complementary test to assess cell viability. Of note, UV irradiation can cause membrane damage that often results in an unexpectedly high immobile fraction. For this, it has been suggested to perform 2 consecutive FRAP experiments on the same cells and on the same region, in order to determine that recovery occurs even after two consecutive rounds of photobleaching (Lippincott-Schwartz et al., 2003).
- For any experimental setup, it is important to consider that the bleaching process and the frequency of acquisition has to match the dynamics of the protein of interest (Lippincott-Schwartz et al., 2003; Weiss, 2004). The above technical details should be first be tested to achieve the optimal conditions for FRAP experiments of specific proteins or for different subcellular compartments. Bleaching and acquisition conditions can be optimized by doing FRAP in fixed cells. We routinely grow cells on glass bottom dishes and fix using 4% PFA in PBS for 15 min at room temperature. After fixation, PFA solution is replaced by imaging media and the FRAP protocols tested on this set of cells. Following this approach, optimization can be achieved in conditions that match the real experimental setup.
- FRAP experiments were performed on a LSM 510 Meta or LSM 710 Zeiss confocal microscope for E-cadherin-GFP or GFP-Ect2, respectively. Microscopes were equipped with a heated stage maintained at 37 °C and a 30 mW Argon laser (458, 488 and 514 nm laser lines). The LSM 710 Zeiss confocal microscope was also equipped with a 405 nm (25 mW) diode laser. Images (pre and post-bleach, Figure 1) were acquired using 60x objective, 1.4 NA oil Plan Apochromat immersion lens at 4x digital magnification with 0.7 μm optical section. A 488 nm laser line of an argon laser (30 mW) was used for fluorescence excitation at 1-3% transmission.
- Image analysis
- E-cadherin Turnover
Image analysis was performed using Image J software. Noise on images was reduced by applying a median filter of 2 pixels radii. As E-cadherin dynamics at the ZA is relatively slow (in our experience, a FRAP experiment takes ~10 min to plateau), it is inevitable that some cell movements and/or drift occur during image acquisition. If these movements really compromise the measurements, then the experiment is discarded. However, those experiments with slight cell movements can be corrected and/or eliminated by aligning consecutive frames using Turbo-reg (http://bigwww.epfl.ch/thevenaz/turboreg/) plug-in of Image J. After that, FRAP profiles were calculated using a ROI marked at the bleached area and use the plug-in FRAP profiler to obtain fluorescence intensity profiles. Fluorescence intensities in the ROI immediately after bleaching (F(0)) were subtracted from fluorescence intensities at all times (F(t)) and results were then normalized to pre-bleaching values (Eq.1, Figure 2A). Results were then imported into Prism software for statistics analysis. Data from 11 replicates (3 independent experiments) were pooled and fluorescence intensity at time points after the bleaching step were fitted to the equation:
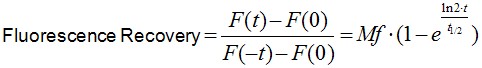 (Eq.1)
where F(t), F(-t) and F(0) are the average fluorescence of the ROI at any time, before bleaching and, immediately after bleaching, respectively. Mf is the mobile fraction, t1/2 is the half time of recovery and t is time in seconds. In Prism, this fitting is achieved by using non-linear regression and the exponential one-phase association model using Y0 = 0 and where Mf corresponds to the plateau value. Data then are presented as the average ± SEM and the statistical significance assessed by t-test.
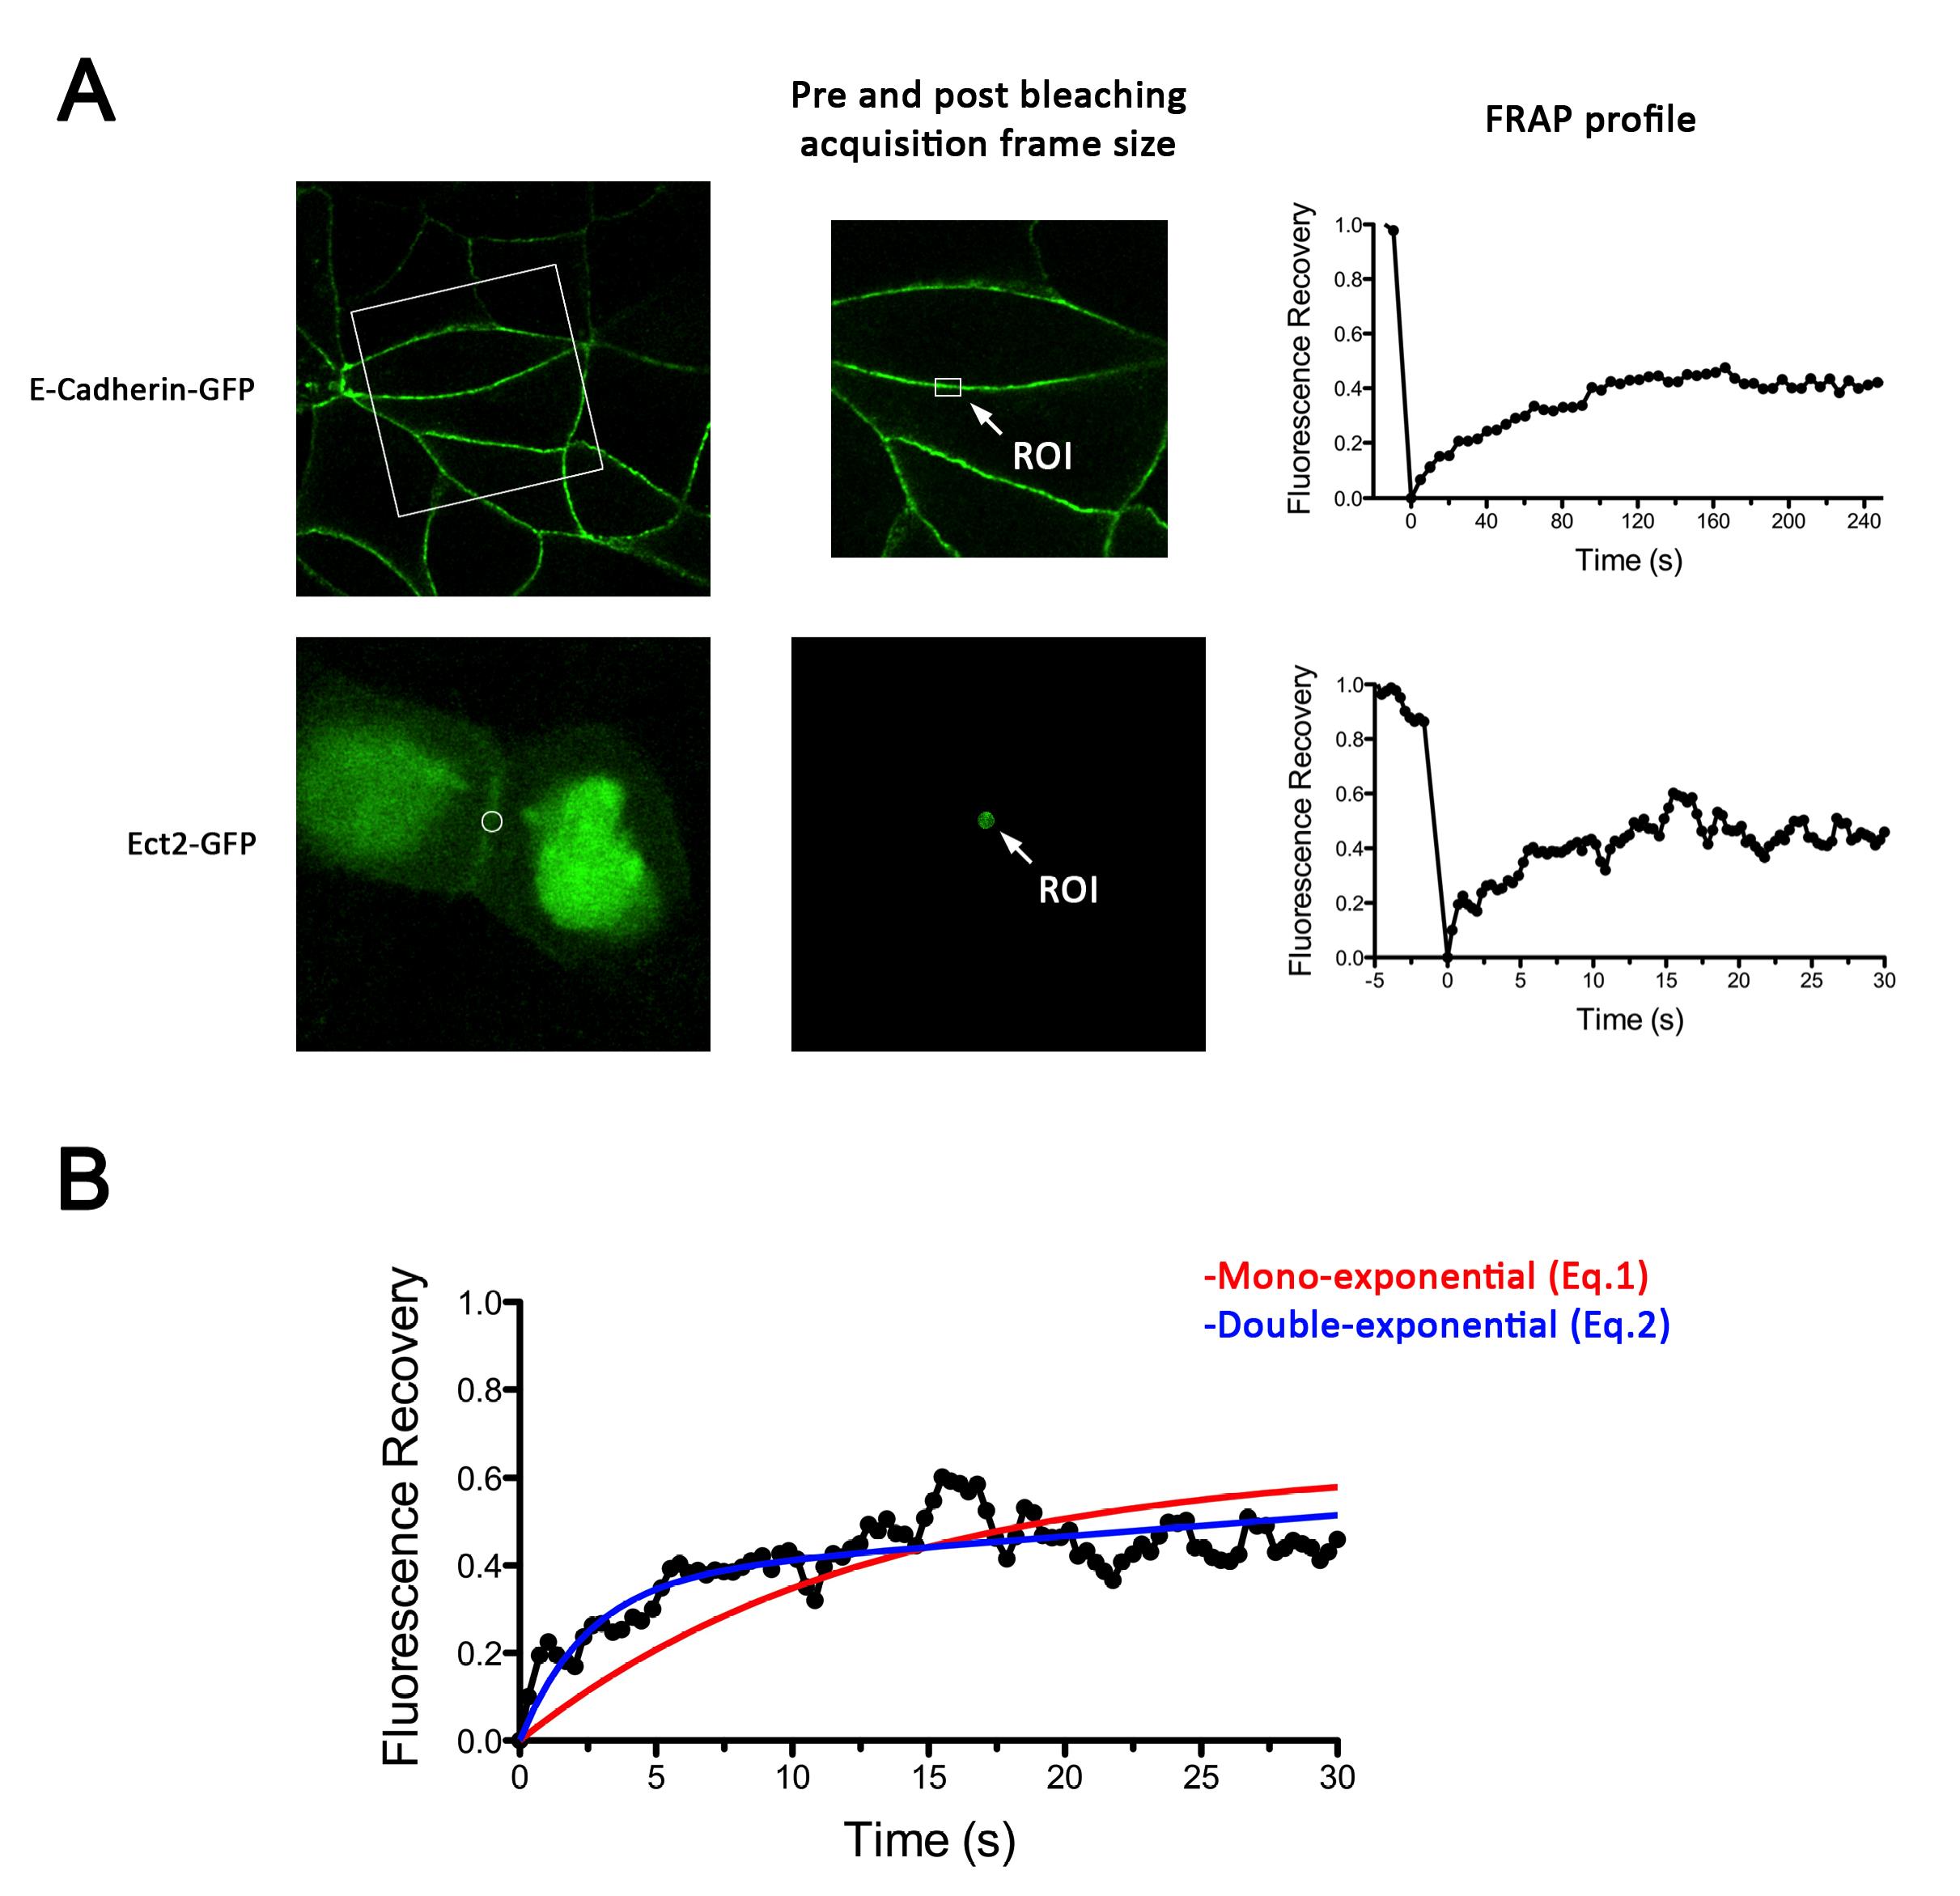
Figure 2. Examples of E-cadherin-GFP and GFP-Ect2 FRAP experiments. A. Left, Representative images using MCF-7 cells of the subcellular distribution of E-cadherin-GFP and GFP-Ect2 expressed in E-cadherin and Ect2 knockdown backgrounds, respectively. Center, details of acquisition frames during pre (shown) and post bleaching (not shown) stages during a FRAP experiment. Right, Fluorescence recovery plots for E-cadherin-GFP (top graph) and GFP-Ect-2 (bottom graph). Note the difference in time scales. B. Details of non-linear regression of GFP-Ect2 recovery plot using either mono-exponential (Eq.1) or double exponential (Eq.2) functions. This shows that a mono exponential function does not adjust properly to the experimental curve.
- Ect2 Turnover
Image analysis was also performed using Image J software. It is worth to mentioning that an Ect2 FRAP experiment takes ~1 min, therefore no significant drifts or cell movements were observed. To calculate FRAP profiles, a ROI at the bleached GFP-Ect2 area was marked and its average fluorescence determined at every time point using the measure stack plugin in Image J software. Fluorescence intensities were treated as described above for E-cadherin-GFP to obtain recovery plots and data fitted to the double exponential equation (Figure 2B):
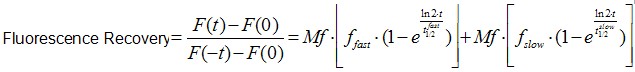 (Eq.2)
F(t) is the average fluorescence of the ROI, Mf is the mobile fraction, ffast and fslow are weighting factors for fast and slow mobile components, and
and  their respective half times and t is time in seconds. In Prism, this fitting is achieved by using non-linear regression and the exponential two-phase association model using Y0 = 0 and where the plateau value corresponds to Mf.
For this case, a numerical solution to obtain the t value at which Fluorescence Recovery = 0.5 was applied to obtain the global half time for Ect2 recovery. This was performed in Matlab (MathWorks, Australia) as follows. Values from fitting can be introduced as:
>>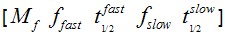 (In the brackets real values are introduced)
And then calculate the global t1/2 using the FRAPtwo function (see below) and the following sentence:
>> t1/2 = fzero(@(t) FRAPtwo(Parameters,t),7);
Data are then presented as the average ± SEM and the statistical significance assessed by t-test.
The following is the description of the Matlab function used for calculation of t1/2.function [ y ] = FRAPtwo(X,t);
plateau=X(1);
fractionfast=X(2);
Kfast=ln(2)/X(3);
fractionslow=X(4);
Kslow=ln(2)/X(5);
y=plateau*fractionfast*(1-exp(-Kfast*t))+plateau*fractionslow*(1-exp(-Kslow*t))-(plateau/2);
end
- E-cadherin Turnover
Recipes
- Sodium butyrate
A 1 M stock solution of Sodium butyrate is prepared in water
Filter sterilized
Stored at 4 °C previous to use
- Hexadimethine bromide (polybrene)
A stock solution of polybrene is made by diluting it into water to a final stock concentration of 8 mg/ml
Sterilizing by filtering trough a 0.2 μm filter
- Imaging media
Hank’s balanced salt solution supplemented with 10 mM HEPES pH 7.4
5 mM CaCl2
- 4% Paraformaldehyde in PBS
Prepare by dilution of the stock solution (16% formaldehyde)
Adjust pH to 7 with HCl or NaOH if necessary using pH indicator papers
Aliquot dilutions and store at -20 °C
Acknowledgments
This work was supported by the The Kids Cancer Project of The Oncology Children’s Foundation, The University of Queensland Early Career Grant (2012003354) to GAG. RP is supported by UQI (UQ International) Ph.D. Scholarship and ANZ Trustees Ph.D. Scholarship in Medical Research. Confocal microscopy was performed at the ACRF/IMB Cancer Biology Imaging Centre established with the generous support of the Australian Cancer Research Foundation.
References
- Frigault, M. M., Lacoste, J., Swift, J. L. and Brown, C. M. (2009). Live-cell microscopy - tips and tools. J Cell Sci 122(Pt 6): 753-767.
- Gomez, G. A. and Daniotti, J. L. (2005). H-Ras dynamically interacts with recycling endosomes in CHO-K1 cells: involvement of Rab5 and Rab11 in the trafficking of H-Ras to this pericentriolar endocytic compartment. J Biol Chem 280(41): 34997-35010.
- Goodson, H. V., Dzurisin, J. S. and Wadsworth, P. (2010). Methods for expressing and analyzing GFP-tubulin and GFP-microtubule-associated proteins. Cold Spring Harb Protoc 2010(9): pdb top85.
- Kovacs, E. M., Verma, S., Ali, R. G., Ratheesh, A., Hamilton, N. A., Akhmanova, A. and Yap, A. S. (2011). N-WASP regulates the epithelial junctional actin cytoskeleton through a non-canonical post-nucleation pathway. Nat Cell Biol 13(8): 934-943.
- Lippincott-Schwartz, J., Altan-Bonnet, N. and Patterson, G. H. (2003). Photobleaching and photoactivation: following protein dynamics in living cells. Nat Cell Biol Suppl: S7-14.
- Otani, T., Ichii, T., Aono, S. and Takeichi, M. (2006). Cdc42 GEF Tuba regulates the junctional configuration of simple epithelial cells. J Cell Biol 175(1): 135-146.
- Priya, R., Yap, A. S. and Gomez, G. A. (2013). E-cadherin supports steady-state Rho signaling at the epithelial zonula adherens. Differentiation.
- Ratheesh, A., Gomez, G. A., Priya, R., Verma, S., Kovacs, E. M., Jiang, K., Brown, N. H., Akhmanova, A., Stehbens, S. J. and Yap, A. S. (2012). Centralspindlin and α-catenin regulate Rho signalling at the epithelial zonula adherens. Nat Cell Biol 14(8): 818-828.
- Reits, E. A. and Neefjes, J. J. (2001). From fixed to FRAP: measuring protein mobility and activity in living cells. Nat Cell Biol 3(6): E145-147.
- Rubinson, D. A., Dillon, C. P., Kwiatkowski, A. V., Sievers, C., Yang, L., Kopinja, J., Rooney, D. L., Zhang, M., Ihrig, M. M., McManus, M. T., Gertler, F. B., Scott, M. L. and Van Parijs, L. (2003). A lentivirus-based system to functionally silence genes in primary mammalian cells, stem cells and transgenic mice by RNA interference. Nat Genet 33(3): 401-406.
- Smutny, M., Cox, H. L., Leerberg, J. M., Kovacs, E. M., Conti, M. A., Ferguson, C., Hamilton, N. A., Parton, R. G., Adelstein, R. S. and Yap, A. S. (2010). Myosin II isoforms identify distinct functional modules that support integrity of the epithelial zonula adherens. Nat Cell Biol 12(7): 696-702.
- Smutny, M., Wu, S. K., Gomez, G. A., Mangold, S., Yap, A. S. and Hamilton, N. A. (2011). Multicomponent analysis of junctional movements regulated by myosin II isoforms at the epithelial zonula adherens. PLoS One 6(7): e22458.
- Trenchi, A., Gomez, G. A. and Daniotti, J. L. (2009). Dual acylation is required for trafficking of growth-associated protein-43 (GAP-43) to endosomal recycling compartment via an Arf6-associated endocytic vesicular pathway. Biochem J 421(3): 357-369.
- Vitriol, E. A., Uetrecht, A. C., Shen, F., Jacobson, K. and Bear, J. E. (2007). Enhanced EGFP-chromophore-assisted laser inactivation using deficient cells rescued with functional EGFP-fusion proteins. Proc Natl Acad Sci U S A 104(16): 6702-6707.
- Weiss, M. (2004). Challenges and artifacts in quantitative photobleaching experiments. Traffic 5(9): 662-671.
Article Information
Copyright
© 2013 The Authors; exclusive licensee Bio-protocol LLC.
How to cite
Priya, R. and Gomez, G. A. (2013). Measurement of Junctional Protein Dynamics Using Fluorescence Recovery After Photobleaching (FRAP). Bio-protocol 3(20): e937. DOI: 10.21769/BioProtoc.937.
Category
Cell Biology > Cell imaging > Fluorescence
Cell Biology > Cell imaging > Confocal microscopy
Do you have any questions about this protocol?
Post your question to gather feedback from the community. We will also invite the authors of this article to respond.