

Accurate Identification of Cell Cycle Stages in RPE1 Cells Using the ImmunoCellCycle-ID Method
基于ImmunoCellCycle-ID方法精准识别RPE1细胞的细胞周期阶段
发布: 2025年08月05日第15卷第15期 DOI: 10.21769/BioProtoc.5407 浏览次数: 2188
评审: Nikhil MittalXi FengAnonymous reviewer(s)
参见作者原研究论文
The authors used this protocol in:
Nov 2024
Advertisement


Abstract
Accurate identification of cell cycle stages is essential for investigating fundamental biological processes such as proliferation, differentiation, and tumorigenesis. While flow cytometry remains a widely used technique for such analyses, it is limited by its lack of single-cell resolution and its requirement for large sample sizes due to its population-based approach. These limitations underscore the need for alternative or complementary methods that offer single-cell precision with compatibility for small-scale applications. We present ImmunoCellCycle-ID, an immunofluorescence-based method that leverages the spatial distribution of endogenous markers, such as DNA, proliferating cell nuclear antigen (PCNA), centromere protein F (CENP-F), and centromere protein C (CENP-C), to reliably distinguish G1, early S, late S, early G2, late G2, and all mitotic sub-stages. This technique does not rely on precise signal quantification and utilizes standard immunofluorescence protocols alongside conventional laboratory microscopes, ensuring broad accessibility. Importantly, ImmunoCellCycle-ID detects endogenous proteins without the need for genetic modification, making it readily applicable to a wide range of human cell lines. Beyond its utility for single-cell resolution, the method can be scaled for population-level analyses, similar to flow cytometry. With its precision, versatility, and ease of implementation, ImmunoCellCycle-ID offers a powerful tool for high-resolution cell cycle profiling across diverse experimental platforms.
Key features
• Enables high-precision identification of cell cycle stages at single-cell resolution.
• Broadly applicable to diverse human cell lines without genetic modification.
• Fully compatible with standard fluorescence microscopy; no specialized equipment needed.
• Requires only minimal image analysis and no complex quantification.
Keywords: Cell cycle (细胞周期)
Background
Understanding the temporal regulation of cell cycle progression provides critical insight into cellular proliferation, differentiation, and the mechanisms driving pathological states, such as carcinogenesis [1–3]. Traditional flow cytometry has long been the standard for analyzing cell cycle distribution by quantifying DNA content [4,5]. While widely adopted, this method has key limitations. It relies on population-based measurements, necessitates large sample sizes, and poses technical challenges for achieving single-cell cell cycle stage identification and resolving sub-stages within the cell cycle.
Several earlier methods have aimed to improve upon conventional cell cycle analysis. One widely used approach is the FUCCI (fluorescent ubiquitination-based cell cycle indicator) system, which enables live-cell cell cycle identification by utilizing fluorescently tagged Cdt1 and Geminin [6–8]. The commonly used FUCCI system distinguishes G1 from S/G2/M phases. However, it requires transgenic expression and live-cell imaging, limiting its accessibility and broad applicability. Alternatively, EdU- or BrdU-based labeling assays with flow cytometry or microscopy provide improved detection of the S phase by identifying incorporated nucleotide analogs into replicating DNA [5]. However, these approaches require careful optimization of incorporation timing and duration and may introduce cytotoxic effects.
To overcome these limitations, the ImmunoCellCycle-ID method was developed (Figure 1) [1]. This method leverages immunofluorescence-based techniques using four endogenous markers, DNA, proliferating cell nuclear antigen (PCNA), centromere protein F (CENP-F), and centromere protein C (CENP-C), to enable high-resolution cell cycle identification at the single-cell level. Remarkably, it allows identification of G1, early S, late S, early G2, late G2, and sub-stages of M phase.
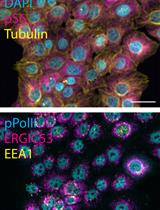
PCNA, a key factor in DNA replication, displays distinct nuclear localization patterns across the cell cycle [1,9]. In the G1 phase, PCNA is uniformly distributed within the nucleus. In the early S phase, it forms distinct small puncta, which then grow into larger aggregates during the late S phase, return to a uniform distribution in the G2 phase, and become markedly reduced during mitosis (Figure 2) [1]. CENP-F, a kinetochore-associated protein, localizes to kinetochores from prophase through anaphase [1,10–13]. Interestingly, it begins accumulating in the nucleus from the S phase and progressively increases in the G2 phase, despite the underlying mechanism remaining unclear [1,13]. Therefore, co-staining with PCNA and CENP-F enables reliable identification of the G1, early S, late S, and G2 phases without requiring quantification. Specifically, G1 nuclei are CENP-F negative with weak, uniform PCNA; G2 nuclei are CENP-F positive with similarly uniform PCNA (Figure 2). The presence of PCNA nuclear puncta (early/late S phase) always coincides with CENP-F positivity, eliminating contamination from the G1 phase. CENP-C localizes to centromeric chromatin throughout the cell cycle [1,14,15] and serves as a marker for distinguishing between early and late G2 phases (Figure 2). In the early G2 phase, kinetochores remain closely paired within diffraction-limited distances, whereas in the late G2 phase, they separate into distinct paired foci (Figure 2) [1]. This morphological change allows accurate distinction between these two stages without quantification. Mitotic sub-stages can be readily identified based on characteristic DNA morphologies (Figure 2).
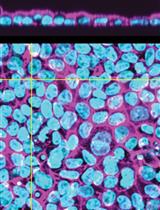
Overall, ImmunoCellCycle-ID offers a high-precision, user-friendly, and cost-effective alternative to traditional cell cycle analysis methods. It is flexible and compatible with co-labeling of additional cellular markers, enabling dynamic studies of target proteins throughout the cell cycle. Furthermore, with alternative markers, this method can be extended to include G0 phase identification [1,16,17]. In this protocol, we focus on identifying the G1, early S, late S, early G2, late G2, and M phases in asynchronous RPE1 cells using the standard ImmunoCellCycle-ID method. The RPE1 cell line was selected due to its non-transformed, normal epithelial origin, stable diploid karyotype, and wild-type p53 status, making it a widely used control model in cell cycle research. In our original manuscript [1], we demonstrated that the ImmunoCellCycle-ID method is not only effective in RPE1 cells but also robustly applicable to a variety of cell lines, including HCT116 (colon cancer), CAL-51 (triple-negative breast cancer), T47D (luminal A breast cancer), HeLa (cervical cancer), and U2OS (osteosarcoma), without the need for modifications to the staining protocol. A representative example of standard ImmunoCellCycle-ID images in asynchronous CAL-51 cells is shown in Figure 3.
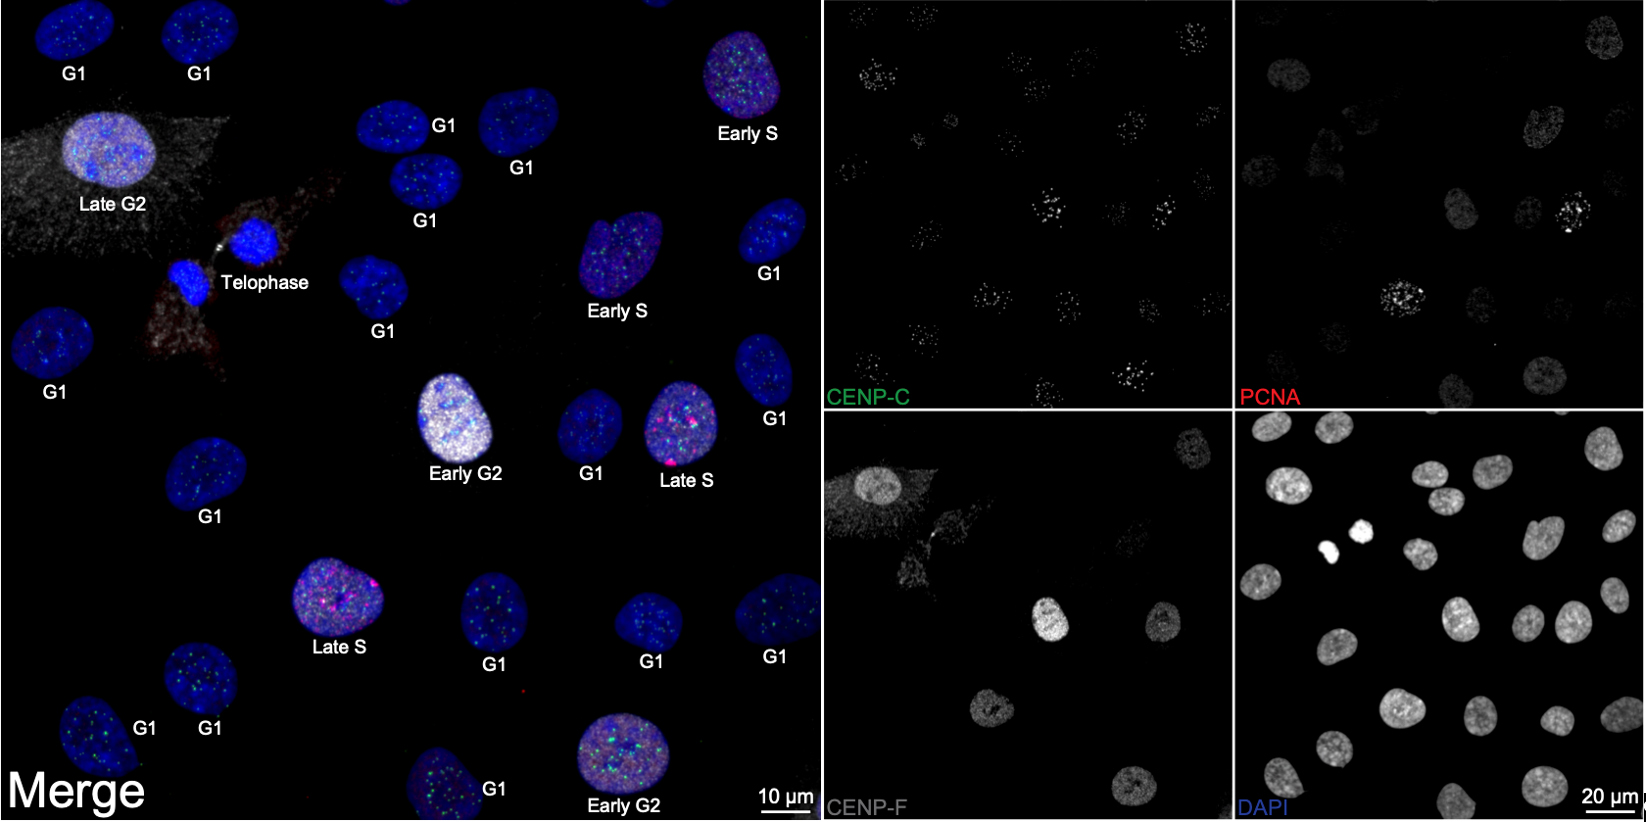
Figure 1. Cell cycle distribution in asynchronous RPE1 cells. Representative ImmunoCellCycle-ID images of asynchronous RPE1 cells, with corresponding identification of their cell cycle stages. All images were visualized using maximum z-projection.
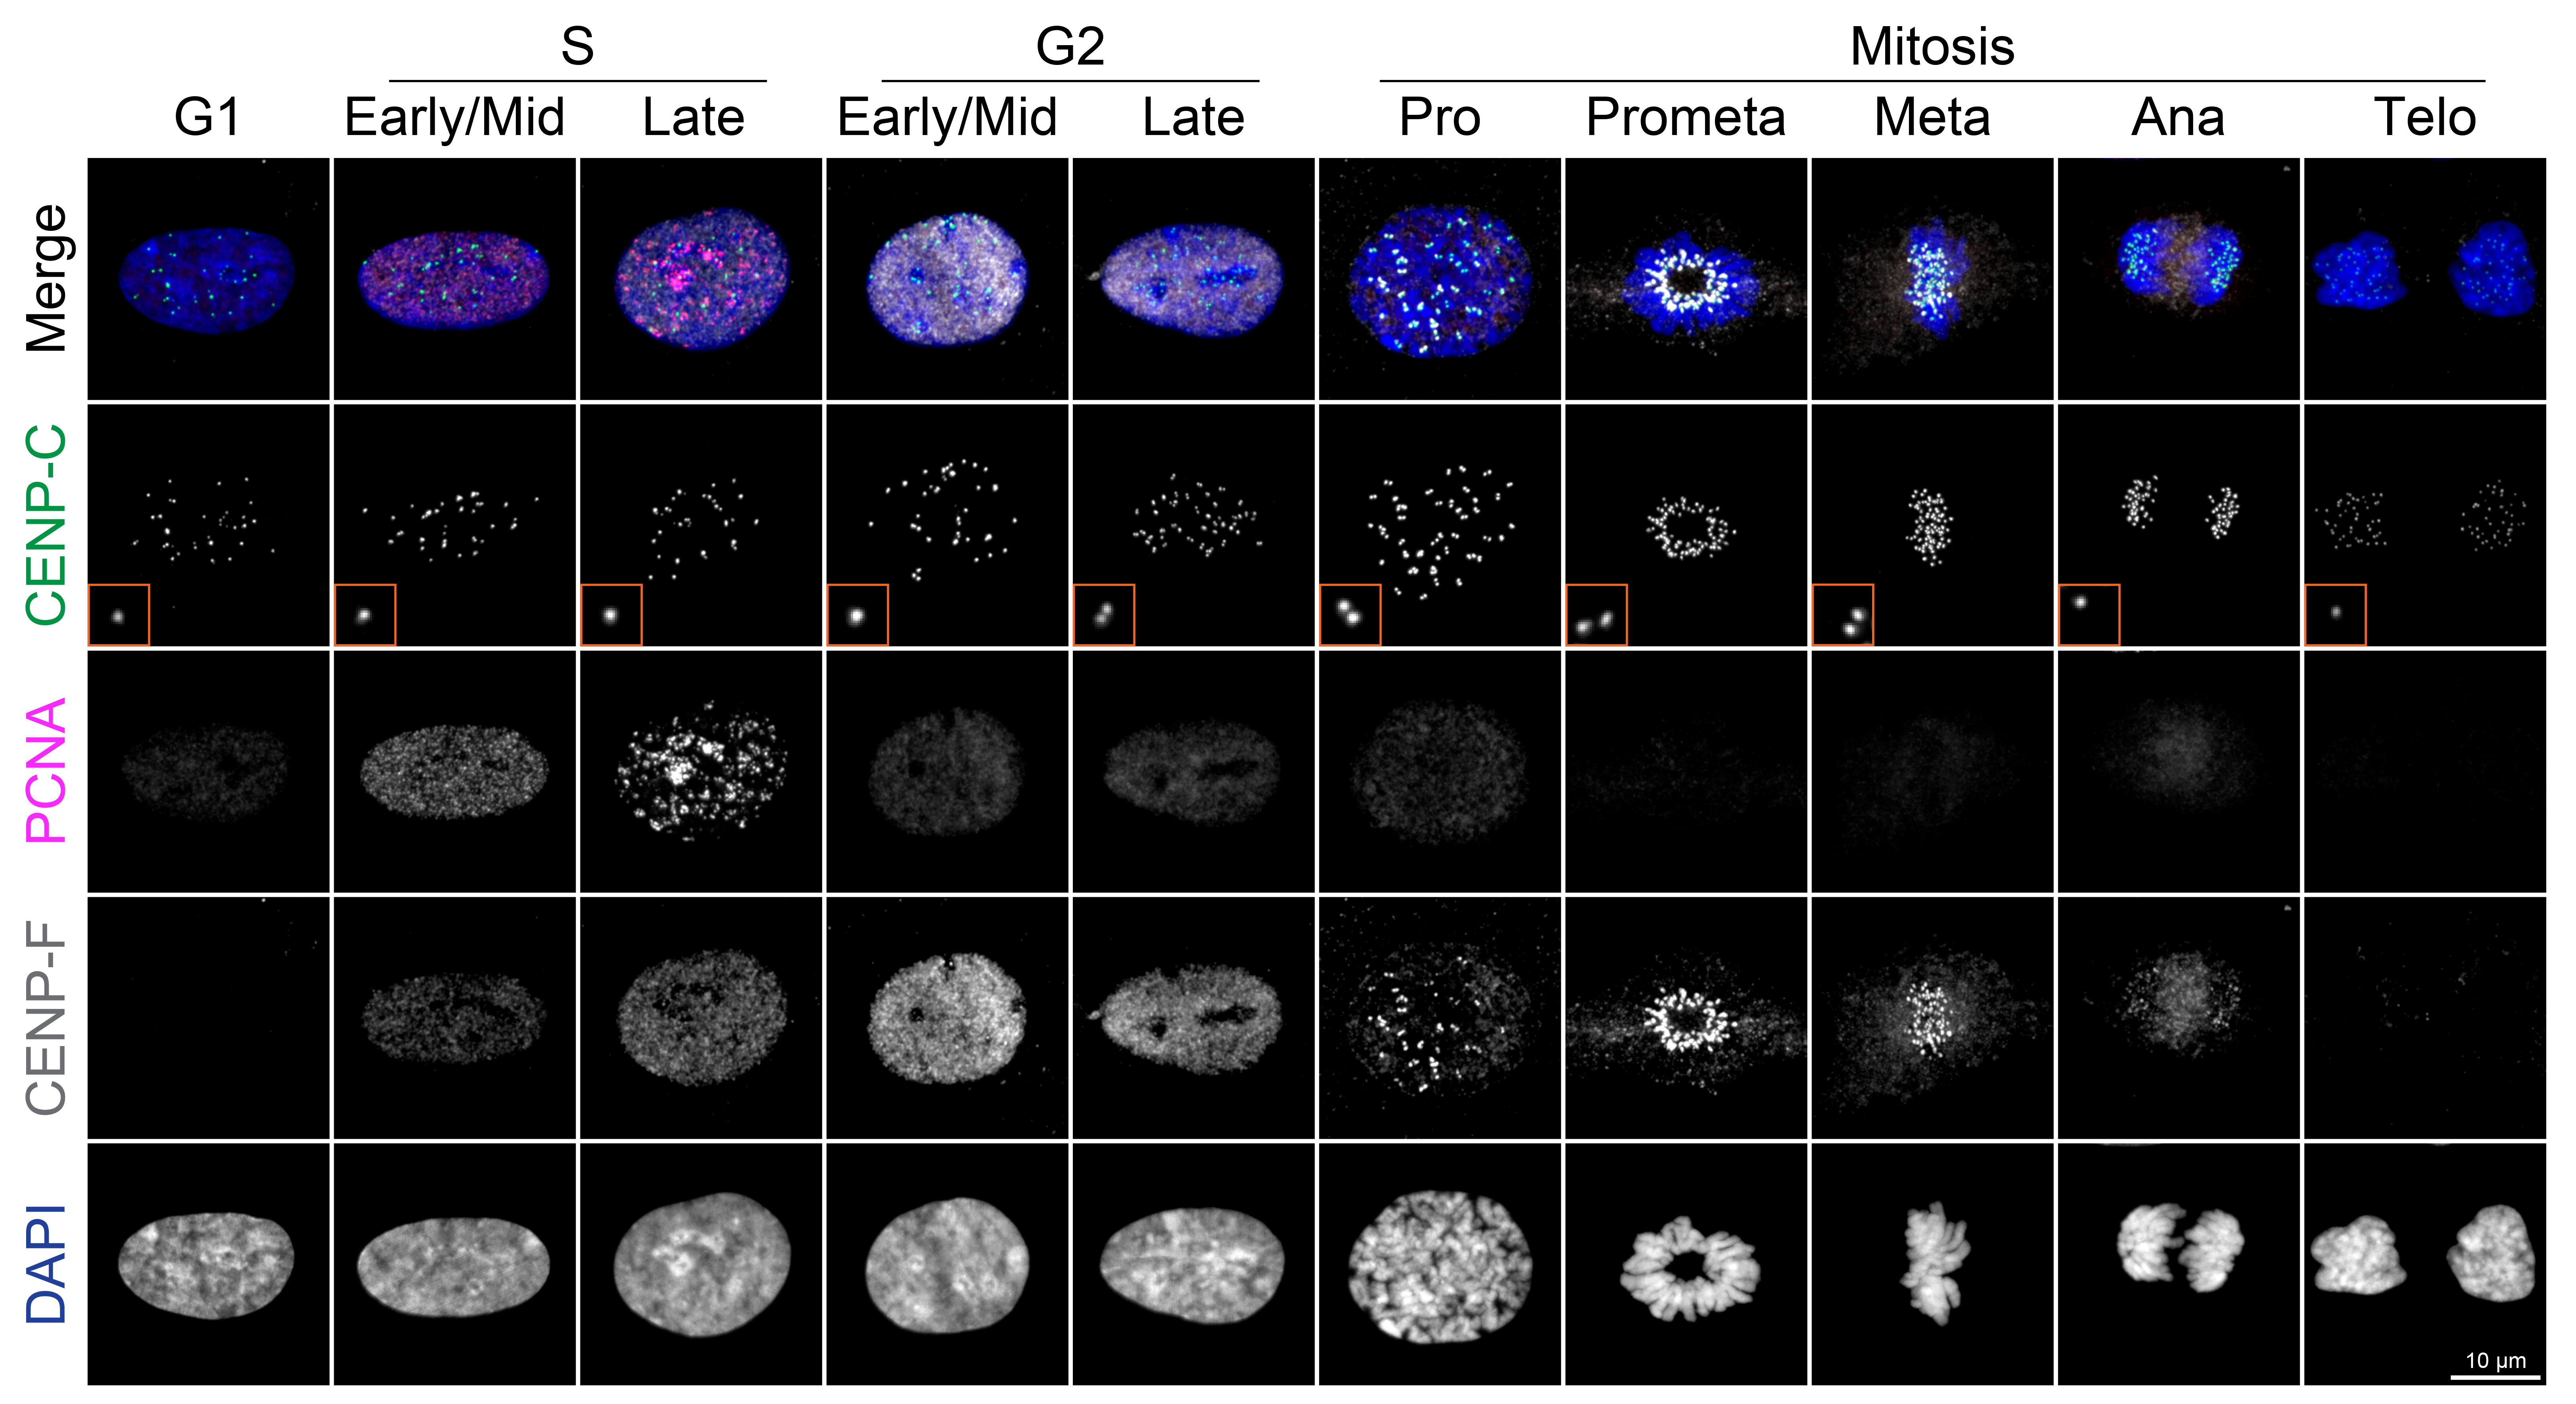
Figure 2. Representative ImmunoCellCycle-ID images for each cell cycle stage. Representative immunofluorescence images showing labeling of CENP-C, PCNA, CENP-F, and DAPI across all stages of the cell cycle. All images were adjusted to the same contrast settings across all cell cycle stages and visualized using maximum z-projection.
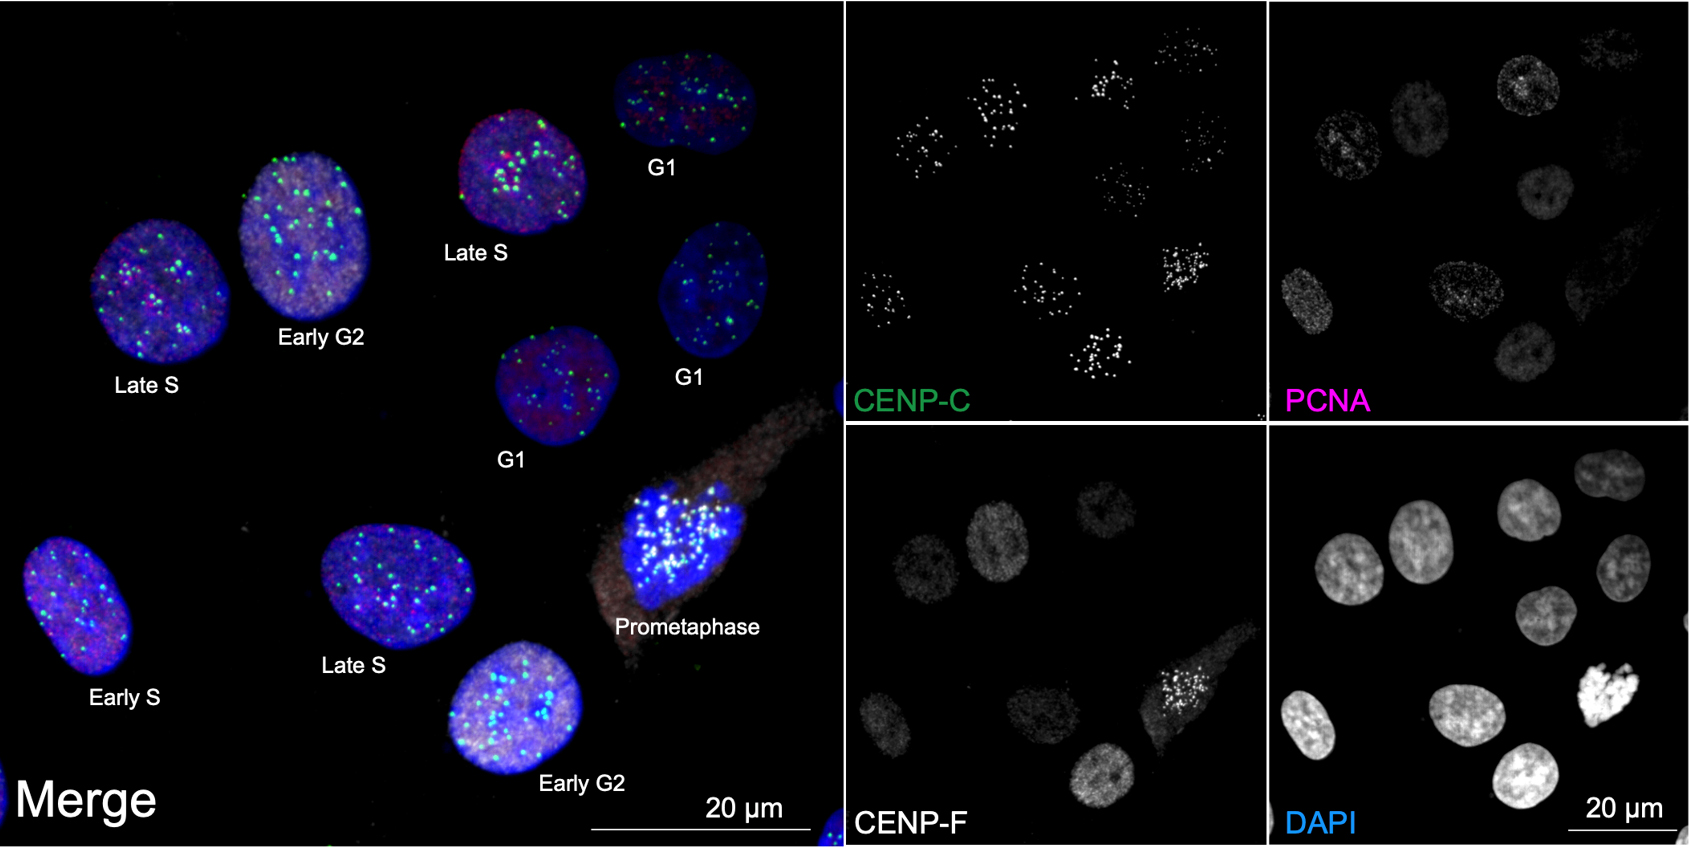
Figure 3. Cell cycle distribution in asynchronous CAL-51 cells. Representative ImmunoCellCycle-ID images of asynchronous CAL-51 cells, with corresponding identification of their cell cycle stages. All images were visualized using maximum z-projection.
Materials and reagents
Most plastics, coverslips, chemicals, and consumables do not need to be from the manufacturers listed and can be substituted with equivalent items you already have or can easily obtain. We recommend using #1.5 thick coverslips, preferably high-precision #1.5H coverslips, in any desired size and shape. The methods are robust and reproducible as long as the final concentrations and fixation/staining steps are followed accurately. Please ensure that the plasticware is appropriate for the coverslip size and adjust the volumes of solutions and reagents accordingly.
Biological materials
1. hTERT-immortalized retinal pigment epithelial RPE1 cell line (ATCC, RRID CVCL_4388, catalog number: CRL-4000)
2. Primary antibodies
a. Mouse PCNA (Santa Cruz, catalog number: sc-56, use with 1:1,000 dilution)
b. Rabbit CENP-F (Novus, catalog number: B-500-101, use with 1:2,000 dilution)
c. Guinea Pig CENP-C (MBL, catalog number: PD-030, use with 1:1,000 dilution)
d. DAPI (Sigma, catalog number: D9542, use with 3 µg/mL)
Note: Antibodies targeting CCAN proteins are generally effective; however, the use of anti-centromere antibody (ACA) is not recommended, as it primarily recognizes CENP-B, which localizes to the inner centromere. This can obscure the visualization of sister kinetochore separation (paired kinetochores), particularly during late G2 phase.
3. Secondary antibodies
a. Donkey anti-mouse Rhodamine Red X (Jackson ImmunoResearch, catalog number: 715-296-150, use with 1:600 dilution)
b. Donkey anti-rabbit Alexa 647 (Jackson ImmunoResearch, catalog number: 711-606-152, use with 1:600 dilution)
c. Donkey anti-guinea pig Alexa 488 (Jackson ImmunoResearch, catalog number: 706-546-148, use with 1:600 dilution)
Note: Any secondary antibodies with dye conjugations compatible with your imaging system can be used; however, it is crucial to select those that exhibit minimal cross-reactivity with the species in which the primary antibodies were raised.
Reagents
1. Dulbecco’s modified Eagle medium (DMEM) with high glucose, L-glutamine, phenol red (Gibco, catalog number: 11965092)
2. Fetal bovine serum (FBS) (Fisher, catalog number: SH3091003)
3. Penicillin-streptomycin (Thermo, catalog number: 10378016)
4. Dulbecco’s phosphate-buffered saline (DPBS), pH 7.0–7.3 (Gibco, catalog number: 14190144) (see General note 1)
5. Methanol, absolute (100%) (Fisher, catalog number: A412P-4)
6. Bovine serum albumin (BSA), fraction V (Sigma, catalog number: A5611)
7. Phosphate-buffered saline (PBS), pH 7.2–7.6 (Sigma, catalog number: P5493) (see General note 1)
8. Homemade mounting medium (90% glycerol) (Sigma, catalog number: G5516), 20 mM Tris pH 8.0 (Sigma, catalog number: 252859), 0.5% N-propyl gallate (Sigma, catalog number: P3130)
Note: Any commercially available mounting medium can be used; however, those containing DAPI are not recommended due to the potential for increased background fluorescence. Caution is also advised when using hard-setting mounting media, as they may induce shrinkage of cellular structures [18]. If such media are used, imaging should be performed immediately after mounting.
Solutions
1. Blocking solution (see Recipes)
Recipes
1. Blocking solution
0.1% BSA in PBS, prepared fresh
Laboratory supplies
1. Tissue culture plates (CytoOne, catalog number: CC7682-3340)
2. Coverslips with thickness of #1.5H (Marienfeld, catalog number: 0117520)
3. Pipette tips, sterile: 10 µL (TipOne, catalog number: 1111-3000), 200 µL (Olympus, catalog number: 24-172), 1,250 µL (TipOne, catalog number: 1112-1020)
4. Microcentrifuge tubes (DiagnoCine, catalog number: LD-MTC1500)
5. Humidity chamber (see General note 2)
Equipment
1. Tissue culture incubator (e.g., PHCbi, catalog number: MCO-170AICUVL)
2. Fluorescence microscope [confocal preferred, e.g., Nikon Ti2 microscope stand equipped with a Yokogawa CSU-W1 SoRa spinning disk confocal system with Uniformizer, a four-laser excitation system (405, 488, 561, and 640 nm), and a Hamamatsu Flash V2 camera]
3. 60× oil immersion objective, NA 1.40 (Nikon) (see General note 3)
Software and datasets
1. NIS-Elements (ver. 5.21, Nikon)
Note: Image analysis can be performed using any suitable software, including Image J.
Procedure
文章信息
稿件历史记录
提交日期: Apr 29, 2025
接收日期: Jul 1, 2025
在线发布日期: Jul 22, 2025
出版日期: Aug 5, 2025
版权信息
© 2025 The Author(s); This is an open access article under the CC BY-NC license (https://creativecommons.org/licenses/by-nc/4.0/).
如何引用
Reddy, S., Chen, Y. and Suzuki, A. (2025). Accurate Identification of Cell Cycle Stages in RPE1 Cells Using the ImmunoCellCycle-ID Method. Bio-protocol 15(15): e5407. DOI: 10.21769/BioProtoc.5407.
分类
细胞生物学 > 细胞活力 > 细胞增殖 > 细胞周期
细胞生物学 > 细胞成像 > 固定细胞成像
细胞生物学 > 单细胞分析
您对这篇实验方法有问题吗?
在此处发布您的问题,我们将邀请本文作者来回答。同时,我们会将您的问题发布到Bio-protocol Exchange,以便寻求社区成员的帮助。