

Method for Extracellular Electrochemical Impedance Spectroscopy on Epithelial Cell Monolayers
上皮细胞单层的胞外电化学阻抗谱测定方法
发布: 2025年06月20日第15卷第12期 DOI: 10.21769/BioProtoc.5341 浏览次数: 3296
评审: Wendy Leanne HempstockAnonymous reviewer(s)
Advertisement


Abstract
Epithelial tissues form barriers to the flow of ions, nutrients, waste products, bacteria, and viruses. The conventional electrophysiology measurement of transepithelial resistance (TEER/TER) can quantify epithelial barrier integrity, but does not capture all the electrical behavior of the tissue or provide insight into membrane-specific properties. Electrochemical impedance spectroscopy, in addition to measurement of TER, enables measurement of transepithelial capacitance (TEC) and a ratio of electrical time constants for the tissue, which we term the membrane ratio. This protocol describes how to perform galvanostatic electrochemical impedance spectroscopy on epithelia using commercially available cell culture inserts and chambers, detailing the apparatus, electrical signal, fitting technique, and error quantification. The measurement can be performed in under 1 min on commercially available cell culture inserts and electrophysiology chambers using instrumentation capable of galvanostatic sinusoidal signal processing (4 μA amplitude, 2 Hz to 50 kHz). All fits to the model have less than 10 Ω mean absolute error, revealing repeatable values distinct for each cell type. On representative retinal pigment (n = 3) and bronchiolar epithelial samples (n = 4), TER measurements were 500–667 Ω·cm2 and 955–1,034 Ω·cm2 (within the expected range), TEC measurements were 3.65–4.10 μF/cm2 and 1.07–1.10 μF/cm2, and membrane ratio measurements were 18–22 and 1.9–2.2, respectively.
Key features
• This protocol requires preexisting experience with culturing epithelial cells (such as Caco-2, RPE, and 16HBE) for a successful outcome.
• Builds upon methods by Lewallen et al. [1] and Linz et al. [2], integrating commercial chambers and providing a quantitative estimate of error.
• Provides code to run measurement, process data, and report error; requires access to MATLAB software, but no coding experience is necessary.
• Allows for repeated measurements on the same sample.
Keywords: Electrochemical impedance spectroscopy (电化学阻抗谱)Graphical overview
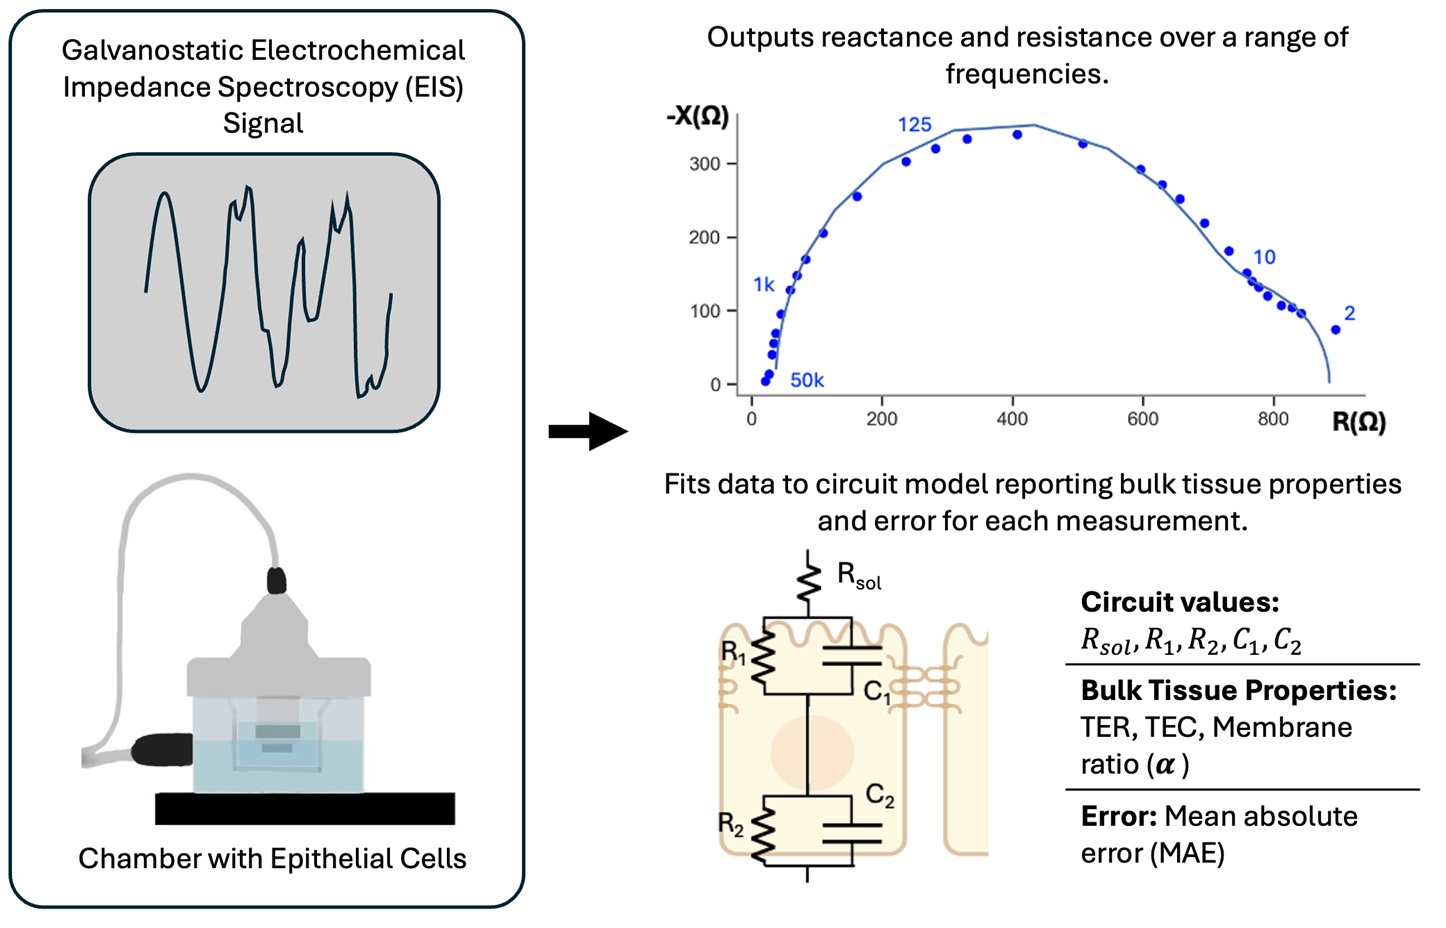
Electrochemical impedance spectroscopy measurement involves sending a galvanostatic signal through the electrophysiology chamber and across the epithelial cell monolayer (left) and results in complex impedance data at each frequency. This data is then fit to an electrical circuit model to output transepithelial resistance (TER), transepithelial capacitance (TEC), and membrane ratio (α) (right).
Background
Epithelial electrophysiology can provide insight into epithelial barrier function by measuring the electrical properties associated with the transport of ions, nutrients, and waste products [3,4]. Furthermore, transport across the tissue can be perturbed by blocking and activating ion channels or degrading tight junctions formed between the cells to isolate specific pathways or channels. This perturbation is useful for understanding healthy and diseased models, testing therapeutics, and characterizing quality control of in vitro cultures [1,5,6].
Transepithelial resistance (TER; also known as transepithelial electrical resistance, TEER) has become the gold standard over the last 30 years for quantifying epithelial tissue maturity and barrier integrity using commercial or custom electrodes and chambers [4,7,8]. Electrochemical impedance spectroscopy (EIS/ECIS), although not yet widely adopted, has been shown to offer insights into epithelial transport dynamics, membrane-specific properties, and more accurate measurements of membrane integrity. For example, Lewallen et al. showed the advantages of combining EIS with intracellular voltage recording to distinguish apical and basolateral transport function during adenosine triphosphate administration [1] in a custom Ussing chamber and automated electrode placement [9]. Cottrill et al. reported similar parameters without intracellular voltage recording, by making assumptions about relative permeability [10]. Linz et al. integrated EIS into existing commercial electrodes (STX, World Precision Instruments) to measure Caco-2 monolayer dynamics in response to stimuli: saponin, sonoporation, and calcium chelator ethyleneglycol-bis(beta-aminoethyl ether)-N, N’-tetraacetic acid (EGTA) [2].
Transepithelial resistance (TER) is a good indicator of tight junction development and membrane integrity. Tight junctions form between the cells, creating a paracellular pathway as shown in Figure 1A. The electrical resistance of the tissue is dominated, but not determined exclusively, by this paracellular pathway, compared to the flow of ions through the respective apical and basolateral membranes [11–13].
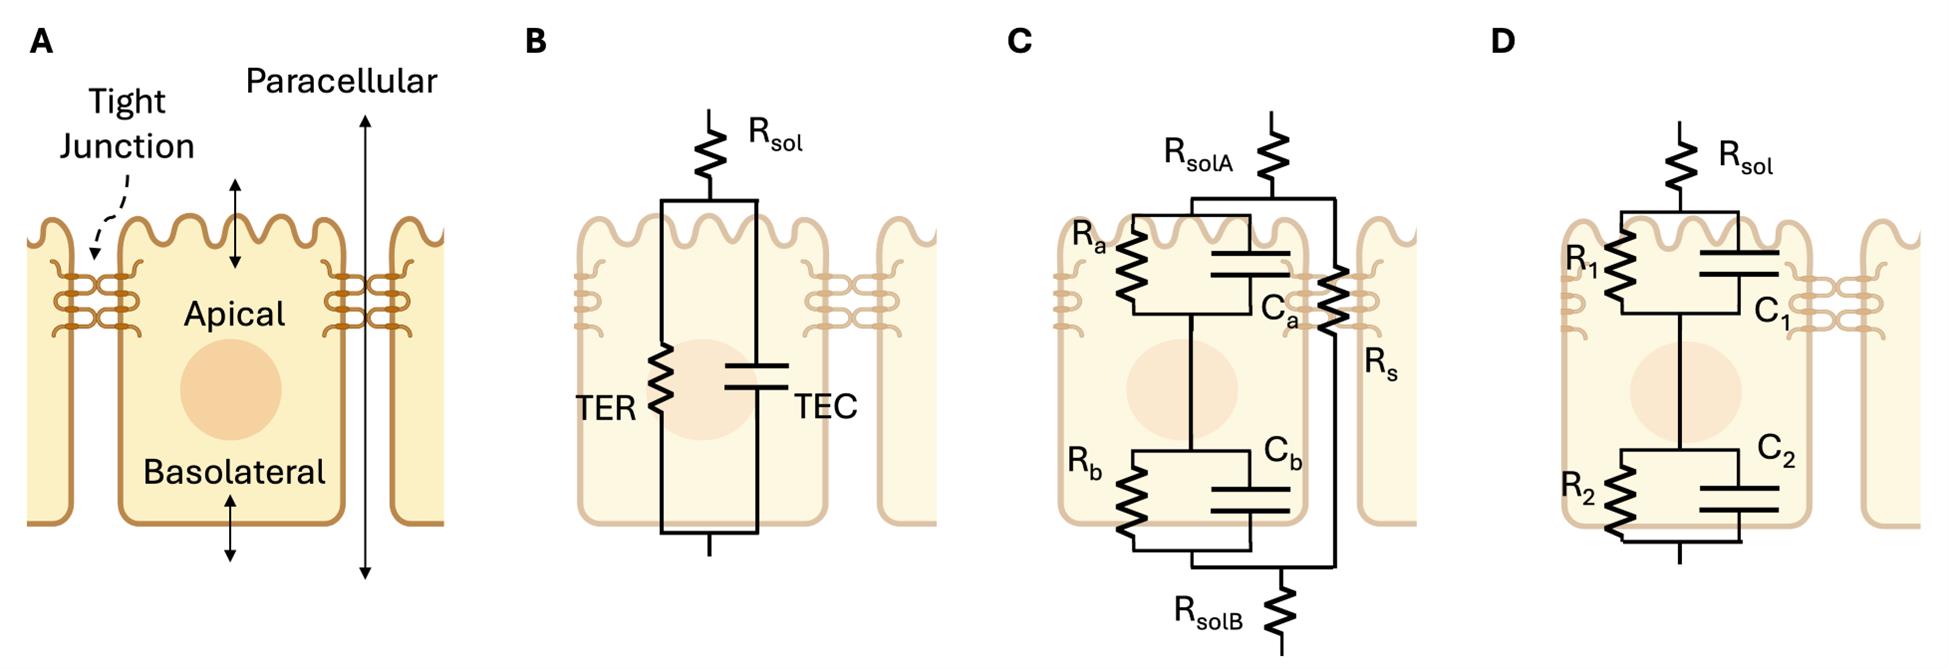
Figure 1. Circuit models for transport across an epithelial monolayer. Modified from Lewallen et al. [1]. (A) Physical model: cross-section schematic of an epithelial tissue showing the three pathways where transport is regulated: apical, basolateral, and paracellular pathways. (B) Three-parameter circuit model: a simple resistor-capacitor (RC) circuit that can be fit from extracellular electrodes alone, widely used to measure transepithelial resistance (TER) and transepithelial capacitance (TEC) despite its low fidelity. (C) Seven-parameter model with apical, basolateral, and paracellular pathways requires intracellular voltage measurement to fully solve [1,14]. (D) Five-parameter model, which we refer to as the RCRC model, with two resistors (R) and 2 capacitors (C) representing the cell layer, shown to model the apical and basolateral cell membranes of Caco-2 cells in Linz et al. [2].
TER measurement is typically performed at a single frequency (e.g., 12.5 or 75 Hz [7,15]), assuming resistance is independent of frequency (i.e., reactance is negligible). Yet, it has been observed that reactance is not negligible [1,2,16] and therefore, this assumption is not valid. As a result, the TER measured with a single frequency is erroneously low. For example, bronchiolar epithelia show a strong frequency-dependent change in resistance (see Figure 2). Mathematical models of epithelia that include reactance contributed by capacitance, as shown in Figure 1B–D, can more accurately fit the measurements across frequencies. Figure 2 shows an EIS data fit with the model from Figure 1D. In this figure, called a Nyquist plot, the resistance (R) and reactance (X) are the real and imaginary components of the complex impedance (Z), measured as a function of frequency.
Adding capacitive elements to the model (Figure 1B–D) can yield novel insights about the epithelial barrier. EIS measurements of TER from fitting a circuit model, as shown in Figure 2, inherently separate the electrical resistance of the tissue from the transwell and media, termed Rsolution, shortened to Rsol. Thus, unlike traditional TER measurement, “background subtraction” from a blank is not necessary. The impedance measurements also capture capacitance, enabling one to model charge blockage or storage at the tissue surface, a frequency-dependent property [1,2,16]. In addition, transepithelial capacitance (TEC) shows promise in describing cell properties such as cell volume or surface area [17–20]. Although cell capacitance has been used for single cells to identify cell types in cytometry, rigorous biological studies have yet to be published correlating the TEC of a monolayer of cells to a specific cell property.
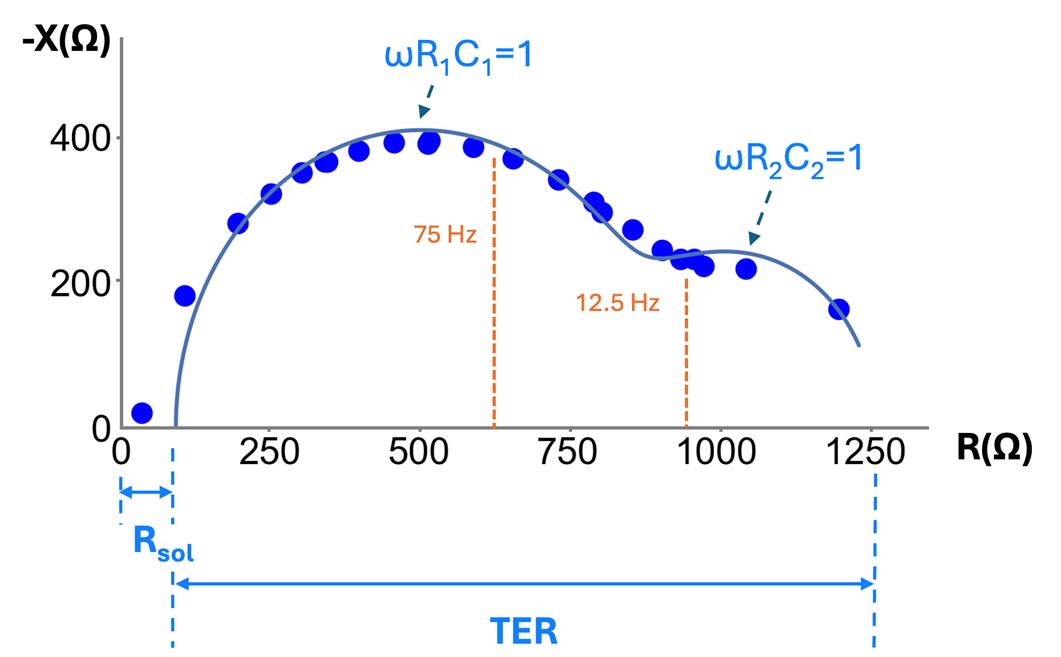
Figure 2. Nyquist plot of negative reactance (-X) vs. resistance (R) for frequencies of 2 Hz to 10 kHz on a measurement of bronchiolar epithelia (at day 7). Each point is the measured reactance and resistance for a given frequency; all measurements were taken on a single sample. TER measurements taken at a single frequency, such as 12.5 Hz and 75 Hz and shown in orange, underestimate TER [21] and require background subtraction. Each capacitance component can be estimated based on the approximate peak of each semicircular curve in the Nyquist plot, where at the peak, .
Figure 1B shows the simplest model that accounts for capacitance and lumps the apical and basal membrane, along with the paracellular properties, into single values of TER and TEC. While insightful and implemented in commercial devices (CellZscope, NanoAnalytics), we have shown that some epithelial tissues, like bronchiolar epithelia, require more detailed models to accurately calculate TER (e.g., Figure 1C, D [22]). Figure 1C, while modeling the apical, basolateral, and paracellular pathways separately, requires intracellular measurement to solve [1]; thus, the method we present here relies on the model of Figure 1D. This model can capture the different time constants observed in the data (τ = RC), yet can be measured with only extracellular electrodes. This model has been used in prior publications to analyze impedance data on Caco-2 cells changing in response to forskolin [2]. However, one of the shortcomings of the model of Figure 1D is that the paracellular resistance is lumped into R1, R2, C1, C2 and is therefore not resolvable.
With off-the-shelf electronic circuitry and software, we have developed a method for fitting an electronic model to measure the resistances and time constants associated with tissue changes. The cells are grown on the same transwells and tested in the same chambers used for conventional TER measurement. The electronic circuitry performs galvanostatic signal processing (e.g., analog to digital conversion, modulation) and conversion to impedance. The custom software performs mathematical and data analysis (e.g., fitting and error calculation). The electrical current is set to less than 10 μA to maintain linearity [16,20], and the frequency sweep is chosen such that the reactance is approximately zero at the bounds of the range, or approximately 2 Hz–50 kHz, with frequencies logarithmically spaced. We take these impedance measurements on retinal pigment epithelia (RPE) and bronchiolar epithelia (16HBE), and report transepithelial resistance (TER), transepithelial capacitance (TEC), membrane ratio (α), and a validated metric of reporting measurement error, the mean absolute error (MAE).
Prior to describing the method for epithelia, we will first discuss our validation of the EIS and fitting technique on electrical circuits that mimic the TER and TEC of living tissues. We soldered circuits with commonly observed TER and TEC values of mature tissues and lower TER and TEC values representing developing tissues, resulting in four electrical circuits: 16HBE1, 16HBE2, RPE1, and RPE2, as shown in Figure 3. The results show precise and accurate TER (< 7 Ω error, < 1 Ω SD), TEC [< 0.12 μF error (< 0.025 μF SD)], Rsol [< 4 Ω error (< 0.4 Ω SD)], and membrane ratio < 1.5 error (< 0.6 SD) for all four circuit models. Individual circuit parameters Rsol, R1, R2, C1, C2, and their errors are reported in Figure S2.
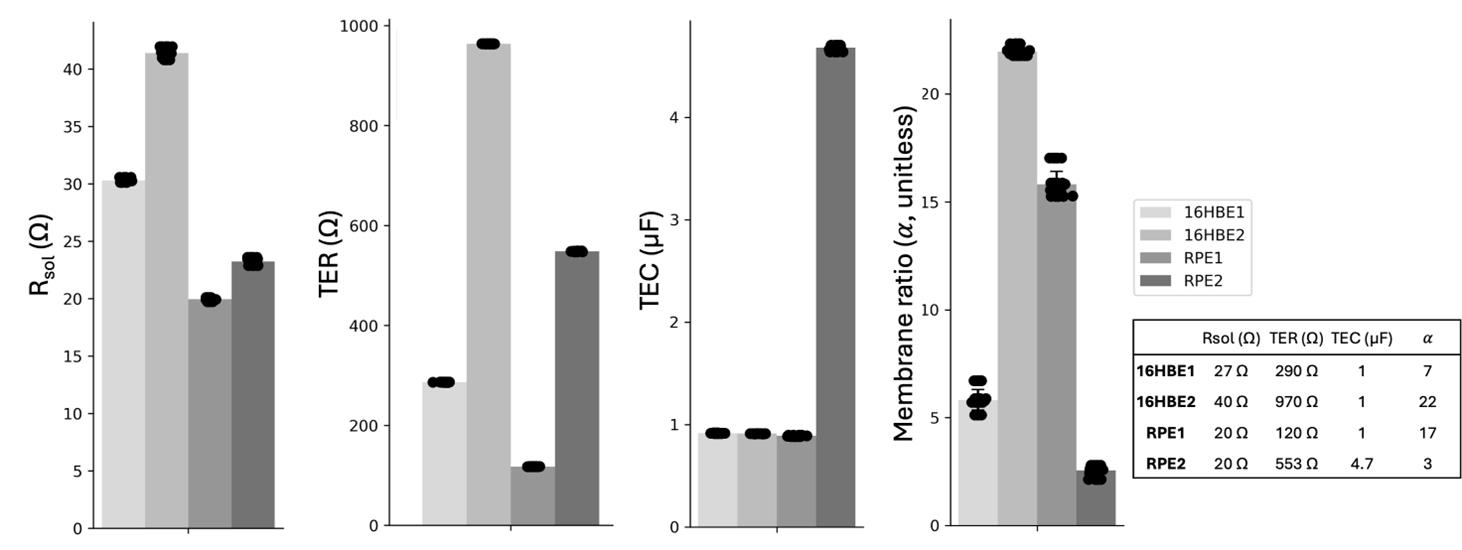
Figure 3. Electrochemical impedance spectroscopy (EIS) measurement and fitting to the RCRC model (Figure 1D) on four electrical circuits (16HBE1, 16HBE2, RPE1, RPE2) simulating bronchiolar epithelia (16HBE) and retinal pigment epithelia (RPE) cell layers. Six replicate EIS measurements were taken on each circuit, and all six measurements were fit six times to include fitting variability. Transepithelial resistance (TER) (< 7 Ω error, < 1 Ω SD), transepithelial capacitance (TEC) [< 0.12 μF error (< 0.025 μF SD)], Rsol [< 4 Ω error (< 0.4 Ω SD)], and membrane ratio < 1.5 error (< 0.6 SD) for all four circuit models. Signal 2 Hz–50 kHz, 2 freq/dec, 4 μA. Table inset: actual circuit values.
Materials and reagents
Biological materials
1. 16HBE14o, human bronchiolar epithelial cells (Millipore Sigma, catalog number: SCC150) grown to confluency: 7 days after seeding at 250k cells/12-well transwell in 12 mm Transwell® with 0.4 μm pore PET membrane insert [23]
2. iPSC-derived retinal pigment epithelia grown to maturity (Sharma et al. [24,25]) in 12 mm Transwell® with 0.4 μm pore PET membrane insert
Reagents
1. RPE cell culture media (Sharma et al. [24])
a. 90% MEM alpha (Thermo Fisher, catalog number: 12571063)
b. 5% fetal bovine serum, heat inactivated (Hyclone, catalog number: SH30071.03)
c. 1% N-2 supplement (Life Technologies, catalog number: 17502048)
d. 1% penicillin-streptomycin (Life Technologies, catalog number: 15140-148)
e. 1 mM sodium pyruvate (Life Technologies, catalog number: 11360-070)
f. 0.1 mM MEM non-essential amino acids (Life Technologies, catalog number: 11140)
g. 250 μg/mL taurine (Sigma, catalog number: T0625)
h. 20 μg/L hydrocortisone (Sigma, catalog number: H6909)
i. 0.013 μg/L 3,3’,5-Triiodo-L-thyronine (T3) (Sigma, catalog number: T5516)
2. 16HBE culture media (concentrations based on the medium used by the Cystic Fibrosis Foundation [26])
a. 89% MEM media (Thermo Fisher Scientific, catalog number: 11095098)
b. 10% fetal bovine serum, premium, heat inactivated (R&D Systems, catalog number: S11150H)
c. 1% penicillin-streptomycin (5,000 U/mL) (Thermo Fisher Scientific, catalog number: 15070063)
3. Reagent-grade alcohol (VWR, catalog number: BDH1164-4LP)
4. Deionized water (e.g., Millipore Milli-Q Water Purification System)
5. Sodium hypochlorite, 5% w/v (LabChem, catalog number: 1310-73-2)
Laboratory supplies
Biological supplies
1. 1× 12 mm Transwell® with 0.4 μm pore PET membrane insert with no cells seeded (Corning, catalog number: 3460)
2. Spray bottle (Fisher Scientific, catalog number: 02-991-721)
3. 2× 50 mL Falcon tube (Corning, catalog number: 352070)
4. Lint-free wipes (Kimtech Science, catalog number: 34120)
5. P1000 pipette (VWR, catalog number: 83009-776)
6. P1000 tips (VWR, catalog number: 76322-154)
7. Sterile forceps (VWR, catalog number: 82027-408)
Electrical supplies
1. EndOhm (12 mm) (World Precision Instruments, catalog number: EndOhm-12G)
2. EndOhm to RJ11 cable (World Precision Instruments, catalog number: 53330-01)
3. USB-C to USB-A adapter (j5Create, catalog number: JCD383)
4. Parts for RJ11 to banana adapter:
a. 5× banana plug (Digikey, catalog number: J356-ND)
b. RJ11 female connector (Amazon Uxcell, catalog number: B01HU7BX42)
c. Plastic housing box (P200 tip box) (VWR, catalog number: 76322-150)
d. M12 drill bit (Drill America, catalog number: POUM12X1.25)
e. Solder (Digikey, catalog number: SMDIN52SN48-ND)
f. Superglue (Loctite, catalog number: 1799408)
Equipment
1. Multi Autolab cabinet for M204 modules (Metrohm, catalog number: AUT.MAC204.S)
a. M204 multichannel PGSTAT module (Metrohm, catalog number: AUTM204.S)
b. FRA32M module for M101/204/PGSTAT204 (Metrohm, catalog number: FRA32M.MAC.204.S)
c. Autolab banana cable (Metrohm)
d. Autolab power cable (Metrohm)
e. USB-A to USB-B 2.0 cable (Metrohm)
f. Autolab test cell (Metrohm, catalog number: 3500002470)
2. PC with CPU 1 GHz or faster 64-bit processor, 2 GB RAM, 20 GB hard space, DirectX 9.0c compliant display adaptor with 64 MB RAM [Dell laptop, CPU intel i9 core, 2.50 GHz, 64 GB RAM, 1.84 TB Hard drive, intel(R) UHD graphics GPU]
3. Laminar flow hood/biological safety cabinet (Labconco, model: Logic+ Type A2 Biosafety Cabinet)
4. Soldering iron (Digikey, catalog number: PES51-ND)
5. Drill (Dewalt, catalog number: DCD793B)
6. Multimeter with continuity feature (Fluke, catalog number: FLUKE-177 ESFP)
Software and datasets
1. MATLAB (Mathworks, 2024b)
2. Microsoft Excel (Microsoft, Version 16.92)
3. NOVA 2.1 (Metrohm, 2024)
4. Impedance Analysis GitHub (extracellularEIS, https://github.com/chien0507/extracellularEIS/tree/main)
a. Matlab Impedance Fitting Code (Nova_batch_20240125.m, Nova_function_20240125.m, fitZ12_20240125.m, funRCRC.m, makeTissueID.m)
b. NOVA Custom Galvanostatic EIS Protocol (protocol.nox)
Procedure
文章信息
稿件历史记录
提交日期: Mar 13, 2025
接收日期: May 9, 2025
在线发布日期: May 30, 2025
出版日期: Jun 20, 2025
版权信息
© 2025 The Author(s); This is an open access article under the CC BY-NC license (https://creativecommons.org/licenses/by-nc/4.0/).
如何引用
Chien, A. J., Lewallen, C. F., Khor, H., Cegla, A. V., Guo, R., Watson, A. L., Hatcher, C., McCarty, N. A., Bharti, K. and Forest, C. R. (2025). Method for Extracellular Electrochemical Impedance Spectroscopy on Epithelial Cell Monolayers. Bio-protocol 15(12): e5341. DOI: 10.21769/BioProtoc.5341.
分类
生物信息学与计算生物学
生物物理学 > 电生理 > 电化学阻抗谱
细胞生物学 > 基于细胞的分析方法 > 电生理技术
您对这篇实验方法有问题吗?
在此处发布您的问题,我们将邀请本文作者来回答。同时,我们会将您的问题发布到Bio-protocol Exchange,以便寻求社区成员的帮助。