

Analysis of qRT-PCR Data to Identify the Most Stable Reference Gene Using gQuant
利用gQuant分析qRT-PCR数据筛选最稳定的参考基因
(*Contributed equally to this work, §Technical contact: pathakabhay@bhu.ac.in) 发布: 2025年05月05日第15卷第9期 DOI: 10.21769/BioProtoc.5292 浏览次数: 2778
评审: Ritu GuptaIvan Sanchez DiazJose Roberto Torres
参见作者原研究论文
The authors used this protocol in:

Aug 2024
Advertisement


Abstract
The accurate quantification of nucleic acid–based biomarkers, including long non-coding RNAs (lncRNAs), messenger RNAs (mRNAs), and microRNAs (miRNAs), is essential for disease diagnostics and risk assessment across the biological spectrum. Quantitative reverse transcription PCR (qRT-PCR) is the gold standard assay for the quantitative measurement of RNA expression levels, but its reliability depends on selecting stable reference targets for normalization. Yet, the lack of consensus on a universally accepted reference gene for a given sample type or species, despite being necessary for accurate quantification, presents a challenge to the broad application of such biomarkers. Various tools are currently being used to identify a stably expressed gene by using qRT-PCR data of a few potential normalizer genes. However, existing tools for normalizer gene selection are fraught with both statistical limitations and inadequate graphical user interfaces for data visualization. gQuant, the tool presented here, essentially overcomes these limitations. The tool is structured in two key components: the preprocessing component and the data analysis component. The preprocessing addresses missing values in the given dataset by the imputation strategies. After data preprocessing, normalizer genes are ranked using democratic strategies that integrate predictions from multiple statistical methods. The effectiveness of gQuant was validated through data available online as well as in-house data derived from urinary exosomal miRNA expression datasets. Comparative analysis against existing tools demonstrated that gQuant delivers more stable and consistent rankings of normalizer genes. With its promising performance, gQuant enhances the precision and reproducibility in the identification of normalizer genes across diverse research scenarios, addressing key limitations of RNA biomarker–based translational research.
Key features
• Accurate reference gene selection: gQuant identifies the most stable gene in qRT-PCR datasets using a multi-metric approach including SD, GM, CV, and KDE.
• Robust missing data handling: Implements imputation and removal strategies to ensure data integrity and accurate normalizer selection.
• Bias-free ranking algorithm: Utilizes a voting-based classifier to provide fair and consistent ranking, overcoming limitations of weighted approaches.
• Comprehensive visualization: Offers boxplots and KDE plots for analyzing gene expression variability, aiding in data interpretation.
Keywords: Reference gene (参考基因)Graphical overview
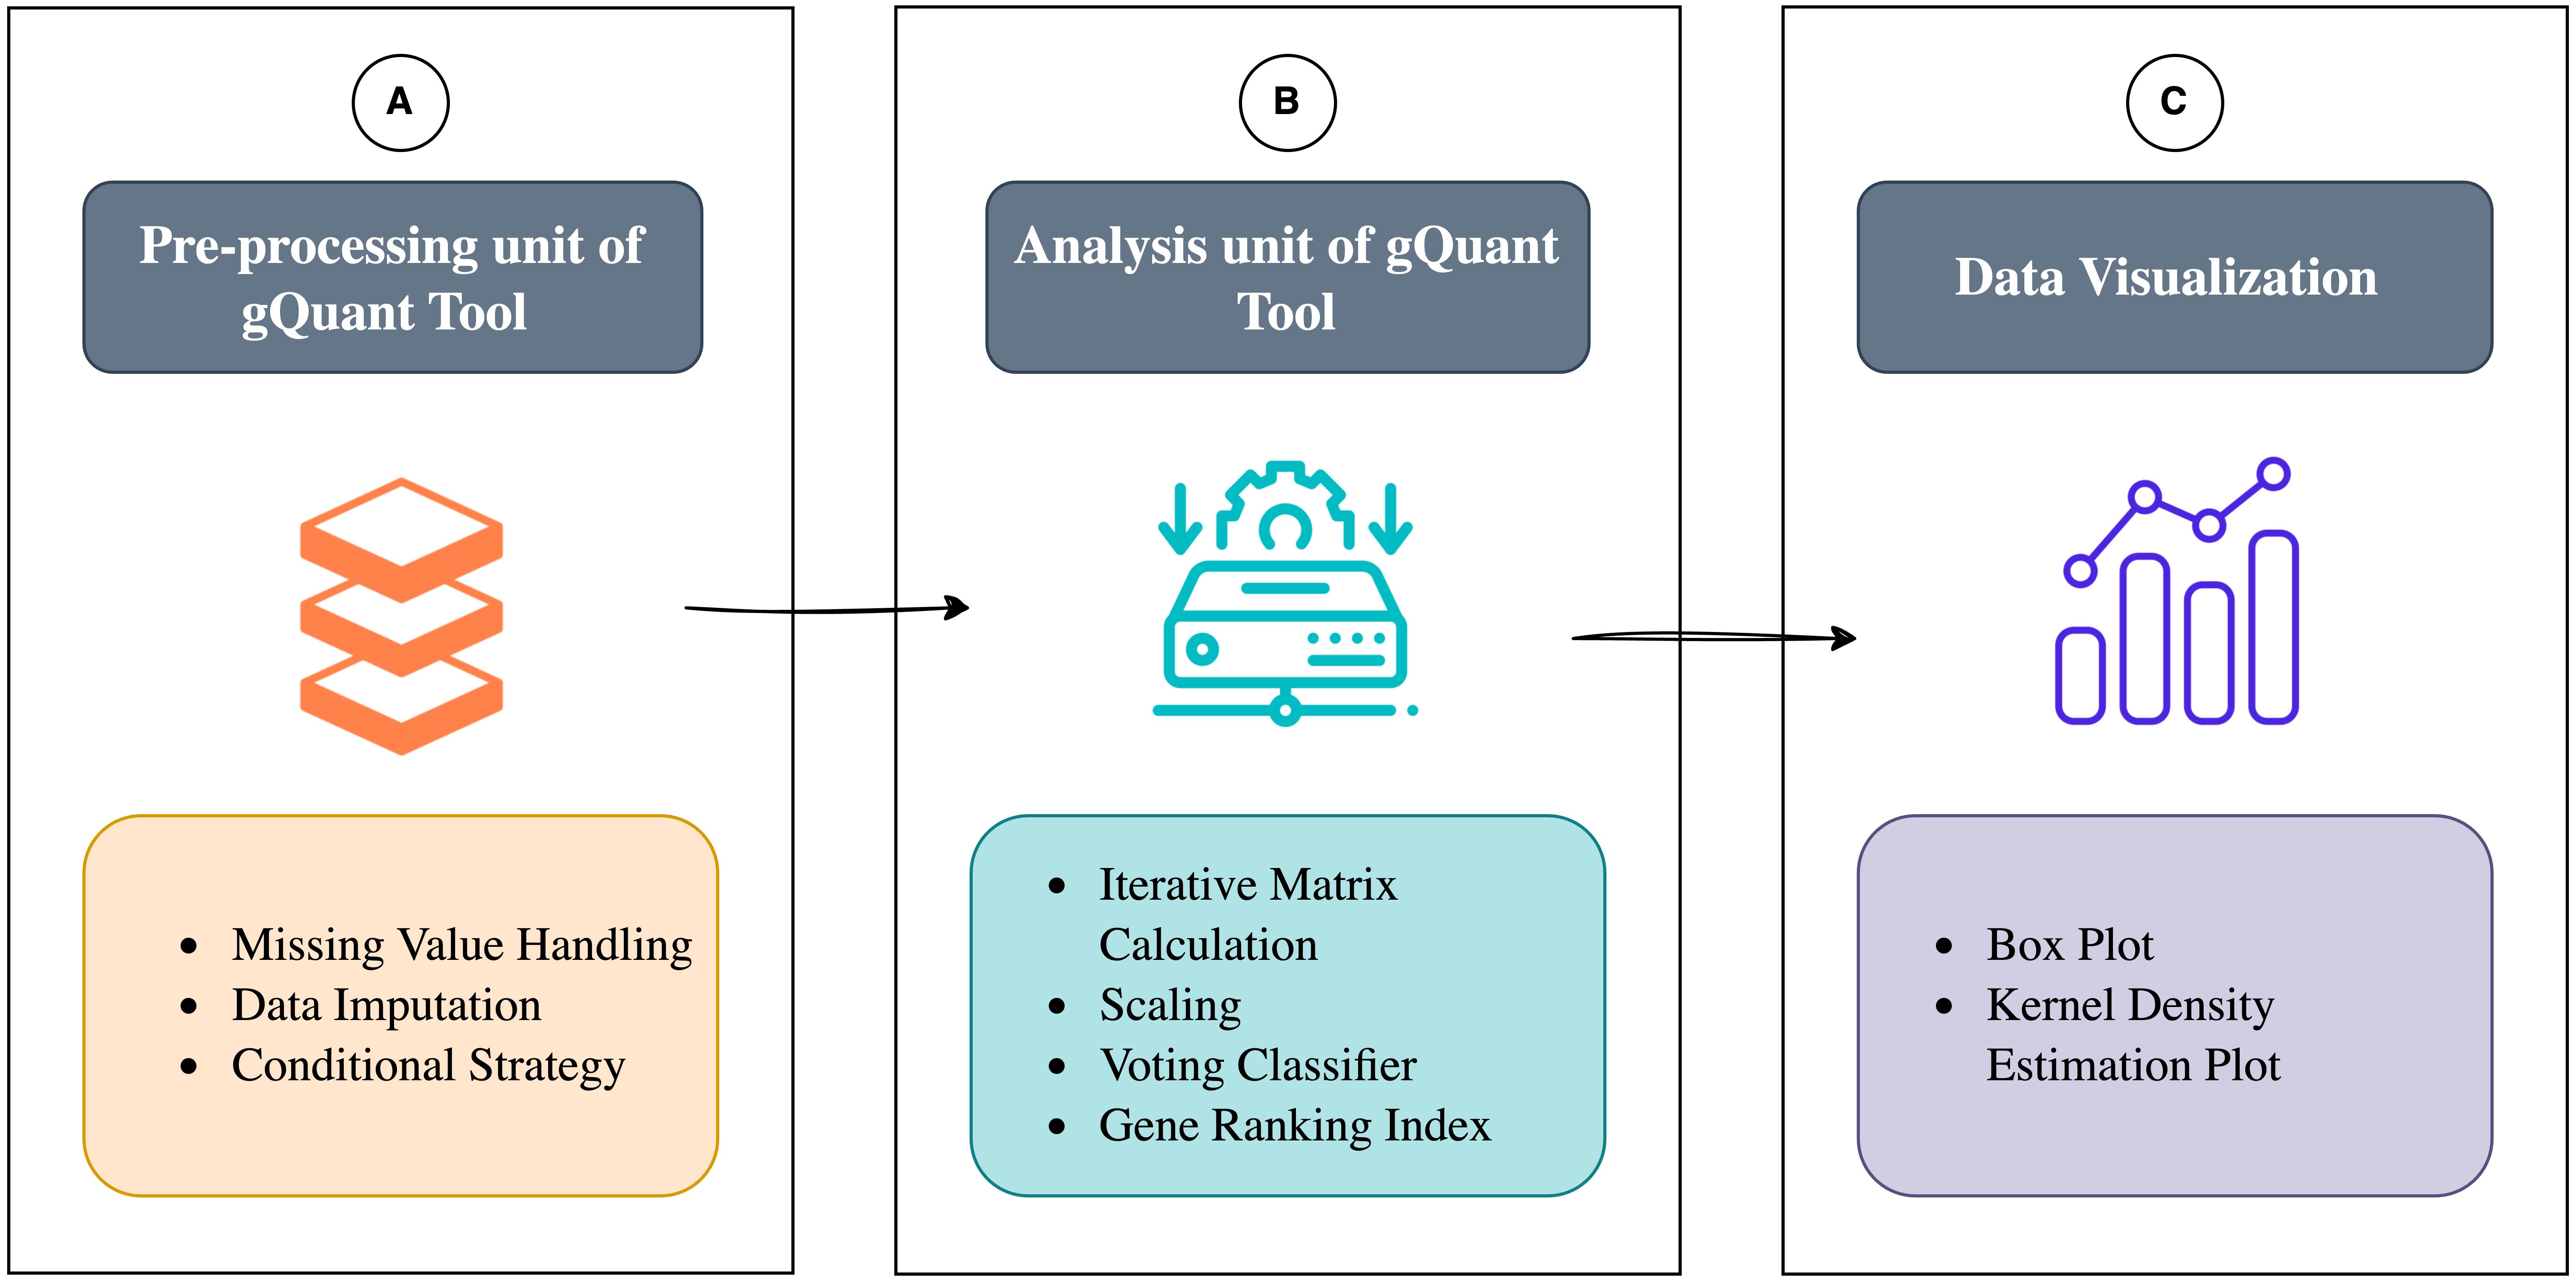
Comprehensive workflow. (A) Preprocessing unit of gQuant, including missing value handling, imputation, and filtering. (B) Analysis unit of gQuant, including matrix calculations, scaling, and multiple statistical methods. (C) Comprehensive visualization: Offers boxplots and KDE plots for analyzing expression variability in qRT-PCR data, aiding in data interpretation.
Background
Quantitative reverse transcription PCR (qRT-PCR) is the benchmark method for accurately measuring RNA expression levels. qRT-PCR becomes completely indispensable as a tool when it comes to using RNA-based biomarkers for diagnosis or prognosis [1,2]. The vital aspect of comparative RNA expression studies utilizing qRT-PCR is the judicious selection of normalizer or reference genes/sequences for accurate data normalization [3]. While internal reference genes or normalizer genes, such as ACTB, GAPDH, and 18S Ribosomal RNA [4], have been successfully employed at the tissue level for mRNA quantification, researchers also opt to choose specific normalizers for individual experiments, particularly where a universally accepted set of normalizers remains elusive, such as in miRNA-based assays [5,6]. Although many miRNA-based studies have used RNU6 as the most commonly used reference gene, it has been reported to have variable expression and does not represent the optimal reference gene for miRNA analysis [7]. RNU6 does not show the same biochemical properties as miRNA molecules, so the process of extracting, converting, and amplifying RNU6 might not be as efficient as it is for miRNAs. The use of RNU6 is inappropriate for serum and plasma as it is only present in serum or plasma as a result of coagulation or cell lysis.
miRNAs have emerged as promising biomolecules in diagnostic, prognostic, and therapeutic avenues in various cancers [8]. Their stability, abundance, and presence in body fluids, such as urine, make them ideal candidates for cancer detection and monitoring [9]. Among these, urinary extracellular vesicles (uEVs) have garnered significant attention due to their cargo of stable miRNAs, reflecting the molecular signatures of their parent cells [10]. One such example is the exploration of uEVs to detect miRNAs released by tumors, especially in urological cancers like bladder cancer (BCa) and prostate cancer (PCa), in the search for non-invasive methods to detect and monitor the disease [11]. Some of the most commonly used strategies are spike-in controls [12] like cel-miR-39, multiple endogenous miRNAs and their arithmetic means, the pair ratio method [13], and study-specific normalizers [14]. Such variable strategies raise significant concerns about the comparability and reliability of results across different studies. Therefore, it is essential to identify and validate a suitable normalizer for various studies, considering factors such as sample type, pre-analytical conditions, and post-analytical variables.
Existing tools like BestKeeper [15] use the standard deviation and coefficient of variation of Ct values to evaluate the stability of the candidate reference sequence, which is highly sensitive to outliers and does not deal with missing values. The Delta-Ct [16] algorithm uses intra-group variation, whereas NormFinder [17] uses a model-based approach that focuses on intergroup and intragroup variation, identifying the most stable reference gene. Another tool, geNorm [18], calculates the M-value for each gene, calculating pairwise variation with all the other candidate genes to identify the normalizer gene, which is also affected by the coregulation of genes. Many different tools use accumulated standard deviation, which also uses intergroup and intragroup variation assuming that the expression data is distributed normally and is therefore very sensitive to outliers. GenExpa [19] uses the coherence score to validate the reliability of the most stable reference gene, which is statistically sound but does not have a strategic mechanism to handle missing values and outliers. RefFinder, on the other hand, addresses a few of these challenges by integrating various existing tools like NormFinder, DeltaCt, BestKeeper, and GeNorm using a weighted approach that provides a robust selection of the most stable reference gene; yet it lacks the strength of handling missing values.
As such, these tools have limitations in addressing the unique challenges posed by presumptions of the nature of the data, statistical implications, null values, and graphical user interface for data visualization (Table 1).
Table 1. Detailed descriptions of existing limitations addressed by our proposed tool
| Aspect | Limitations | Limitations addressed in gQuant tool |
|---|---|---|
| Missing values | Lack of methods to handle missing values, which raises concerns about final ranking. | A preprocessing unit addresses this issue and handles it strategically. |
| Different approaches | Using different statistical tools used by different methods leads to different interpretations of expression data. | Our tool employs multiple statistical methods, which enables multidimensional analysis from a distinctive angle. |
| Scaling | Literal values from different methods can cause dominance in weighted or other combined approaches. | The tool employs standard scaling to standardize the result in a range of 0 to 1, which cannot dominate the voting process. |
| Interactive graphics | Limited or no interactive graphics for gene ranking and expression data distribution. | Incorporates boxplots and KDE plots to visualize the distribution and density of data. |
| Democratic voting-based integration | Traditional tools like RefFinder use a weighted approach, which can lead to biases. | Our tool employs the democratic voting mechanism where each data point competes for the vote-based characteristics. |
Therefore, the development of robust, consistent, and generalizable algorithms is essential for accurately identifying the most stable reference genes. Given this context, our effort to develop a tool to find the most stable reference gene and its validation on uEV-miRNAs represents a timely and crucial endeavor. In this cross-disciplinary research initiative, we synergized biological and mathematical fields.
While searching for a standard normalizer gene in a concurrent study, we screened selected miRNAs based on existing literature. This initial assessment involved experimental qRT-PCR, followed by analysis using existing tools like RefFinder. However, discrepancies in the results with current tools prompted us to develop a new, more robust analytical algorithmic model.
This paper introduces a novel and efficient algorithmic tool named gQuant, designed for analyzing qRT-PCR expression data to identify the most stable reference gene. We have validated our tool using a range of experimental data and publicly available datasets. Furthermore, we conducted a comparative analysis with current tools, pointing out their limitations, and detailed the methodological thoroughness that went into the development of this innovative analytical approach.
Tool description
The tool gQuant was developed in Python programming language using Jupyter Notebook Integrated Development Environment. Python is a well-known, widely used, free, and open-source programming language that is very efficient in data analysis and mathematical computations, thus providing a significant basis for qRT-PCR data analysis. This environment offers various automated libraries for statistical computation, mathematical operations, and data visualization. The related codes and libraries required to use this tool are available on a GitHub repository, which can be accessed using the link https://github.com/ABHAYHBB/gQuant.
For the gQuant tool, data needs to be processed in tabular format (Figure 1) for preprocessing, ranking of most stable reference genes, and data visualization. However, datasets can be used in different supported file formats like spreadsheets, comma-separated files, or text files in which table columns must represent the candidate reference genes and rows represent samples.
Figure 1. Workflow of gQuant tool. (Part A) Preprocessing unit of gQuant, which involves handling missing values, data imputation, and filtering to ensure data integrity before analysis. (Part B) Analysis unit of gQuant, where statistical computations are performed using multiple ranking metrics, followed by a voting-based integration approach to identify the most stable reference gene.
The functionality of gQuant is divided into two broad categories:
1. Preprocessing unit
Data preprocessing is an integral part of the gQuant tool, which initially processes the dataset. Once preprocessing is completed, statistical metrics are calculated, and the tool proceeds with ranking stable reference genes. In the initial preprocessing stage, the tool systematically processes the input dataset by identifying and quantifying missing or null values within each gene column. For every column, it calculates the ratio of available values to missing values (NA), which plays a crucial role in guiding the next steps of the workflow. The user must provide the ratio of available to missing value (NA) for each column for the preprocessing part (see Troubleshooting section). It decides whether an imputation process will happen or if a particular column will be excluded from the further ranking process due to the high number of missing values. Throughout this paper, we use a default ratio threshold of 8:1 to demonstrate the results. If this ratio exceeds a user-defined threshold, the tool engages in a missing value imputation process, replacing the missing values with the median of the available values in the corresponding column. This approach ensures that incomplete data can still contribute meaningfully to subsequent analyses. However, if the ratio falls below the threshold, the program deems the column unreliable and removes it from the dataset entirely. This mechanism iteratively evaluates all gene columns, employing an imputation strategy that assumes the dataset has different counts of missing values. The flexibility of this preprocessing step allows the threshold to be adjusted based on specific problem requirements; in our case, an 8:1 ratio was selected to balance data retention and accuracy. By methodically addressing missing values, this preprocessing procedure forms the first stage of the tool's operational framework, establishing a robust foundation for downstream analyses, as described in detail in Part A (Figure 1).
2. Analysis unit
To design a model that effectively integrates the advantages of current methods while addressing their limitations, we employed a systematic approach to optimize the performance evaluation framework, enabling more precise and reliable gene selection. This process is elaborated in the following sections. The tool utilizes preprocessed data from Part A as input (Figure 1). It calculates all metrics and scales their values to the [0,1] range, ensuring no single metric disproportionately influences the voting process. The majority voting integration strategy is then applied to identify the most stable reference gene among the candidate reference genes. Two scenarios arise during this process: in the event of a tie in the first voting round, the tied genes are assigned equal rankings in the index; if a majority vote favors a specific gene, it is recorded in the ranking index. The remaining genes undergo repeated iterations until a single gene remains. Required mathematical notations for the gQuant tool algorithm and their descriptions are shown in Table 2.
Table 2. Mathematical notations
| Symbol | Description |
|---|---|
| G | Sets of genes G = {G1, G2, … … Gn}. |
| X | Matrix of gene expression values; Xij, denotes the expression value of gene i in j samples. |
| σ | Standard deviation vector σ = {σ1, σ2, … … σn}, where σi is the standard deviation of gene |
| GM | Geometric mean vector GM = {GM1, GM2, … … GMn} where GMi is the standard deviation of gene i. |
| CV | Covariance vector CV = {CV1, CV2, … … CVn}, where CVi is the standard deviation of gene i. |
| KDE | Kernel density estimation vector KDE = {KDE1, KDE2, … …KDEn}, where KDEi is the standard deviation of gene i. |
| R | Ranking index list R = {(g1,r1), (g2,r2) … … (gn,rn)}, where gi is the ranking of the gene. |
For an explanation of the algorithm of gQuant, Table 3 shows the step-by-step process, definitions, and technical details.
Table 3. Steps of the gene ranking algorithm
| Step | Description |
|---|---|
| 1. Data reading | Read the gene expression data, extracting gene names and their numerical values. |
| 2. Scaling | Scale all the matrix vectors SD, GM, CV, and KED to ensure values are in [0,1] range, so no single metric dominates in the voting process. |
| 3. Iterative calculation | For each remaining gene gi, from G1 to Gn, compute the following metrics: SD, GM, CV, and KDE. These metrics are calculated iteratively using their respective equations. |
| 4. Voting | Each matrix elects the gene based on: Minimum value of SD, GM, and CV. Maximum value of KDE. |
| 5. Majority rule | The individual gene who received most votes across all metrics is: Removed from the current dataset X. Assigned rank and added to the ranking index R. Rank counter |
| 6. Tie breaking | If more than one gene received the same number of votes: All tied genes are removed from the dataset X together. All removed genes will be assigned the same rank in the ranking index. |
| 7. Recursion | Steps 3–6 are repeated iteratively until one gene remains in the dataset. |
| 8. Final index | The remaining gene/genes are added to R, with the final rank r. |
Equipment
1. For optimal performance, gQuant requires a system with a multi-core processor (Intel Core i5 or equivalent and above) and 8 GB RAM and above to efficiently handle computation. The tool is compatible with Windows, macOS, and Linux-based operating systems supporting Python 3.7 or higher. Additionally, using the Conda distribution with Jupyter Notebook (version 6.0 and above, optional) is recommended for an integrated development environment.
Software and datasets
Python software environment (≥3.6) (https://www.python.org/)
Anaconda distribution with Jupyter Notebook integrated development environment (≥6.0, optional) (https://www.anaconda.com/)
All data and code have been deposited to GitHub: https://github.com/ABHAYHBB/gQuant
1. Datasets can be prepared in different ways, and the scope of the protocol does not cover the processing of raw data. Generally, data should be cleaned, quality checked, and ready to be used.
2. Supported file formats for the tool can be, e.g., Excel files (.xlsx), comma-separated files (.csv), text files (.txt), and data frames (df).
3. After obtaining the qRT-PCR data, input source type does not matter, and the following requirements are the same:
• Columns of the dataset must represent the name of the gene/target and the row represents the sample.
• The name of the rows (samples) must be removed.
• For the best practice, avoid having spaces in the column names. It could cause unnecessary problems.
• If the dataset has missing values, it will not affect the result because it is carefully designed to handle it.
4. The datasets used here to show the example results are the same as what was used in the original article. These three datasets collectively validate gQuant across different molecular targets (mRNA vs. miRNA), sample types (cell lines vs. patient samples), and experimental constraints (small vs. large datasets, missing values). By demonstrating its robustness in diverse conditions, we confirm that gQuant can be reliably applied to various qRT-PCR-based normalization scenarios.
a. Dataset 1: Derived from research on OvCar-3 and PC-3 cancer cell lines, this dataset encompasses transcriptomic profiling of 84 genes pertinent to cell regulation and five conventional housekeeping genes (Figure 2). The data, accessible via GSE57888, serves as a benchmark for mRNA-based qRT-PCR analysis, offering validation for gQuant through non-normalized data. It contains un-normalized Ct values, where column names represent gene names, and rows correspond to samples without explicit row labels. Data also have undetermined or missing values. The file can be accessed using the link https://www.ncbi.nlm.nih.gov/geo/query/acc.cgi?acc=GSE57888.
Figure 2. Example of expression data in Excel file (.xlsx). The dataset shown in the figure is Dataset 1 as defined in this article.
b. Dataset 2: We chose the dataset GSE239868 with more detailed variables, such as the expression of 1,066 human miRNAs and n = 36 tracheal aspirate samples, for a comparative efficiency assessment of gQuant. This database included data for a comparative analysis on the management of missing values and allowed us to test the appropriateness of our method on miRNA background. This dataset’s unnormalized Ct values provide a strict testing environment. The file can be accessed using the link https://www.ncbi.nlm.nih.gov/geo/query/acc.cgi.
c. Dataset 3: In an endeavor to construct a more robust analytical framework, we decided to explore the potential of miRNA-based normalizers as an alternative to the well-established mRNA-based normalizers. Dataset 3 is also a testing environment for small datasets. Given the nascent state of miRNA-based normalization data, we focused specifically on uEVs. A comprehensive literature review and Qiagen’s Human Urine Exosomes Focus miRCURY LNA Panel list were used to select the miRNA set used in this study for validation. This investigation led to the selection of miR-16-5p, miR-10b-5p, 30b-5p, and miR-30d-5p. Additionally, upon evaluating the expression levels of the Let7c cluster genes from another ongoing study, we observed high stability for let-7c-5p across both diseased and control samples, leading to its inclusion in subsequent investigations. Therefore, our preliminary study proceeded to focus on the selected miRNAs: let-7c-5p, miR-16-5p, miR-10b-5p, miR-30a-5p, and miR-30d-5p. Using qRT-PCR, we assessed their expression in uEVs samples of BCa (n = 9), PCa (n = 6), and control samples (n = 3). Among the evaluated miRNAs, let-7c-5p has emerged as the most promising candidate for normalizer functions. Subsequently, expression levels for let-7c-5p miRNAs in uEVs were quantified in an expanded sample set (n = 30) using qRT-PCR. Rigorous quality control measures, including primer efficiency and melt curve analysis, were implemented, and any data with Ct values over 38 were excluded. The stability of the miRNA expression was validated using gQuant, solidifying let-7c-5p's potential as a reliable normalizer. This dataset was uploaded to the gQuant tool GitHub repository (https://github.com/ABHAYHBB/gQuant) (Dataset S1. Dataset 3).
Procedure
文章信息
稿件历史记录
提交日期: Jan 9, 2025
接收日期: Apr 2, 2025
在线发布日期: Apr 11, 2025
出版日期: May 5, 2025
版权信息
© 2025 The Author(s); This is an open access article under the CC BY-NC license (https://creativecommons.org/licenses/by-nc/4.0/).
如何引用
Pathak, A. K., Kural, S., Singh, S., Kumar, L., Gupta, M. and Jain, G. (2025). Analysis of qRT-PCR Data to Identify the Most Stable Reference Gene Using gQuant. Bio-protocol 15(9): e5292. DOI: 10.21769/BioProtoc.5292.
分类
生物信息学与计算生物学
分子生物学 > RNA > qRT-PCR
您对这篇实验方法有问题吗?
在此处发布您的问题,我们将邀请本文作者来回答。同时,我们会将您的问题发布到Bio-protocol Exchange,以便寻求社区成员的帮助。