

A Micro-Computed Tomography-Based Simplified Approach to Measure Body Composition, Osteoporosis, and Lung Fibrosis in Mice
基于微型计算机断层扫描的简化方法测量小鼠体成分、骨质疏松及肺纤维化
(*contributed equally to this work) 发布: 2025年02月20日第15卷第4期 DOI: 10.21769/BioProtoc.5207 浏览次数: 2555
评审: Komuraiah MyakalaKanchan BhasinAnonymous reviewer(s)
Advertisement


Abstract
Micro-computed tomography (micro-CT) is a powerful, non-destructive imaging technique that creates high-resolution 3D images of the internal structures of small animal models such as mice and rats. Familiarizing oneself with micro-CT imaging and data analysis can be overwhelming without easy-to-follow, clear instructions. Training on new instruments is often a task exclusive to a select subset of researchers, leaving the majority of potential trainees without a technical grasp of how to navigate the instructions. This protocol on the use of micro-CT aims to bridge that gap by providing a clear, step-by-step guide to acquire and analyze micro-CT images from mice for quantitative data. By exclusively detailing the necessary procedural steps from start to finish and overcoming complex user interfaces during imaging operations and analysis, this protocol will equip new micro-CT users with the ability to measure mouse body composition (bone, body fat, and lean muscle mass) and identify and quantify lung fibrosis. This approach applies to researchers with a basic understanding of medical imaging, animal care, and software analysis.
Key features
• Analysis of tissue-specific body composition using mice as model organisms.
• An easy-to-follow guide for novice users of high-resolution micro-computed tomography imaging systems.
• Enhances accessibility, workflow, standardization, training, and breadth of application in the research community.
• Effectively employing non-invasive live imaging allows for a longitudinal study of tissue architecture for examining age-related changes in vivo.
Keywords: Micro-computed tomography (微型计算机断层扫描)Graphical overview
Background
The role of small animal models in basic science research has rapidly expanded amidst the emergence of novel quantification techniques [1]. Precision measurement in such models has endeavored to unearth underlying mechanisms of action in estrogen-receptor signaling and innovative modes of drug delivery for quality improvement [2,3]. Genetically modified mice have an indispensable purpose in assessing the role of specific genes in key physiological functions and phenotypic changes that are often measured through histological analysis [4,5]. Nonetheless, such models may fail to provide either pertinent longitudinal data, an important consideration for examining structural development (fat, muscle, bone), or pathological changes in tissues such as lung fibrosis.
As an alternative approach to examining in vivo features at a fixed point in time, non-invasive techniques that allow for periodic imaging over time can quantitatively measure varied physiologic and pathologic phenotypes [5]. The benefits of live imaging of murine structures include quantifiable measurements for organic tissue-dependent changes at specific growth stages without inflicting harm or interruption to the life cycle. Non-invasive tools also enhance experimental designs by yielding a series of data points over the entire study duration, limiting the overall cohort size needed, and allowing more precise measures of inter-animal variability [6].
One of the most frequently utilized tools for diagnostic imaging is X-ray computed tomography (CT), which relies on employing X-ray beams in direct contact with the organism to create a cross-sectional tomographic representation. Hounsfield units (HU) is a relative quantitative measurement of radio density used in the interpretation of computer tomography images in the linear scale; the radio density of distilled water at a standard temperature and pressure is defined as 0 HU, whereas the radio density of air is -1,000 HU. A phantom with a known radio density calibrates machines, ensuring they provide the correct HU. Most animal tissues do not exceed +2,000 HU and standard clinical limits range from -1,000 to +3,071 [7].
In pre-clinical research, the ability of the micro-CT scanner to elicit information on body composition comes highly appreciated, enhancing surveillance of disease development, classification, and ramifications [8]. Whether analyzing bone mineral density for studying osteoporosis, distinguishing airspace changes for characterizing lung fibrosis, or comparing adipose volume change, non-invasive in vivo imaging using micro-CT scanners enables high spatial resolution with longitudinal monitoring [9].
Without a standardized protocol for utilization, not only does the reproducibility of research suffer, but it also hinders the ability to build upon the ever-evolving field of structural analysis and to develop an eventual gold standard for body composition characterization. Simple method articles serve as valuable resources for researchers who wish to incorporate micro-CT into their studies.
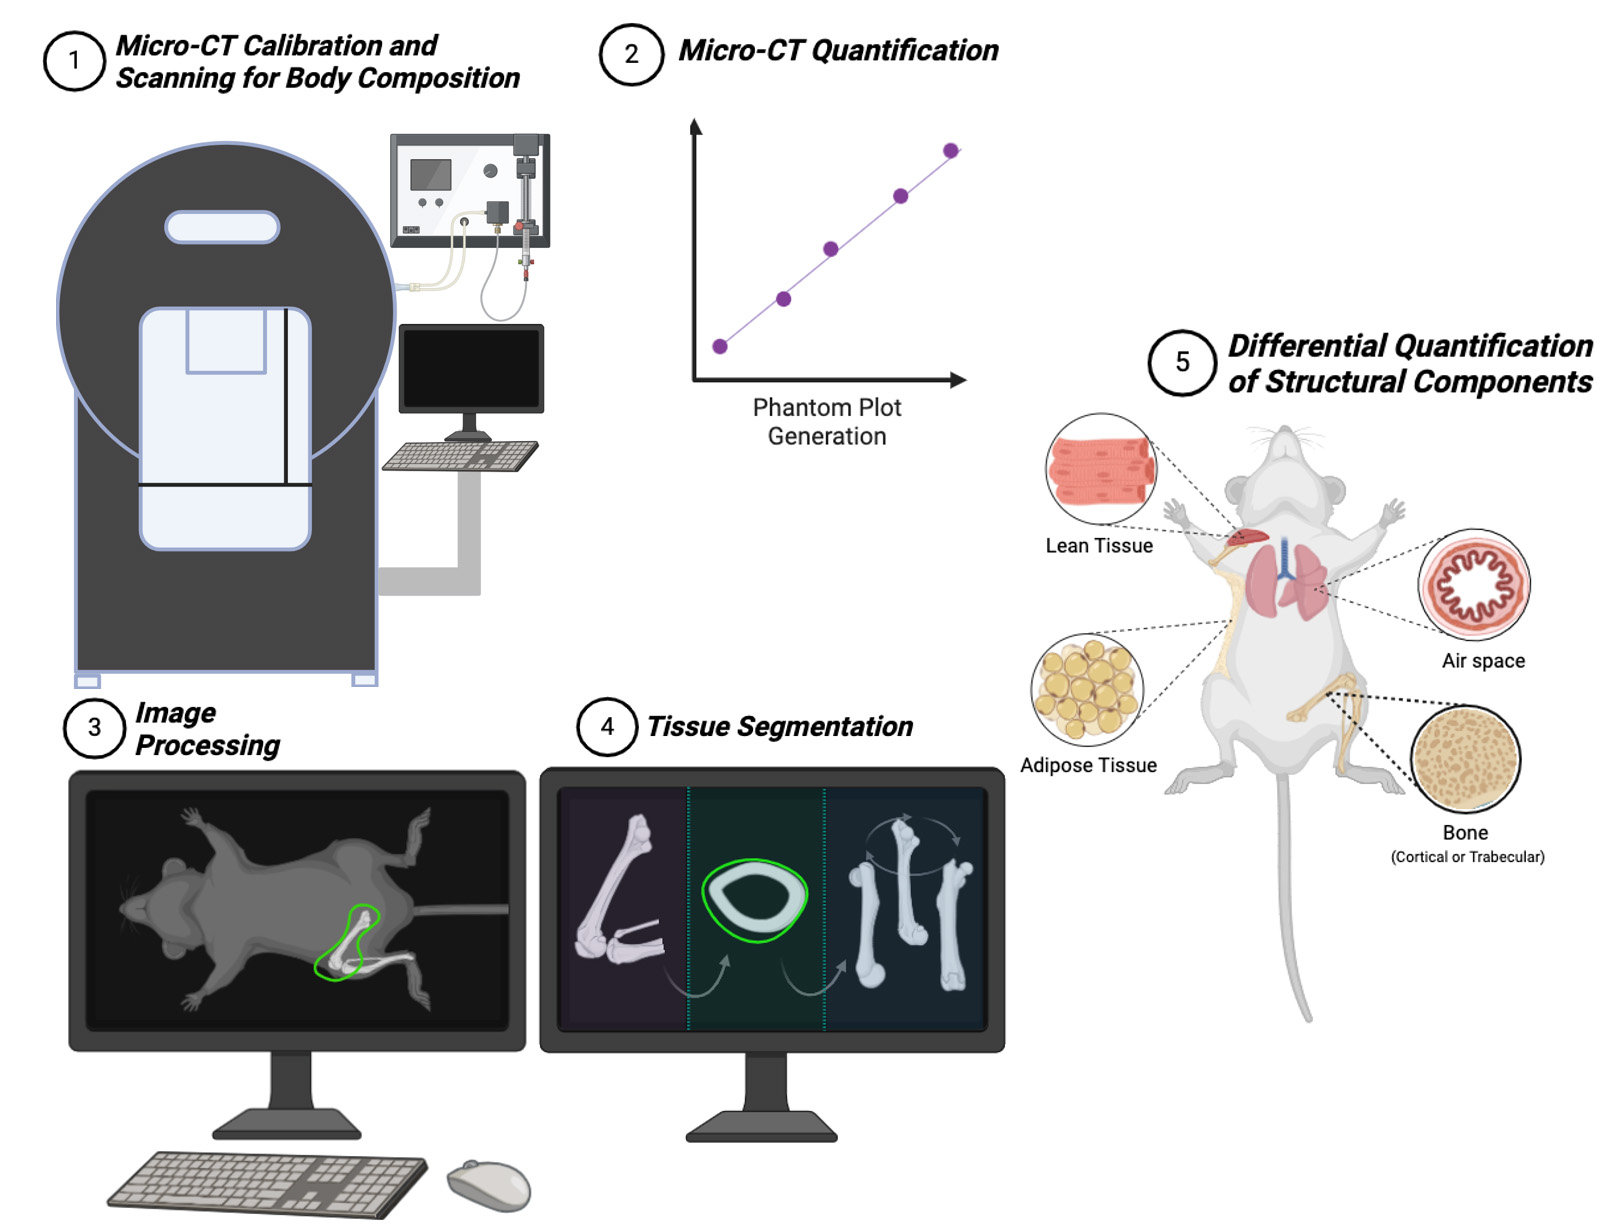
In this article, we propose an easy-to-follow guide for micro-CT users to reconstruct the physical structure of mice to obtain standard non-invasive imaging in mice-based long-term experiments. Our protocol improves upon existing methods by providing accessible, step-by-step instructions that minimize the need for specialized training. It simplifies workflows into manageable tasks, promotes standardization with many visual aids and troubleshooting guidance, and improves reliability. This protocol details a reproducible manner by which researchers can precisely attain data on lean tissue, adipose, bone structure, bone mineral density, and airspace quantification in the lung, enabling the investigation of gene-based translational applications.
Materials and reagents
Biological materials
1. C57BL/6 mice, 3 months old (C57BL/6J from The Jackson Laboratory, Bar Harbor, ME)
Reagents
1. FlurisoTM, isoflurane (VETone, catalog number: 502017), store at 20–25 °C for up to five years
2. Oxygen [50 pounds per square inch gauge (psig) (345 kPA) to 60 psig (414 kPA) required] (air gas)
Note: Oxygen can be a fire hazard, so always turn it off when not in use. Do not expose oxygen cylinders to temperatures higher than 50 °C. The oxygen tank should be securely fastened upright to prevent falling off and kept in a well-ventilated area completely separated from flammable materials and heating sources. Always keep the oxygen tank valve protected with the cap when not in use and ensure proper labeling indicating the contents as OXYGEN and whether it is full or empty. Never attempt to handle a damaged or leaking cylinder. Be aware of your laboratory-specific safety procedures while handling the oxygen tank.
3. Bleomycin solution 10 mg/mL in water (Sigma, catalog number: B7216); should be protected from light and stored at -20 °C. Mice were given 60 µL of bleomycin (1.25 U·kg-1 body weight) via oropharyngeal route to induce a fibrotic response that is more pronounced at day 21 after the treatment [10]. The Institutional Animal Care Use Committee (IACUC) approved this bleomycin-induced lung fibrosis protocol (Protocol ID: 1874)
Equipment
1. RAS-4 anesthesia system (PerkinElmer, catalog number: CLS146737)
2. Quantum GX2 micro-CT (PerkinElmer, catalog number: CLS149276)
3. PC: DELL Precision 5820 tower XCTO high-performance acquisition computer, Windows®10 Pro, Intel® (R) Xeon (R) W-2123 processor, NVIDIA Quadro P2000 5GB graphics card, 32 GB 2666 MHz RAM, 8 TB HD.
Note: Researchers working with animals in our vivarium must have taken proper animal training and lectures. They must wear appropriate personal protective equipment (PPE), including a dedicated lab coat or disposable gown, gloves, mask, and head and shoe covers. All PPE is available at the entrances to our animal facilities. Additionally, researchers must take radiation safety training before operating the micro-CT instrument. We recommend that researchers follow the institution-dependent regulations and use PPE accordingly.
Software and datasets
1. Quantum GX2 Image Analysis Software (PerkinElmer)
2. PerkinElmer Database, version 3.5.3.110 (free software with the purchase of Quantum GX2)
3. Analyze 14.0 (AnalyzeDirect, Inc., Lexana, KS, USA, license needed, https://analyzedirect.com/analyze14/)
4. Prism v9.3 (GraphPad, 11/15/2021, license needed, https://www.graphpad.com/). To perform a t-test in Prism: Launch the software and create a new project. Choose the Column table format and enter the data into the appropriate columns. Click the Analyze button and, under the Column Analyses group, select t-tests (and nonparametric tests).
5. BioRender (https://www.biorender.com/). The following figures were created using BioRender: Graphical overview, Created in BioRender. Landau, M. (2024) https://BioRender.com/c08f795.
Procedure
文章信息
稿件历史记录
提交日期: Sep 17, 2024
接收日期: Dec 16, 2024
在线发布日期: Jan 19, 2025
出版日期: Feb 20, 2025
版权信息
© 2025 The Author(s); This is an open access article under the CC BY license (https://creativecommons.org/licenses/by/4.0/).
如何引用
Landau, M. B., Zou, B., Yang, Z., Rowan, B. G. and Anbalagan, M. (2025). A Micro-Computed Tomography-Based Simplified Approach to Measure Body Composition, Osteoporosis, and Lung Fibrosis in Mice. Bio-protocol 15(4): e5207. DOI: 10.21769/BioProtoc.5207.
分类
生物物理学 > 电子冷冻断层扫描 > 3D图像重建
医学
您对这篇实验方法有问题吗?
在此处发布您的问题,我们将邀请本文作者来回答。同时,我们会将您的问题发布到Bio-protocol Exchange,以便寻求社区成员的帮助。