

Using DIMet for Differential Analysis of Labeled Metabolomics Data: A Step-by-step Guide Showcasing the Glioblastoma Metabolism
基于DIMet的标记代谢组学数据差异分析:以胶质母细胞瘤代谢为例的分步指南
(*contributed equally to this work) 发布: 2025年01月20日第15卷第2期 DOI: 10.21769/BioProtoc.5168 浏览次数: 3063
评审: Hélène LégerSébastien GillotinAnonymous reviewer(s)
参见作者原研究论文
The authors used this protocol in:
May 2024
Advertisement


Abstract
Stable-isotope resolved metabolomics (SIRM) is a powerful approach for characterizing metabolic states in cells and organisms. By incorporating isotopes, such as 13C, into substrates, researchers can trace reaction rates across specific metabolic pathways. Integrating metabolomics data with gene expression profiles further enriches the analysis, as we demonstrated in our prior study on glioblastoma metabolic symbiosis. However, the bioinformatics tools for analyzing tracer metabolomics data have been limited. In this protocol, we encourage the researchers to use SIRM and transcriptomics data and to perform the downstream analysis using our software tool DIMet. Indeed, DIMet is the first comprehensive tool designed for the differential analysis of tracer metabolomics data, alongside its integration with transcriptomics data. DIMet facilitates the analysis of stable-isotope labeling and metabolic abundances, offering a streamlined approach to infer metabolic changes without requiring complex flux analysis. Its pathway-based "metabologram" visualizations effectively integrate metabolomics and transcriptomics data, offering a versatile platform capable of analyzing corrected tracer datasets across diverse systems, organisms, and isotopes. We provide detailed steps for sample preparation and data analysis using DIMet through its intuitive, web-based Galaxy interface. To showcase DIMet's capabilities, we analyzed LDHA/B knockout glioblastoma cell lines compared to controls. Accessible to all researchers through Galaxy, DIMet is free, user-friendly, and open source, making it a valuable resource for advancing metabolic research.
Key features
• Glioblastoma tumor spheroids in vitro replicate tumors’ three-dimensional structure and natural nutrient, metabolite, and gas gradients, providing a more realistic model of tumor biology.
• Joint analysis of tracer metabolomics and transcriptomics datasets provides deeper insights into the metabolic states of cells.
• DIMet is a web-based tool for differential analysis and seamless integration of metabolomics and transcriptomics data, making it accessible and user-friendly.
• DIMet enables researchers to infer metabolic changes, offering intuitive and visually appealing "metabologram" outputs, surpassing conventional visual representations commonly used in the field.
Keywords: Metabolomics (代谢组学)Graphical overview
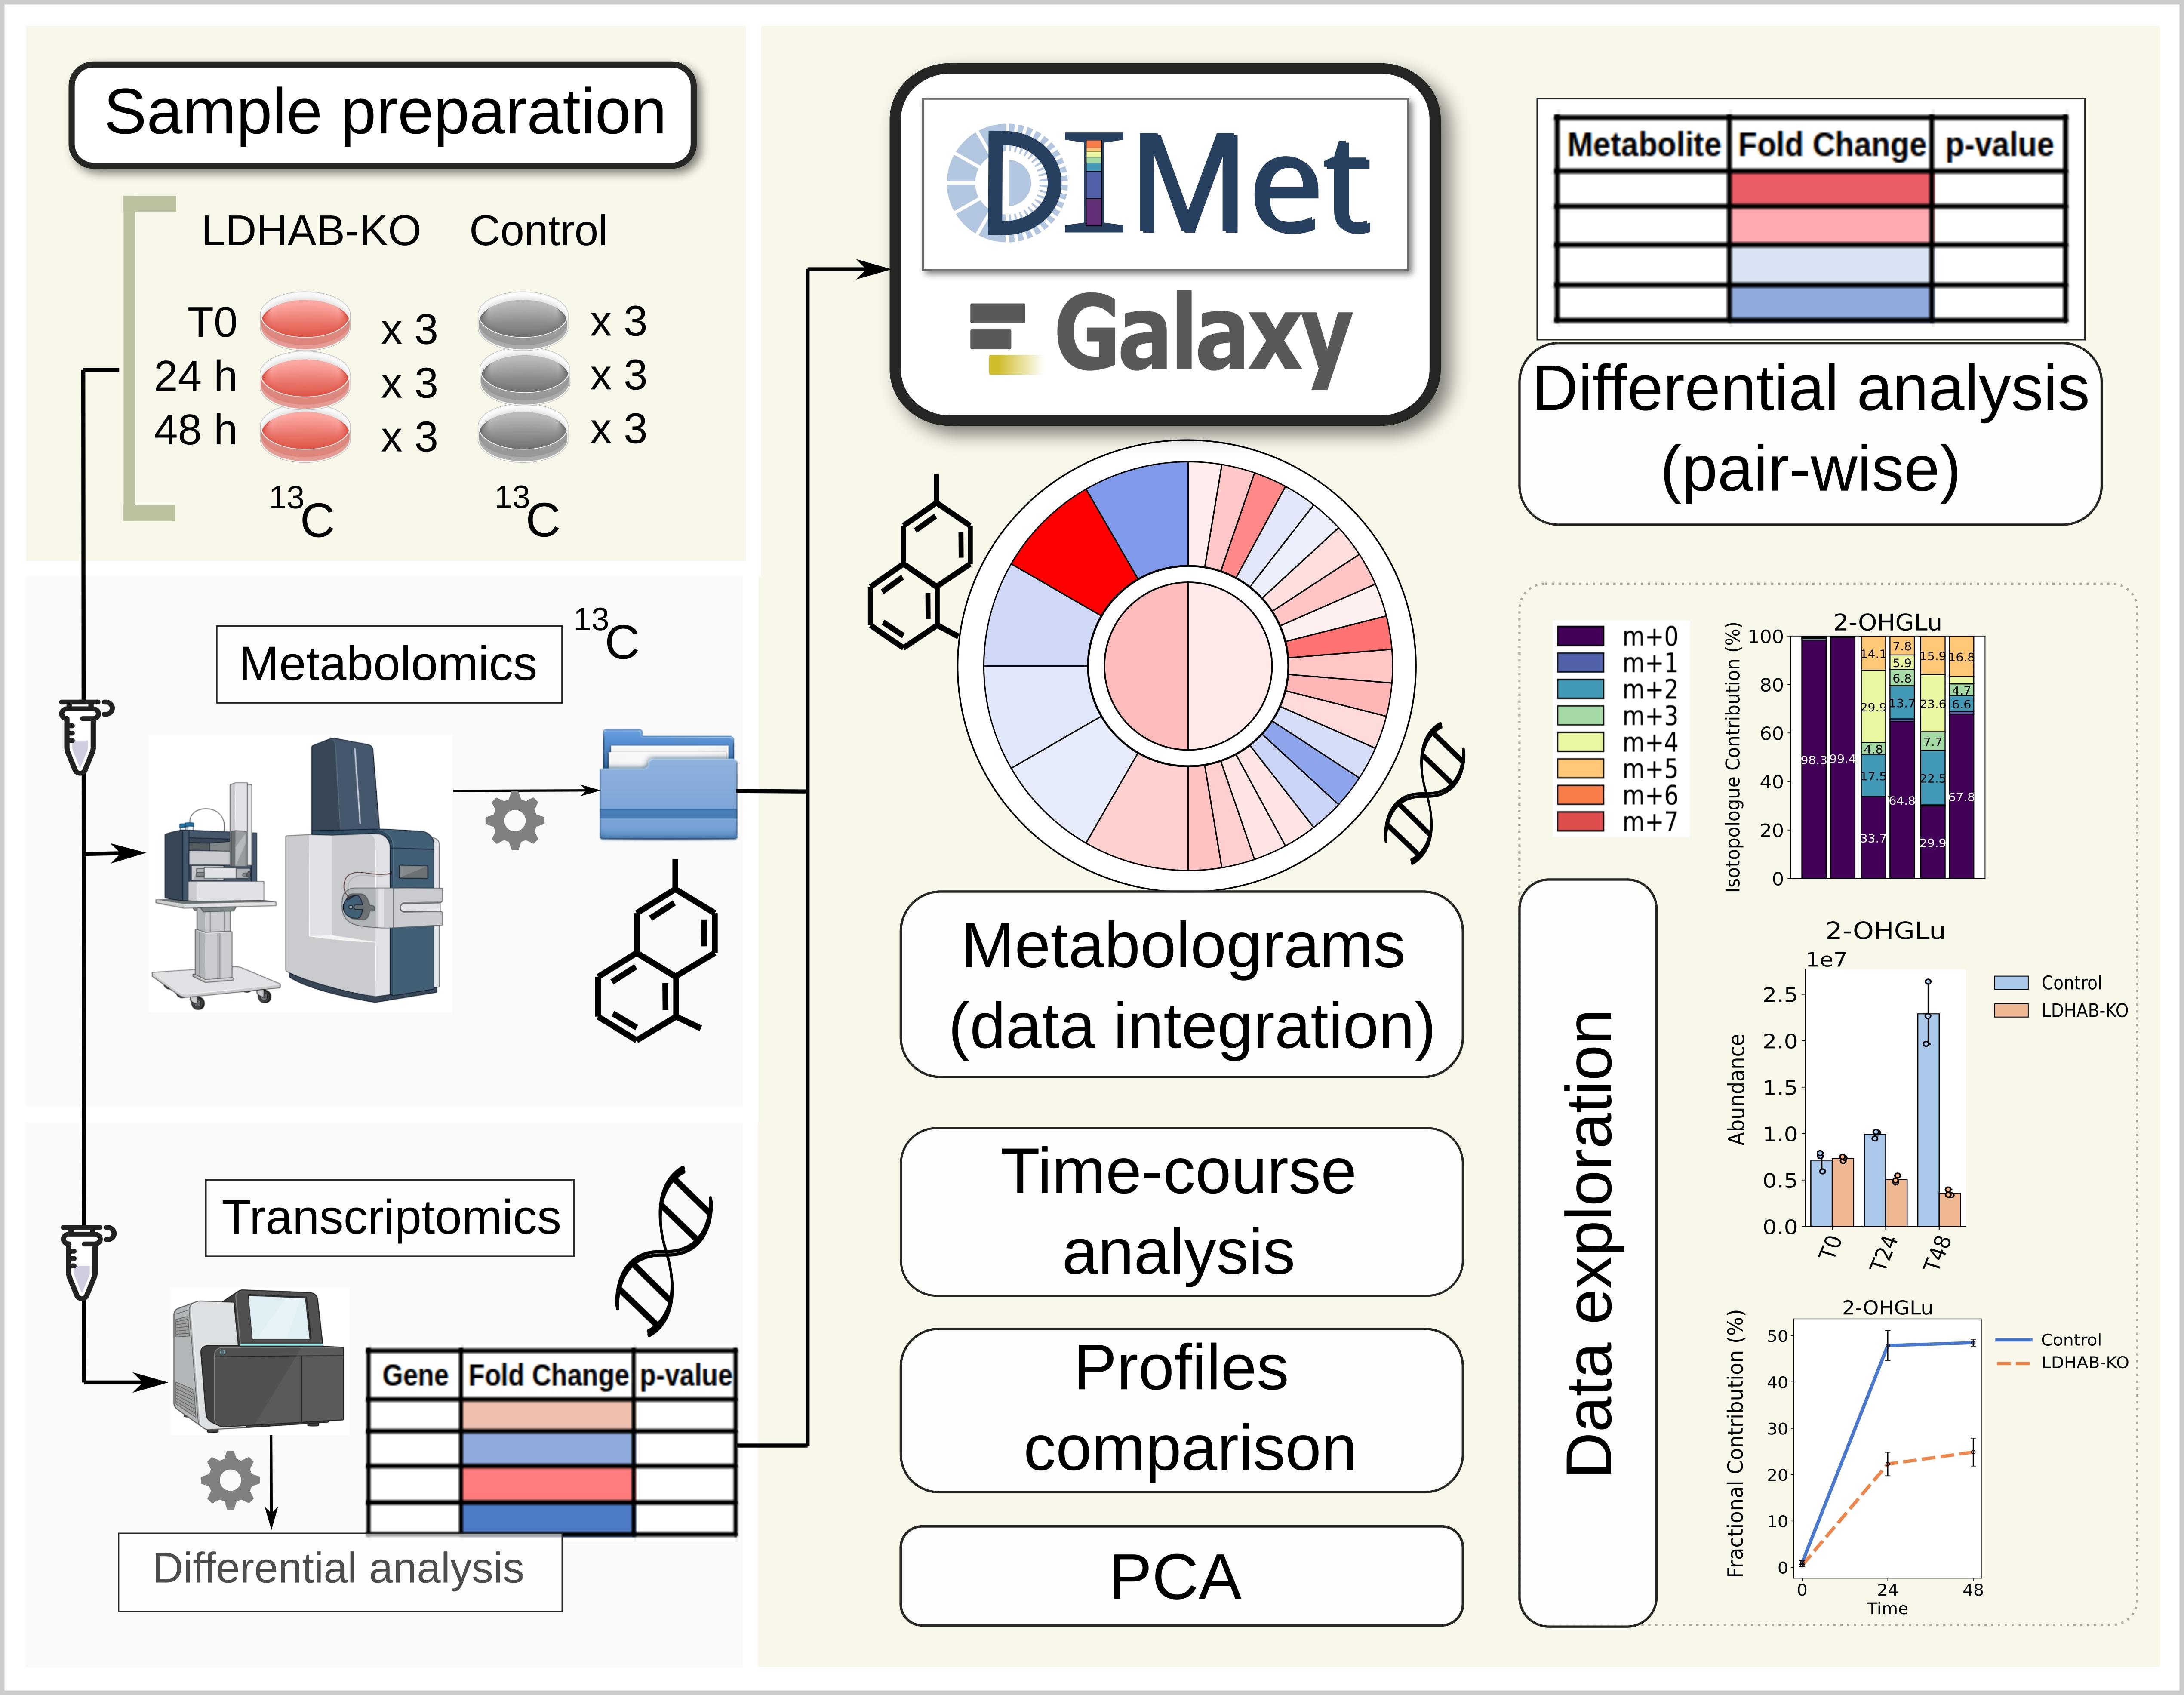
Metabolomics and transcriptomics acquired data undergo downstream analysis with DIMet in Galaxy (image created with BioRender and Inkscape)
Background
Metabolic processes within cells play a major role in tumor adaptation, growth, and proliferation [1]. In the case of glioblastoma (GB), our previous in vitro studies focused on tumor plasticity driven by the hypoxic and acidic microenvironment and highlighted the critical role of lactate dehydrogenases (LDHA, LDHB) in this metabolic symbiosis [2]. We employed omics technologies—specifically transcriptomics and metabolomics—because they provide complementary insights into metabolic pathways. Transcriptomics captures the initial stage of gene expression through the analysis of mRNA transcripts, while metabolomics sheds light on the enzymatic activities associated with transcript translation.
To further characterize metabolic dynamics, we used stable-isotope resolved metabolomics (SIRM), also referred to as tracer or labeled metabolomics [3]. SIRM involves the administration of a stable isotope–labeled substrate to the cells or organisms, allowing to trace the integration of these isotopes into metabolic pathways, thus revealing subsequent biochemical reactions [3–5]. While 13C is the most commonly used isotope, other isotopes are also employed. The resulting corrected data contain the total abundances and labeling information, such as isotopologues and mean enrichment [4,6]. However, previous bioinformatics solutions for analyzing these datasets have exhibited limitations, including statistical frameworks or accessibility [7–11]. Furthermore, flux estimation often requires substantial computational resources and complex parameterization [12,13], creating a barrier to its adoption.
This protocol begins with the preparation of glioblastoma cell lines. Two distinct cell lines are used, P3 sgCont and sgLDHA/B, both generated from P3 wild-type glioblastoma cells through CRISPR-Cas9 editing [2]. For simplicity, we refer to sgCont as control throughout this paper. The sgLDHA/B cell line corresponds to a double knockout (KO) of the LDHA and LDHB genes and is referred to as LDHAB-KO. Along these cell lines, we provide the corresponding SIRM and transcriptomics datasets.
The primary focus of this paper is the data analysis using our recently published tool, DIMet [6], available in its Galaxy interface. DIMet is the first comprehensive tool designed for the differential analysis of tracer metabolomics data integrated with transcriptomics data. This protocol provides a detailed step-by-step guide for using DIMet in Galaxy. Specifically, we performed differential analyses between conditions and/or time points to evaluate total metabolite abundances and isotope labeling. By interpreting these two levels of information together, it becomes possible to infer variations in the production and consumption rates of metabolites, providing a proxy for flux differences [4,9].
We further combined metabolomics and transcriptomics datasets into DIMet's pathway-based metabolograms, addressing the limitations of previous tools. DIMet offers several key advantages: (i) it accommodates the unique requirements of SIRM data, (ii) it integrates data in a pathway-centric manner, (iii) it generates visually ergonomic outputs, and (iv) all functionalities are accessible via the free, user-friendly Galaxy interface. While complex analyses involving multiple isotopes and substrates are not yet supported, DIMet’s features and accessibility more than compensate for this limitation. Without restrictions on the system, organism, or isotope-substrate combination, DIMet in Galaxy can be used for differential analysis of any corrected tracer metabolomics dataset.
Materials and reagents
Biological materials
1. P3 glioblastoma stem-like cells (generated from patient [14] and modified through CRISPR-cas9 editing [2])
Reagents
1. Neurobasal medium (NBM) (Gibco, catalog number: 2110349), storage at 4 °C
2. B27 50× (Thermo Fisher Scientific, catalog number: 17504044), storage at 4 °C
3. FGF basic (PeproTech, catalog number: 100-18B), storage at -20 °C
4. Heparin (Sigma-Aldrich, catalog number: H3149)
5. Penicillin-streptomycin (Dutscher, catalog number: P06-07100), storage at -20 °C
6. Neurobasal medium without glucose (NBMW/O) (Gibco, catalog number: A2477501), storage at 4 °C
7. [13C]6-glucose (Sigma, catalog number: 389374), storage at 4 °C
8. Accutase (Corning, catalog number: 25058CI), storage at -20 °C
9. Phosphate-buffered saline (PBS) (Gibco, catalog number: 14190-094), storage at 4 °C
Solutions
1. Cell culture medium (see Recipes)
Recipes
1. Cell culture medium
Prepare the complete NBM (cNBM) and the complete NBMW/O (cNBMW/O) by adding 10 mL of B27, 20 ng/mL of basic FGF, 100 U/μL of heparin, and 1,000 U/mL of penicillin-streptomycin in 500 mL of medium. Supplement the cNBMW/O with 4.5 mg/mL of [13C]6-glucose ([13C]6-glucose NBM).
Laboratory supplies
1. Filter membrane 0.2 μm (Sartolon Polyamide)
2. Qiagen RNeasy Mini kit (Qiagen, catalog number: 74104)
Equipment
1. CO2 incubator (Panasonic, model: MCO-18AC-PE, catalog number: 13040182)
2. Hypoxia chamber (Heraeus, model: B 5060 EK/CO2, catalog number: 8403096)
3. Vacuum pump (KNF Neuberger, model: N86 KN.18, catalog number: D-79112)
Software and datasets
1. The datasets and software used here are listed in Table 1. The DIMet tool [6] and its companion tool for data formatting, TraceGroomer, are both available through two user-friendly Galaxy web platforms: Galaxy EU [15] and Workflow4Metabolomics (W4M) [16,17]. For this protocol, W4M was chosen because it includes an isotopologue correction tool [18], which is compatible with DIMet and TraceGroomer. No coding skills are required from the user.
Table 1. Software and datasets for data analysis. DIMet and TraceGroomer Galaxy versions are available through Workflow4Metabolomics (W4M) https://workflow4metabolomics.usegalaxy.fr/ and Galaxy EU (https://usegalaxy.eu/).
| Type | Software/dataset/resource | Version | Date | License | Access |
|---|---|---|---|---|---|
| Data | https://zenodo.org/records/13741706 | 0.3 | 10/09/2024 | CC BY | free |
| Software | DIMet in its web Galaxy version (source code: https://github.com/cbib/DIMet) | 0.2.4 | 22/03/2024 | MIT | free |
| Software | Tracegroomer in its web Galaxy version (https://github.com/cbib/TraceGroomer) | 0.1.4 | 06/08/2024 | MIT | free |
| Workflow manager | Galaxy Workflow4Metabolomics (W4M) https://workflow4metabolomics.usegalaxy.fr/ | 23.0 | 06/06/2023 | GPL-3.0 | free |
Procedure
文章信息
稿件历史记录
提交日期: Sep 13, 2024
接收日期: Nov 20, 2024
在线发布日期: Dec 10, 2024
出版日期: Jan 20, 2025
版权信息
© 2025 The Author(s); This is an open access article under the CC BY license (https://creativecommons.org/licenses/by/4.0/).
如何引用
Galvis, J., Guyon, J., Daubon, T. and Nikolski, M. (2025). Using DIMet for Differential Analysis of Labeled Metabolomics Data: A Step-by-step Guide Showcasing the Glioblastoma Metabolism. Bio-protocol 15(2): e5168. DOI: 10.21769/BioProtoc.5168.
分类
生物信息学与计算生物学
系统生物学 > 代谢组学
您对这篇实验方法有问题吗?
在此处发布您的问题,我们将邀请本文作者来回答。同时,我们会将您的问题发布到Bio-protocol Exchange,以便寻求社区成员的帮助。