

Accurate Measurement of Cell Number–Normalized Differential Gene Expression in Cells Treated With Retinoic Acid
视黄酸处理细胞中基于细胞数归一化的差异基因表达精确测量
(*contributed equally to this work) 发布: 2024年11月05日第14卷第21期 DOI: 10.21769/BioProtoc.5106 浏览次数: 2027
评审: Shivaprasad H. SathyanarayanaYoshihiro AdachiAnonymous reviewer(s)

参见作者原研究论文
The authors used this protocol in:

Oct 2021
Advertisement


Abstract
Genome-wide gene expression analysis is a commonly used method to quantitatively examine the transcriptional signature of any tissue or cell state. Standard bulk cell RNA sequencing (RNA-seq) quantifies RNAs in the cells of the tissue type of interest through massive parallel sequencing of cDNA synthesized from the cellular RNA. The subsequent analysis of global RNA expression and normalization of RNA expression levels between two or more samples generally assumes that cells from all samples produce equivalent amounts of RNA per cell. This assumption may be invalid in cells where MYC or MYCN expression levels are markedly different and thus, overall mRNA expression per cell is altered. Here, we describe an approach for RNA-seq analysis of MYCN-amplified neuroblastoma cells during treatment with retinoic acid, which causes dramatic downregulation of MYCN expression and induces growth arrest and differentiation of the cells. Our procedure employs spiked-in RNA standards added in ratio to the number of cells in each sample prior to RNA extraction. In the analysis of differential gene expression, the expression level of each gene is standardized to the spiked-in RNA standard to accurately assess gene expression levels per cell in conditions of high and low MYCN expression. Our protocol thus provides a step-by-step experimental approach for normalizing RNA-seq expression data on a per-cell-number basis, allowing accurate assessment of differential gene expression in cells expressing markedly different levels of MYC or MYCN.
Key features
• High levels of MYC and MYCN expression in cancer cells cause substantial increases in the levels of overall mRNA expression per cell.
• RNA-seq using control RNAs spiked-in on a per-cell basis more accurately reflects global expression changes, when comparing cell populations with substantially different MYCN expression levels.
• In MYCN-amplified neuroblastoma, retinoic acid dramatically decreases MYCN expression levels, resulting in large changes in overall RNA expression levels per cell.
Keywords: RNA-sequencing (RNA测序)Graphical overview
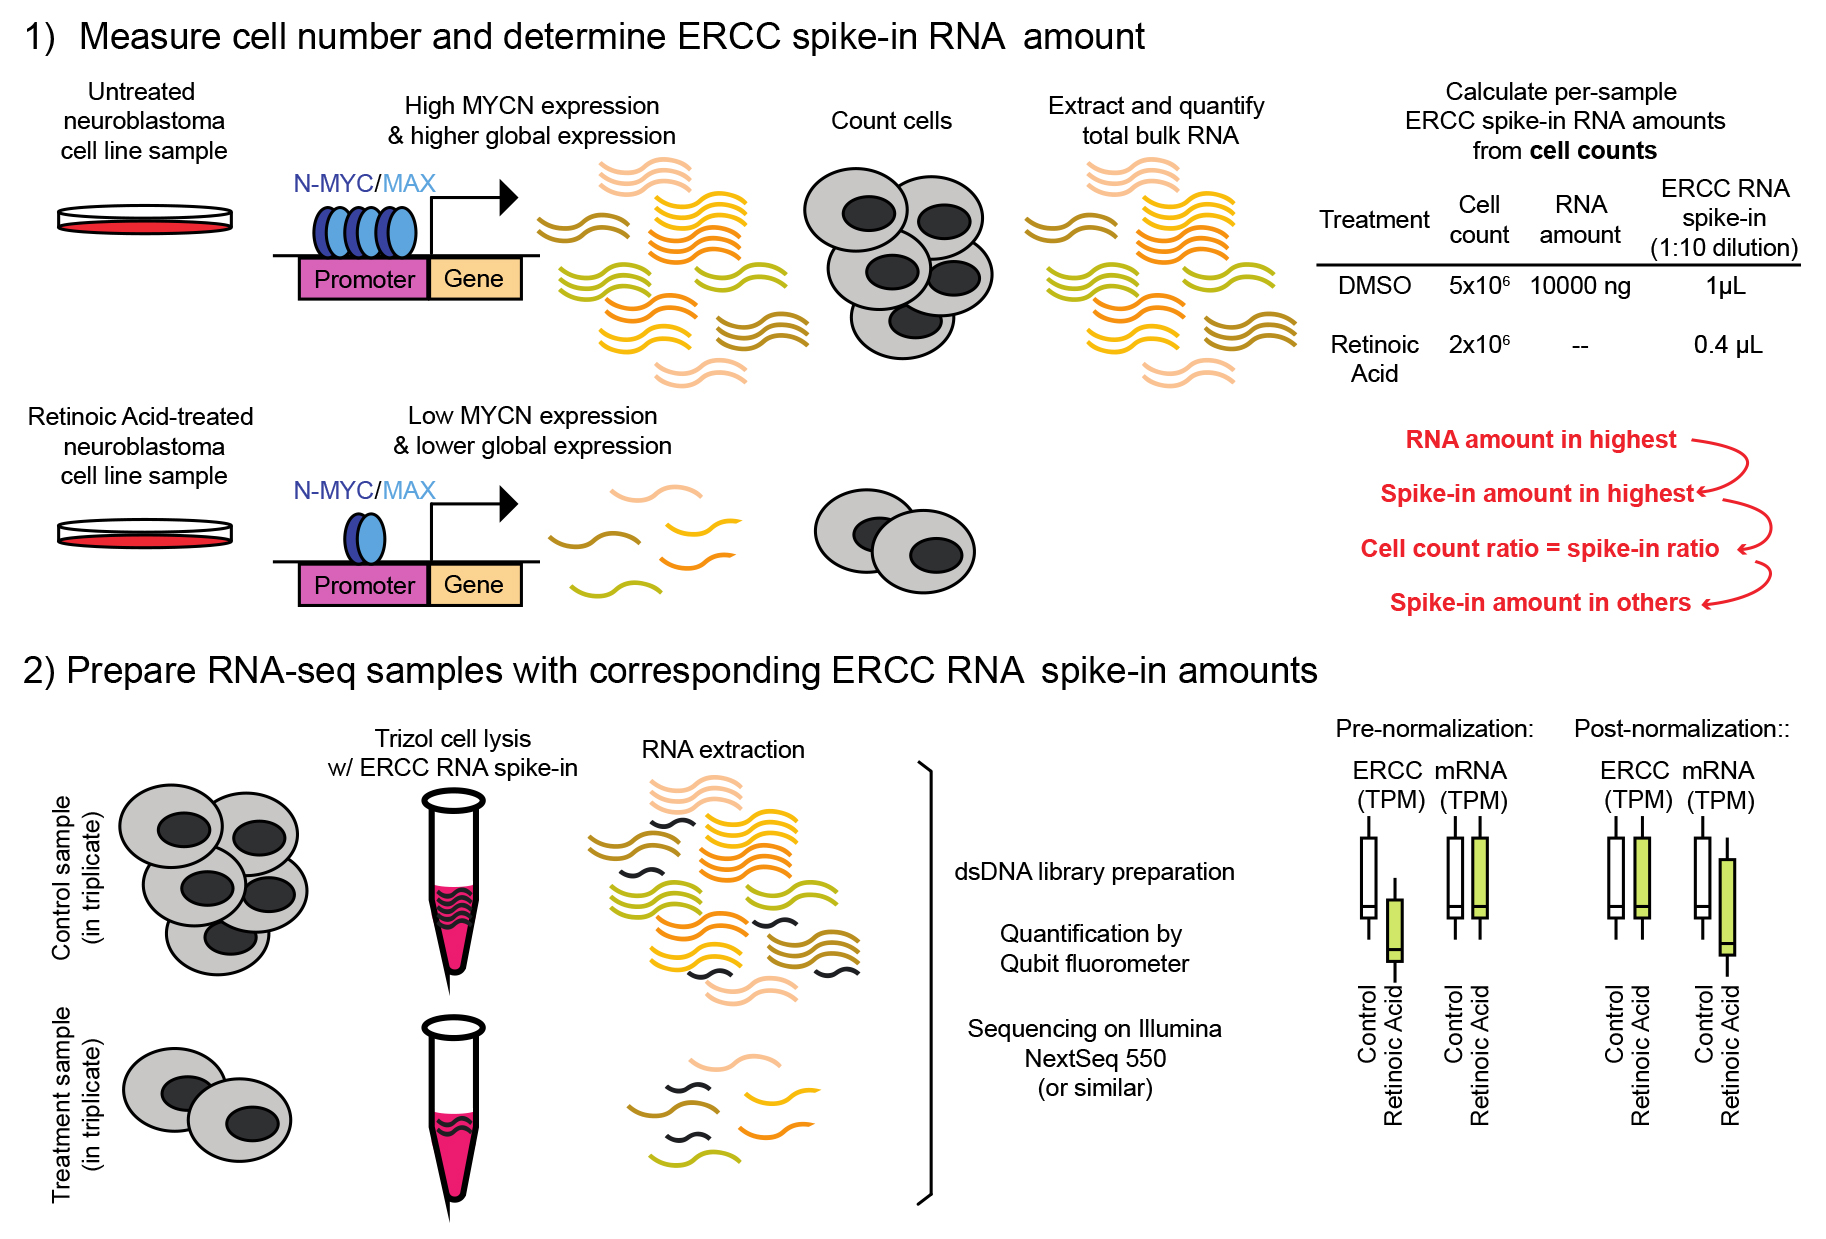
Spike-in-controlled RNA sequencing in MYCN-amplified neuroblastoma
Background
Transcriptional dysregulation is a driver in the development of malignancy. MYC family members, e.g., MYCN, MYC, and MYCL, are powerful oncogenes that promote tumorigenesis in a wide variety of human tissues [1–6]. Elevated expression of MYC family members can occur through several mechanisms, including amplification of the gene locus, chromosomal translocation with enhancer hijacking, and new enhancer formation through DNA variation [1,6–10]. High expression of MYC family members is associated with rapidly proliferating tumors and poor patient outcomes [11–14]. MYC proteins are helix-loop-helix (bHLH) transcription factors that form heterodimers with MAX and, in normal cells, primarily bind the core promoters of actively transcribed genes [15–17]. Studies in multiple cancer types have demonstrated that high levels of MYC or MYCN increase the binding of MYC proteins to the enhancers and promoters of actively transcribed genes, effectively regulating the entire expressed genome [18–20]. Thus, the predominant effect of high MYC expression levels by cancer cells is increased expression levels of genes actively transcribed by the cells, commonly called “transcriptional amplification” [21].
Transcriptional amplification of the inherent cellular gene expression program through high expression of MYC family members plays a critical role in tumor initiation for many tissue types, including pediatric neuroblastoma. Neuroblastoma is a tumor of the peripheral sympathetic nervous system that originates from neuroblasts of the migratory neural crest. Approximately 20% of high-risk tumors have genomic amplification of MYCN, often as double-minute chromatin bodies, leading to hundreds of copies of MYCN per cell [2]. In an independent subset of high-risk neuroblastoma, MYC is highly expressed via enhancer hijacking [6]. In our previous study [22], we showed that MYCN-amplified neuroblastoma cells undergo growth arrest and differentiation upon treatment with retinoic acid, which leads to a change in the core regulatory transcriptional circuitry with changes in cell state, accompanied by downregulation of MYCN expression. In this study, we assessed differential gene expression between neuroblastoma samples with high and low MYCN expression due to retinoic acid treatment.
To analyze cell states and transcriptional programs, standard RNA sequencing measures the relative abundance of RNAs in the tissue type of interest through massive parallel sequencing of RNA-derived cDNA [23]. Standard analysis of genome-wide RNA expression between two or more samples generally assumes that cells from each sample produce equivalent amounts of RNA per cell. However, previous studies have demonstrated that this analysis algorithm can lead to erroneous interpretations when MYC or MYCN acts as a transcriptional amplifier [18,19,24]. In the case of cancer cells with high levels of expression of MYC or MYCN, each cell produces 2–3× more RNA per expressed gene [18,21,24]. Retinoic acid–treated neuroblastoma cells downregulated MYCN, so we expected 2–3 fold less total RNA per cell [18], potentially confounding genome-wide expression analysis and necessitating a tailored experimental strategy. Here, we describe a step-by-step experimental and computational approach using spiked-in RNA standards from the External RNA Controls Consortium (ERCC) that allowed us to compare each gene's expression in a pool of cells in the context of the effect of downregulated MYCN. Our method can be used for a wide variety of other cancer tissues in which transcriptional amplification through any MYC family member comes into play and profoundly impacts the assessment of cancer cell gene expression signatures.
Materials and reagents
Biological materials
BE2C cells (American Type Culture Collection, CRL-2268)
Reagents
Retinoic acid/ATRA (all-trans retinoic acid) (Sigma-Aldrich, catalog number: R2625)
Dimethylsulfoxide (DMSO) (American Type Culture Collection, catalog number: 4-X)
RPMI medium (Thermo Fisher, catalog number: 11875-135)
External RNA Controls Consortium (ERCC) spike-in mix 1 (Thermo Fisher, catalog number: 4456740)
TRIzol (Invitrogen, catalog number: 15596018)
RNeasy mini kit (Qiagen, catalog number: 74104)
RNase-free DNase kit (Qiagen, catalog number: 79254)
Chloroform (Thermo Fisher, catalog number: J67241.AP)
Isopropanol (Thermo Fisher, catalog number: T036181000CS)
Ethanol (Thermo Fisher, catalog number: T038181000)
DNase (Qiagen, catalog number: 79254)
DMSO-Dimethylsulfoxide tissue culture grade (ATCC, catalog number: 4-X)
Library preparation kit: Illumina® Stranded Total RNA Prep, ligation with Ribo-Zero Plus (catalog number: 20040525)
Library quantification kit: Agilent TapeStation 4200 D1000 ScreenTapes (Agilent, catalog numbers: G2991AA, 5067-5582, 5067-5583, 5067-5602, 5067-5586)
FBS (Sigma-Aldrich, catalog number: F2442)
Trypsin 0.05% EDTA (Thermo Fisher, catalog number: 25300-120)
Trypan blue 0.4% (Gibco, catalog number: 15250061)
Solutions
ATRA, 10 mM (see Recipes)
75% ethanol (see Recipes)
Recipes
ATRA, 10 mM
ATRA was purchased as a dry powder. To achieve a final concentration of 100 mM, dissolve 50 mg of ATRA in 1.6 mL of DMSO. Bring the powder into solution by vortexing for 30 s. To bring to a final concentration of 10 mM, dilute the 100 mM stock solution 1:10 by following the below dilution.
Reagent Final concentration Quantity or Volume ATRA 100 mM 0.1 mL DMSO n/a 0.9 mL Total 10 mM 1 mL 75% ethanol
Reagent Final concentration Quantity or Volume Ethanol 100% 7.5 mL H2O n/a 2.5 mL Total 75% 10 mL
Laboratory supplies
6-well plates, polystyrene microplates (Falcon, catalog number: 353046)
Filtered IsoTipTM tips (universal fit racked pipet tips) (Corning, catalog numbers: 4823, 4808, 4809)
15 mL tubes, high clarity PP centrifuge tube (Falcon, catalog number: 352096)
1.5 mL tubes (Eppendorf, catalog number: 022363204)
Glass pipettes (Pasteur Pipets, Fisherbrand, catalog number: 13-678-20C)
Equipment
Countess 3 automated cell counter (Invitrogen, catalog number AMQAX2000)
Refrigerated centrifuge (Eppendorf, model: 5415R)
Spectrophotometer (used for quantification of extracted RNA) (Nanodrop, model: ND-1000)
Qubit fluorometer (Thermo Fisher, catalog number: Q33238)
TapeStation 4200 (Agilent, model: 4200)
Illumina NovaSeq 6000
Software and datasets
ERCC spike-in sequences:
https://tsapps.nist.gov/srmext/certificates/documents/SRM2374_Sequence_v1.FASTA
Reference gene list as GTF, e.g., here, RefSeq:
ftp://ftp.ensembl.org/pub/grch37/current/gtf/homo_sapiens/Homo_sapiens.GRCh37.87.chr.gtf.gz
Burrows-Wheeler-based alignment tools, e.g., here, hisat2 [25]
https://academic.oup.com/bioinformatics/article/20/3/307/185980?login=false
Relevant genome reference FASTA files, e.g., here:
https://hgdownload.soe.ucsc.edu/goldenPath/hg19/bigZips/hg19.fa.gz
Read quantification software, e.g., here, htseq [26]
R package affy [27]
Procedure
文章信息
稿件历史记录
提交日期: Mar 11, 2024
接收日期: Sep 8, 2024
在线发布日期: Oct 13, 2024
出版日期: Nov 5, 2024
版权信息
© 2024 The Author(s); This is an open access article under the CC BY-NC license (https://creativecommons.org/licenses/by-nc/4.0/).
如何引用
Readers should cite both the Bio-protocol article and the original research article where this protocol was used:
- Weichert-Leahey, N., Zimmerman, M. W., Berezovskaya, A., Look, A. T. and Abraham, B. J. (2024). Accurate Measurement of Cell Number–Normalized Differential Gene Expression in Cells Treated With Retinoic Acid. Bio-protocol 14(21): e5106. DOI: 10.21769/BioProtoc.5106.
- Zimmerman, M. W., Durbin, A. D., He, S., Oppel, F., Shi, H., Tao, T., Li, Z., Berezovskaya, A., Liu, Y., Zhang, J., et al. (2021). Retinoic acid rewires the adrenergic core regulatory circuitry of childhood neuroblastoma. Sci Adv. 7(43): eabe0834.
分类
癌症生物学 > 癌症生物化学
生物信息学与计算生物学
分子生物学 > RNA > 转录
您对这篇实验方法有问题吗?
在此处发布您的问题,我们将邀请本文作者来回答。同时,我们会将您的问题发布到Bio-protocol Exchange,以便寻求社区成员的帮助。