

Quantitative Analysis of Fish Morphology Through Landmark and Outline-based Geometric Morphometrics with Free Software
利用标记点和轮廓几何形态测量结合免费软件对鱼类形态进行定量分析
发布: 2024年10月20日第14卷第20期 DOI: 10.21769/BioProtoc.5087 浏览次数: 2436
评审: Olga KopachSergii RomanenkoAnonymous reviewer(s)


Abstract
Morphology underpins key biological and evolutionary processes that remain elusive. This is in part due to the limitations in robustly and quantitatively analyzing shapes within and between groups in an unbiased and high-throughput manner. Geometric morphometrics (GM) has emerged as a widely employed technique for studying shape variation in biology and evolution. This study presents a comprehensive workflow for conducting geometric morphometric analysis of fish morphology. The step-by-step manual provides detailed instructions for using popular free software, such as the TPS series, MorphoJ, ImageJ, and R, to carry out generalized Procrustes analysis (GPA), principal component analysis (PCA), discriminant function analysis (DFA), canonical variate analysis (CVA), mean shape analysis, and thin plate spline analysis (TPS). The Momocs package in R is specifically utilized for in-depth analysis of fish outlines. In addition, selected functions from the dplyr package are used to assist in the analysis. The full process of fish outline analysis is covered, including extracting outline coordinates, converting and scaling data, defining landmarks, creating data objects, analyzing outline differences, and visualizing results. In conclusion, the current protocol compiles a detailed method for evaluating fish shape variation based on landmarks and outlines. As the field of GM continues to evolve and related software develops rapidly, the limitations associated with morphological analysis of fish are expected to decrease. Interoperable data formats and analytical methods may facilitate the sharing of morphological data and help resolve related scientific problems. The convenience of this protocol allows for fast and effective morphological analysis. Furthermore, this detailed protocol could be adapted to assess image-based differences across a broader range of species or to analyze morphological data of the same species from different origins.
Key features
• This protocol provides a comprehensive set of commonly used GM-analyzing methods and visualizing skills plus supporting information to help assess the appropriate analysis method
• By incorporating both landmarks and outlines, this protocol facilitates a thorough analysis of two-dimensional shape variation in fish, covering a wide range of morphological features
• The simplified workflow and detailed procedures make it accessible for non-experienced users to successfully complete the analysis while also providing valuable insights for experienced users
Keywords: Morphological variation (形态变异)Graphical overview
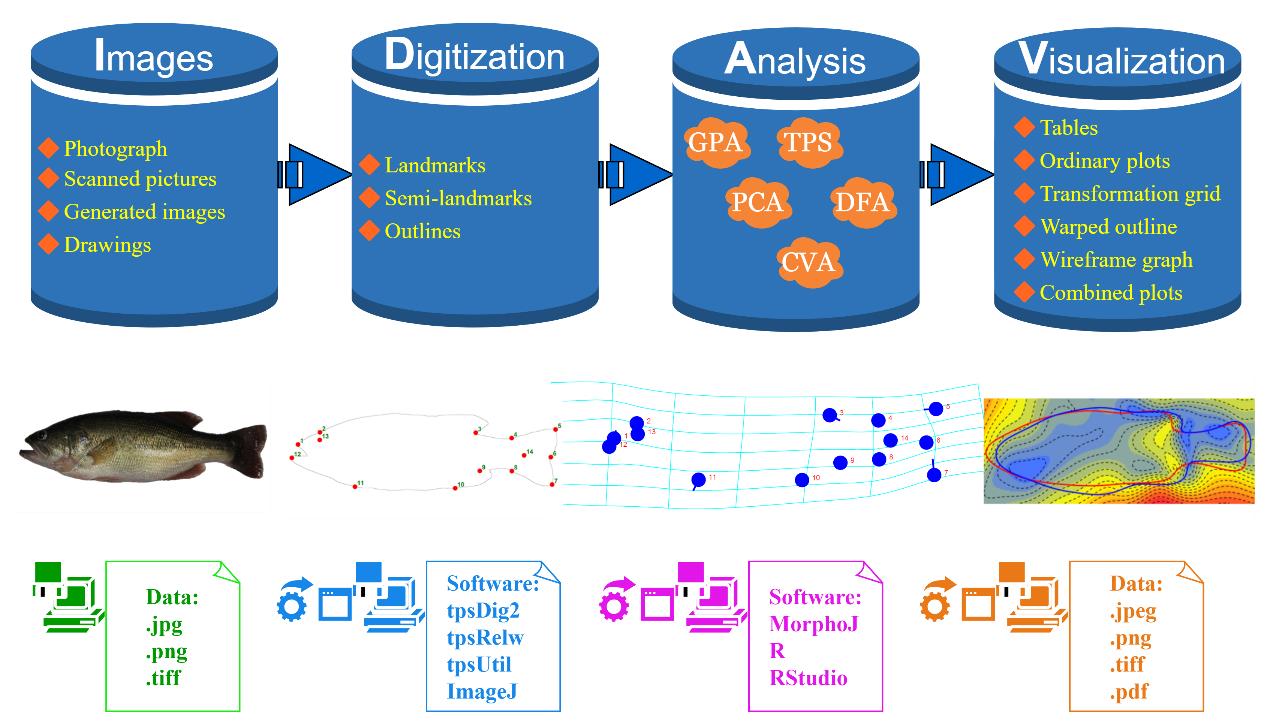
Workflow for conducting geometric morphometrics analysis on fish. The steps include image acquisition as data sources, digitization of fish morphology using landmark-based methods, analysis of shape variation characteristics, and visualization of the results in relation to biological interpretation. Largemouth bass (Micropterus salmoides) is used as an example in the schematic representation.
Background
Morphology has long been recognized as a fundamental trait in the field of biology. The intricate relationship between morphogenetic and evolutionary factors, as well as morphospaces, underscores the need for multivariate methods in biological and ecological research [1]. Geometric morphometrics (GM) has emerged as a widely utilized approach for the quantitative analysis of shape variation, particularly in the domains of biology and anthropology. It has become one of the primary methods for assessing essential morphological variables because it provides a quantitative/unbiased approach and morphological comparison [2]. GM has been instrumental in addressing a diverse array of questions related to morphological variation, including population differences, developmental patterns, responses to environmental factors, evolutionary trends, and functional morphology. Within the realm of morphology, three styles of morphometrics are commonly employed: traditional morphometrics, landmark-based GM, and outline-based GM [3]. In general, GM encompasses the following analytical steps: data acquisition, morphological variation analysis, results visualization, and interpretation.
For novice practitioners, the intricacy of GM often arises from the complexities associated with data construction and transformation, as well as the diverse array of analyzing methods available. Throughout the process, landmarks serve as the foundation for quantifying shape. GM analysis can be conducted using distinct landmark configurations for landmarks and semi-landmarks [4]. Traditionally, there are three types of landmarks [5]. However, as GM has advanced, the classification system for landmarks has evolved, with a more convenient typology being utilized in applied studies [6,7]. In the updated typology, the conventional roster of landmark points can be categorized into six types, intended to supersede the three types outlined in Bookstein [5]. This new classification corresponds to the different operational origins of the points along the curve or curves on which they are situated [6]. The process of landmarking and classifying landmarks may heavily rely on biological interpretation, and the major limitation of these types of techniques is that the labeling-analysis processes are all semi-manual or manual. Nevertheless, landmarking analysis remains the primary technique used in GM to this day. The characteristics of landmarks are described below.
Type I landmarks (anatomical landmarks)
Definition:
Points of clear biological or anatomical significance that can be precisely and consistently identified across all specimens.
These landmarks correspond to specific, discrete, and easily recognizable anatomical features.
Examples:
The tip of the nose.
The corner of the eye.
The junction between bones.
Advantages:
High reliability and repeatability.
Easily comparable across specimens due to clear homology.
Applications:
Frequently used in studies of skeletal morphology and other well-defined anatomical structures.
Type II landmarks (mathematical landmarks)
Definition:
Points defined by geometric properties such as maxima or minima of curvature, or points where certain geometric properties change.
These landmarks may not correspond to specific anatomical features but are identified based on their geometric properties.
Examples:
The point of maximum curvature along a bone.
The deepest point in a notch.
Advantages:
Useful for capturing shape information where anatomical landmarks are not clearly defined.
Can provide additional geometric context to the shape.
Applications:
Often used in conjunction with Type I landmarks to provide a more comprehensive shape analysis.
Type III landmarks (constructed landmarks)
Definition:
Points defined by their relative position or constructed based on other landmarks.
These landmarks are not associated with specific anatomical features but are placed based on their geometric relationship to other landmarks.
Examples:
The midpoint between two anatomical landmarks.
Points evenly spaced along a curve or surface.
Advantages:
Flexible and can be used to outline complex shapes.
Useful in capturing the overall geometry of a structure.
Applications:
Frequently used in semi-landmark analysis to capture the shape of curves and surfaces where fixed landmarks are insufficient.
Procrustes superimposition serves as the foundational step for subsequent analysis in GM [8]. Biologists have grappled with aligning the method of "Cartesian transformations" and "transformation grid" with geometric patterns since its original exposition [9]. Three decades ago, the concept of "morphometric synthesis" emerged, combining Procrustes shape coordinates with thin-plate spline (TPS) renderings for various multivariate statistical comparisons [10]. However, a concluding discussion suggests that the current toolkit of GM, centered on Procrustes shape coordinates and TPS, may be too limited to accommodate the interpretive needs of evolutionary and developmental biology [11]. Common methods used to identify major modes of shape variation and determine group differences include principal component analysis (PCA), TPS, discriminant function analysis (DFA), partial least squares (PLS), and canonical variate analysis (CVA). The interpretation of these methods is based on biological questions or hypotheses, combining patterns of shape variation, key landmarks or curves, and findings with relevant evolutionary or ecological factors.
GM has experienced a surge in applications within evolutionary biology and ecology, particularly with the use of three-dimensional imaging data [12]. However, the majority of studies involving fish morphology are based on two-dimensional data. GM analysis in fisheries primarily focuses on species taxonomy, group diversity, individual development and evolution, and ecomorphological variation [13]. The development of software and the reduction of technical limitations in analysis may enhance fish research. GM has evolved alongside advancements in theory and technology, resulting in a variety of software and analysis methods. There are large pre-existing datasets of fish images that can be analyzed using appropriate GM methods. However, several analysis techniques are often required for a single research project, which can present challenges for novices. Consequently, this protocol aims to compile a comprehensive set of methods for conducting GM analysis on fish using two-dimensional data. Although there are no established standards for performing GM analysis, advancements in technology are crucial for characterizing variations in fish body shape. Furthermore, it is anticipated that this approach will facilitate the sharing of morphological data and help resolve related scientific problems. [14], potentially expediting scientific advancements in the field of fish biology and ecology [15].
Software and datasets
Software:
tpsDig2 Version 2.32 (https://www.sbmorphometrics.org/soft-dataacq.html, accessed January 31, 2023)
tpsUtil Version 1.82 (https://www.sbmorphometrics.org/soft-tps.html, accessed January 31, 2023)
tpsRelw Version 1.75 (https://www.sbmorphometrics.org/soft-utility.html, accessed January 31, 2023)
ImageJ 1.54i (https://imagej.net/ij/download.html, accessed March 13, 2023) [16]
MorphoJ Version 1.08.01 (https://morphometrics.uk/MorphoJ_page.html)
R programs (https://cran.r-project.org)
RStudio (https://posit.co/)
R package of Momocs (https://cran.r-project.org/web/packages/Momocs/index.html)
This protocol is running on Windows 11 (64-bit). Taking into account the compatibility of the operating system, the software tutorial, and the possible requirement of preinstalling a version of Java, please download and install all the necessary software: tpsUtil version 1.82, tpsDig2 version 2.32, tpsRelw version 1.75 [17], MorphoJ version 1.08.01 [18], R version 4.3.2 [19], and RStudio 2023.09.1 [20].
Website
The two AI-based background-remover tools are used to extract fish by removing the image background.
Digitized images
Four groups of largemouth bass (Micropterus salmoides) images were utilized in this study. Two groups were obtained by photographing fish cultured in farm ponds located in Foshan city, while the other two groups of images were sourced from the internet. When photographing the fish, the digital camera was fixed in position with the lens perpendicular to the ground. The fish was placed horizontally on a solid-colored background directly beneath the camera. If necessary, soft materials were used to adjust the position of the fish to ensure its body axis was horizontal and the head was facing left. The photos were taken in macro mode after focusing and were stored in .jpeg format. The size of the photos depended on the camera's capabilities, with sizes between 2 and 10 MB considered appropriate. The internet images were sourced from Microsoft Bing Images (https://cn.bing.com/images/feed?form=Z9LH, accessed April 4, 2024) and Google Images (https://www.google.com.hk/imghp?hl=en&ogbl, accessed April 4, 2024) using the query terms “largemouth bass,” “Micropterus salmoides,” and “largemouth bass (Micropterus salmoides)”. All images used in the current experiment included fish with sufficient resolution, showing a normal appearance and an integrated outline in left/right lateral views [21]. For self-captured JPEG digital photographs, the file size was greater than 2266 KB. The internet-sourced images, whether in .jpg, .png, or other file formats, were converted to .jpeg (.jpg) format, with a minimum size of 14 KB used in the present research. Finally, four groups of mature largemouth bass images were included in this research: LB-FF-FF (feeding with frozen bait, n = 44), LB-FF-FS (feeding with artificial feed, n = 42), LB-IN-DH (internet-sourced realistic painting, n = 23), and LB-IN-PH (internet-sourced picture, n = 30).
Procedure
文章信息
稿件历史记录
提交日期: Jun 12, 2024
接收日期: Aug 25, 2024
在线发布日期: Sep 13, 2024
出版日期: Oct 20, 2024
版权信息
© 2024 The Author(s); This is an open access article under the CC BY-NC license (https://creativecommons.org/licenses/by-nc/4.0/).
如何引用
Luo, D. (2024). Quantitative Analysis of Fish Morphology Through Landmark and Outline-based Geometric Morphometrics with Free Software. Bio-protocol 14(20): e5087. DOI: 10.21769/BioProtoc.5087.
分类
生物信息学与计算生物学
生物科学 > 生物技术
环境生物学 > 海洋脊椎动物
您对这篇实验方法有问题吗?
在此处发布您的问题,我们将邀请本文作者来回答。同时,我们会将您的问题发布到Bio-protocol Exchange,以便寻求社区成员的帮助。