

Automated Layer Analysis (ALAn): An Image Analysis Tool for the Unbiased Characterization of Mammalian Epithelial Architecture in Culture
自动层次分析(ALAn):用于无偏见表征培养中哺乳动物上皮结构的图像分析工具
发布: 2024年04月20日第14卷第8期 DOI: 10.21769/BioProtoc.4971 浏览次数: 4414
评审: Ralph Thomas BoettcherKaty RothenbergSusanne ReinhardtHsih-Yin Tan
参见作者原研究论文
The authors used this protocol in:

Mar 2023
Advertisement


Abstract
Cultured mammalian cells are a common model system for the study of epithelial biology and mechanics. Epithelia are often considered as pseudo–two dimensional and thus imaged and analyzed with respect to the apical tissue surface. We found that the three-dimensional architecture of epithelial monolayers can vary widely even within small culture wells, and that layers that appear organized in the plane of the tissue can show gross disorganization in the apical-basal plane. Epithelial cell shapes should be analyzed in 3D to understand the architecture and maturity of the cultured tissue to accurately compare between experiments. Here, we present a detailed protocol for the use of our image analysis pipeline, Automated Layer Analysis (ALAn), developed to quantitatively characterize the architecture of cultured epithelial layers. ALAn is based on a set of rules that are applied to the spatial distributions of DNA and actin signals in the apical-basal (depth) dimension of cultured layers obtained from imaging cultured cell layers using a confocal microscope. ALAn facilitates reproducibility across experiments, investigations, and labs, providing users with quantitative, unbiased characterization of epithelial architecture and maturity.
Key features
• This protocol was developed to spatially analyze epithelial monolayers in an automated and unbiased fashion.
• ALAn requires two inputs: the spatial distributions of nuclei and actin in cultured cells obtained using confocal fluorescence microscopy.
• ALAn code is written in Python3 using the Jupyter Notebook interactive format.
• Optimized for use in Marbin-Darby Canine Kidney (MDCK) cells and successfully applied to characterize human MCF-7 mammary gland–derived and Caco-2 colon carcinoma cells.
• This protocol utilizes Imaris software to segment nuclei but may be adapted for an alternative method. ALAn requires the centroid coordinates and volume of nuclei.
Graphical overview
Background
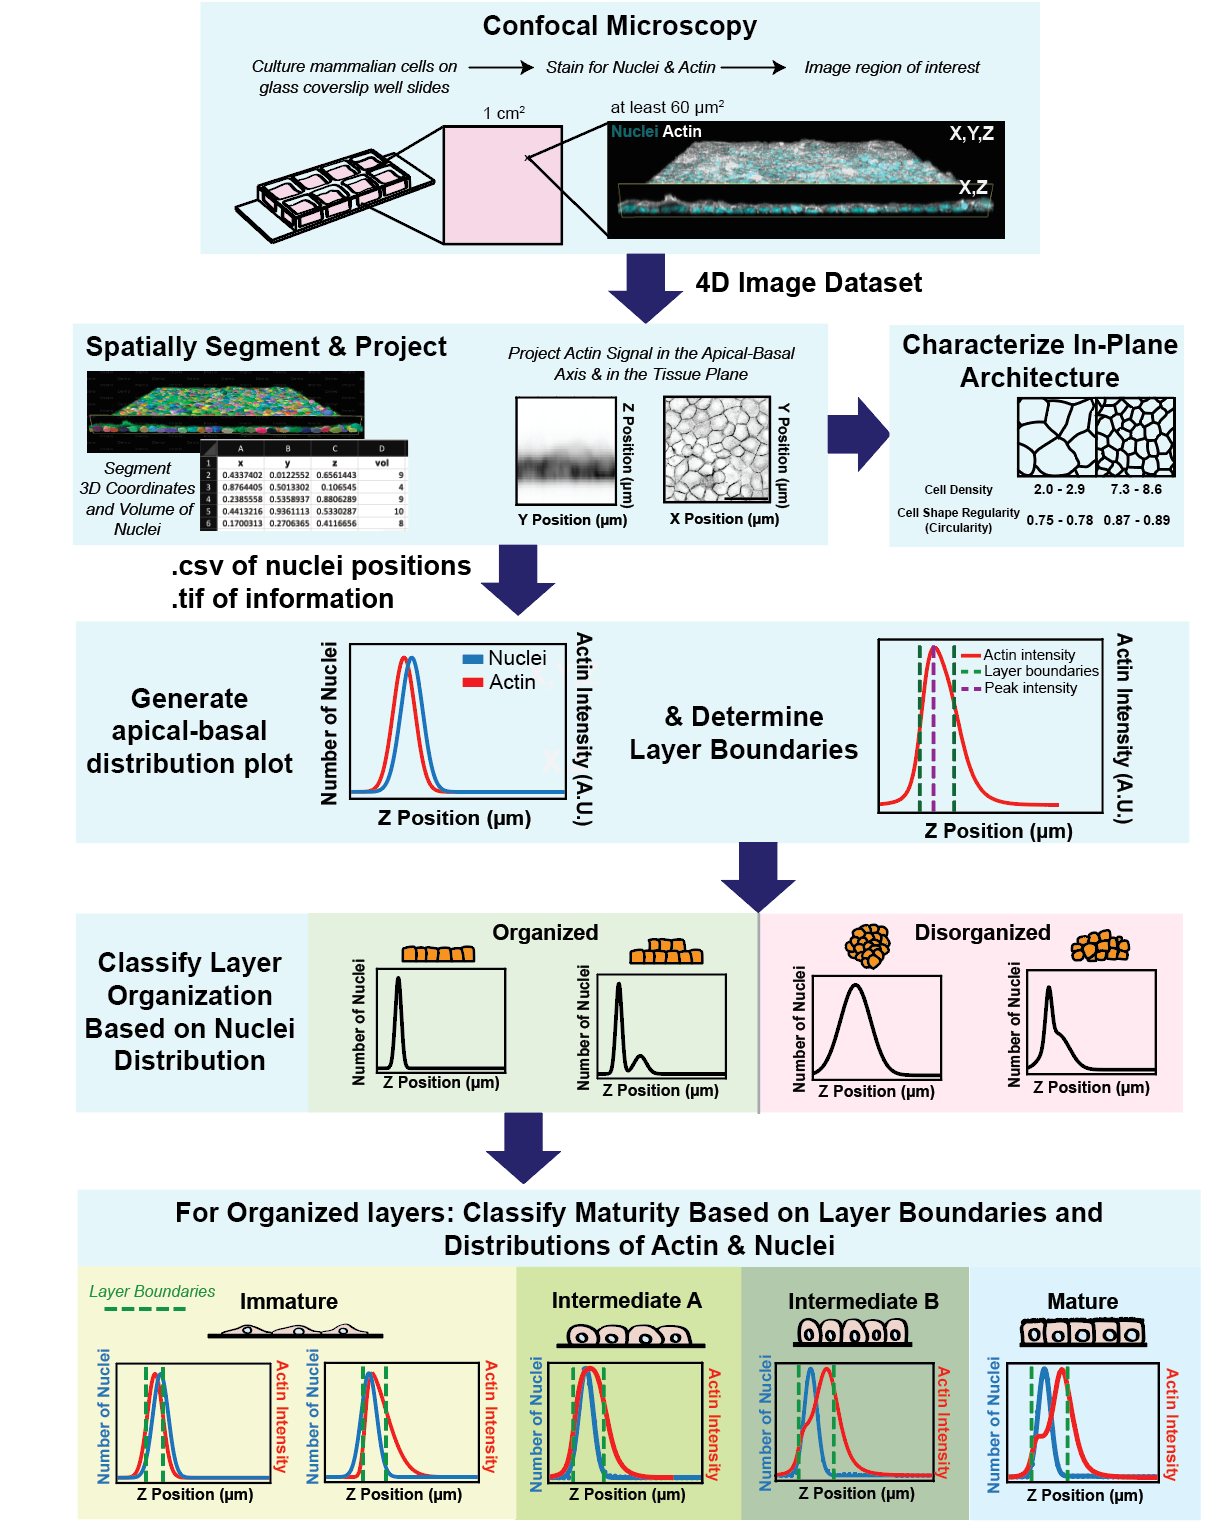
We developed a tool for the unbiased analysis of layer architecture (Automated Layer Analysis or ALAn) for two reasons. Firstly, cultured epithelial architecture can vary drastically between experiments, and we found this can be the case even across a single 1 mm2 culture well [1]. Secondly, epithelial tissues are commonly considered to be pseudo–two dimensional, meaning that architecture is primarily considered with respect to the tissue plane/surface. We found that this perspective is not always predictive of architecture with respect to tissue depth (the apical-basal axis) [1]. We are interested in the mechanical and biological parameters that contribute to epithelial layer architecture and we developed this tool to quantify architecture development over time and test the effect of plating density, culture time, and presence of cadherin-mediated adhesion on architecture. Due to the variability in the shape of layers and the complexity of attempting to perform 3D analysis manually, it was important to us to develop an unbiased and automated tool that requires as little user input as possible. As a consequence of developing ALAn, we identified a developmental series of layer architectures that progress through the process of epithelialization, whereby individual cells form a tissue layer [1,2]. Our quantifications of cell height, cell density, and circularity show distinct morphological regimes for each architecture.
Several tools exist for the analysis of epithelial topology in the plane of the tissue [3–6]. As far as we are aware, ALAn is the first to characterize and quantify the apical-basal topology of cultured layers. To do so, the tool makes use of two pieces of spatial information: 1) a projection of actin signal intensity and 2) the positions of cell nuclei in the apical-basal dimension. Using this information, ALAn outputs layer density and layer height and assigns each layer to one of four organized categories representing a developmental series (Immature, Intermediate A, Intermediate B, and Mature) or a fifth category of exclusion (Disorganized) [1,2]. ALAn also utilizes existing Python libraries to output in-plane quantifications of cell shape.
Confluent epithelial tissues in culture transition between distinct developmental architectures as they proliferate and therefore densify [1,2]. ALAn makes architectural classifications based on plots of the average spatial distributions of nuclei and actin across the apical-basal depth of a 3D-imaged region. At sparse densities, cultured epithelial cell layers have a squamous morphology and are characterized by a lack of defined lateral surfaces; these are classified as Immature. The spatial plots of Immature layers have the peak of nuclear distribution located at, or occasionally above, the peak actin intensity (Figure 1A). At intermediate densities, layers develop lateral cell–cell borders and rounded cell apices; these are classified as Intermediate. The Intermediate category is split into two. The first of these, called Intermediate A (IntA), are layers where cells exhibit an asymmetric actin intensity profile with a single peak closer to the apical surface than the nuclear profile (Figure 1B). If the plot of actin exhibits a shoulder (corresponding to distinct lateral and apical pools of actin), then layers are classified as Intermediate B (IntB) or Mature (Figure 1C–1D) [2]. ALAn uses the derivative of the actin intensity plot to detect this shoulder. If the derivative is two-peaked, the ratio of the right peak to the left peak is used. A ratio of less than 1 defines IntB layers, and a ratio of greater than 1 is classified as a Mature layer. The Disorganized architectural category of epithelial cell culture is characterized by a failure to achieve a regular monolayered architecture in the apical-basal axis and therefore is characterized by broad nuclear and actin profiles (Figure 1E). Disorganization occurs when the underlying cell culture substrate area is insufficient to accommodate the number of cells seeded onto the plate [1].
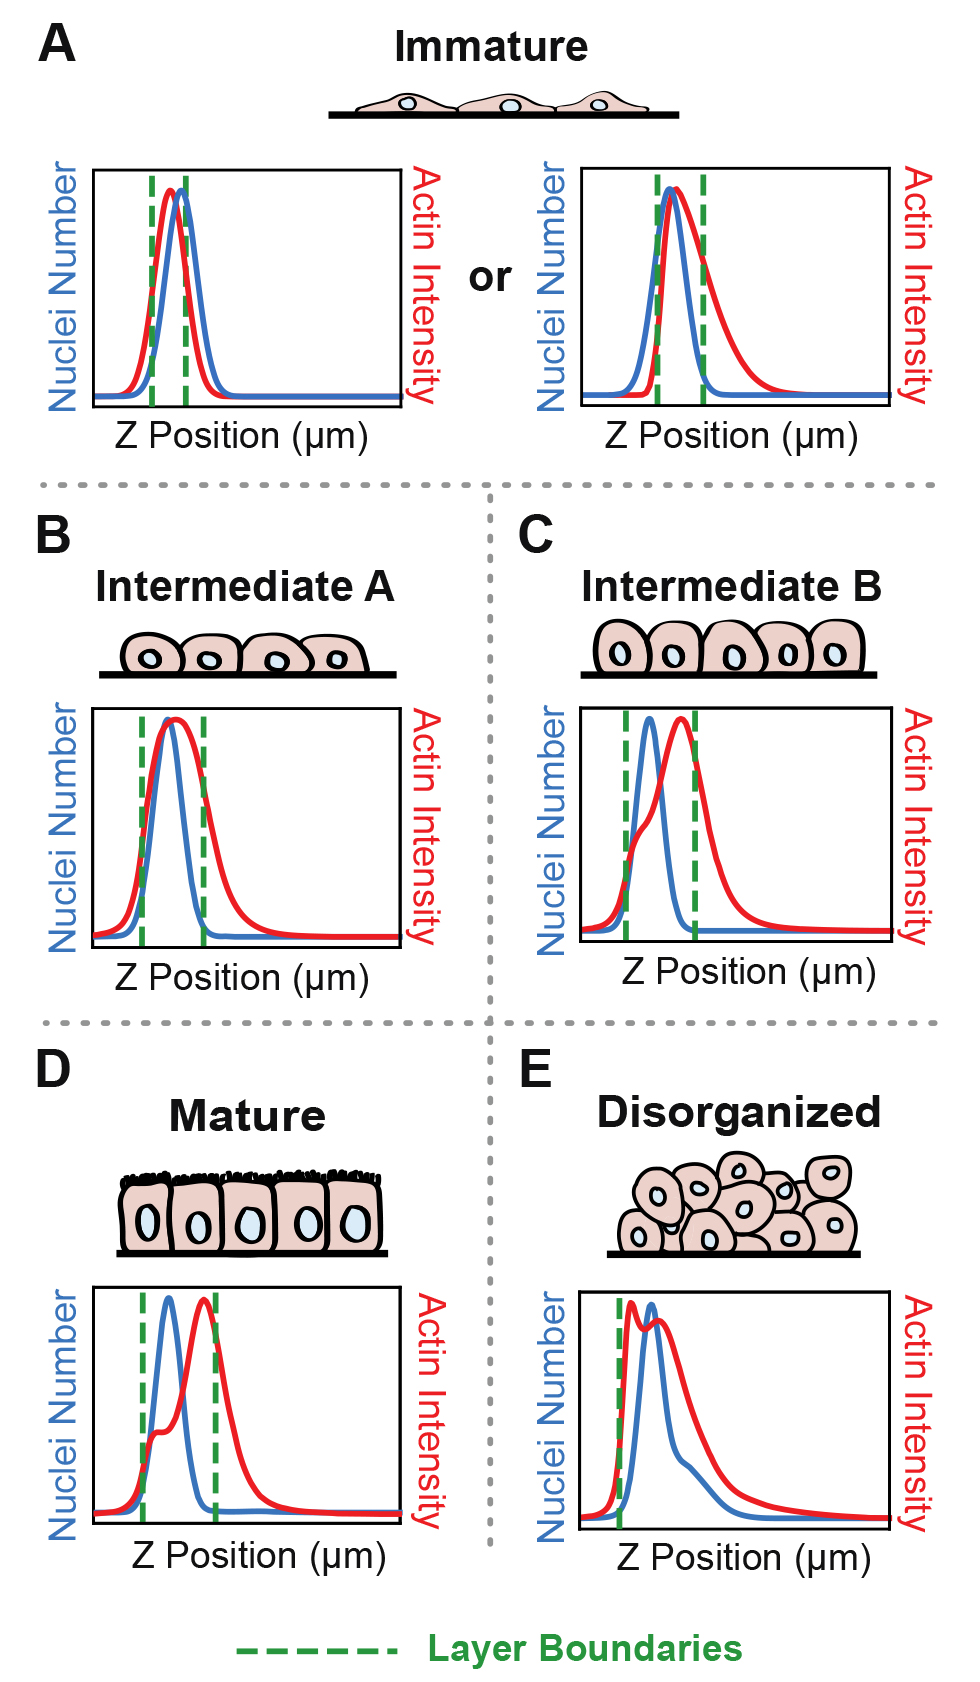
Figure 1. Epithelial architecture categories and the distinctive spatial distribution profiles of nuclei and actin positions in the apical-basal (z) axis that Automated Layer Analysis (ALAn) uses to categorize them
Materials and reagents
Reagents
Dulbecco’s phosphate buffered saline (dPBS) (Sigma-Aldrich, catalog number: SKU D1408
Phosphate buffered saline (PBS) (such as tablets from Thermo Fisher, Invitrogen, catalog number: 003002)
Paraformaldehyde, 37% (Fisher Scientific, catalog number: F79-500)
Tween 20 detergent (Sigma, catalog number: SKU 11332465001)
Vectashield antifade mounting medium with DAPI (Vector Laboratories, catalog number: SKU H-1200)
Fluorescein phalloidin (Thermo Fisher, Invitrogen, catalog number: F432)
Collagen IV coated 8-well µ-slide, #1.5 polymer coverslip, sterilized (Ibidi, catalog number: 80822)
Equipment
Spinning disc confocal unit coupled to a Nikon Ti-E inverted microscope and Zyla 4.2 sCMOS camera; 405 nm and 488 nm laser lines; 40× NA 1.15 water immersion lens (Andor, Oxford Instruments model: Dragonfly 200)
Computer workstation with a minimum 8 GB RAM, AMD, or NVIDIA 2 GB Graphics card and monitor with 1,280 × 1,024 pixels.
Software and datasets
Fusion (Version 2.3, Andor). Optional; used for image acquisition
Imaris (Versions 9.7, 9.8, 9.9, or 10.0, Oxford Instruments). Optional, used for nuclei segmentation
FIJI, ImageJ2 distribution (Version 2.14.0) [7,8]
Microsoft Excel (Version independent)
Anaconda distribution (Version 3, 2023.07-2)
Code can be obtained from GitHub: https://github.com/Bergstralh-Lab/ALAn (Access date, 03/13/2024)
Collation_Imaris2ALAn.ipynb
ALAn_v3.ipynb
Procedure
文章信息
版权信息
© 2024 The Author(s); This is an open access article under the CC BY-NC license (https://creativecommons.org/licenses/by-nc/4.0/).
如何引用
Readers should cite both the Bio-protocol article and the original research article where this protocol was used:
- Cammarota, C., Bergstralh, D. T. and Finegan, T. M. (2024). Automated Layer Analysis (ALAn): An Image Analysis Tool for the Unbiased Characterization of Mammalian Epithelial Architecture in Culture . Bio-protocol 14(8): e4971. DOI: 10.21769/BioProtoc.4971.
- Dawney, N. S., Cammarota, C., Jia, Q., Shipley, A., Glichowski, J. A., Vasandani, M., Finegan, T. M. and Bergstralh, D. T. (2023). A novel tool for the unbiased characterization of epithelial monolayer development in culture. Mol. Biol. Cell 34(4): ee22–04–0121. https://doi.org/10.1091/mbc.e22-04-0121
分类
细胞生物学 > 组织分析 > 组织成像
细胞生物学 > 细胞成像 > 固定细胞成像
您对这篇实验方法有问题吗?
在此处发布您的问题,我们将邀请本文作者来回答。同时,我们会将您的问题发布到Bio-protocol Exchange,以便寻求社区成员的帮助。