

Protein Level Quantification Across Fluorescence-based Platforms
跨荧光平台的蛋白质水平定量
发布: 2023年10月05日第13卷第19期 DOI: 10.21769/BioProtoc.4834 浏览次数: 2208
评审: Anonymous reviewer(s)
参见作者原研究论文
The authors used this protocol in:
Feb 2022
Advertisement


Abstract
Biological processes are dependent on protein concentration and there is an inherent variability among cells even in environment-controlled conditions. Determining the amount of protein of interest in a cell is relevant to quantitatively relate it with the cells (patho)physiology. Previous studies used either western blot to determine the average amount of protein per cell in a population or fluorescence intensity to provide a relative amount of protein. This method combines both techniques. First, the protein of interest is purified, and its concentration determined. Next, cells containing the protein of interest with a fluorescent tag are sorted into different levels of intensity using fluorescence-activated cell sorting, and the amount of protein for each intensity category is calculated using the purified protein as calibration. Lastly, a calibration curve allows the direct relation of the amount of protein to the intensity levels determined with any instrument able to measure intensity levels. Once a fluorescence-based instrument is calibrated, it is possible to determine protein concentrations based on intensity.
Key features
• This method allows the evaluation and comparison of protein concentration in cells based on fluorescence intensity.
• Requires protein purification and fluorescence-activated cell sorting.
• Once calibrated for one protein, it allows determination of the levels of this protein using any fluorescence-based instrument.
• Allows to determine subcellular local protein concentration based on combining volumetric and intensity measurements.
Graphical overview
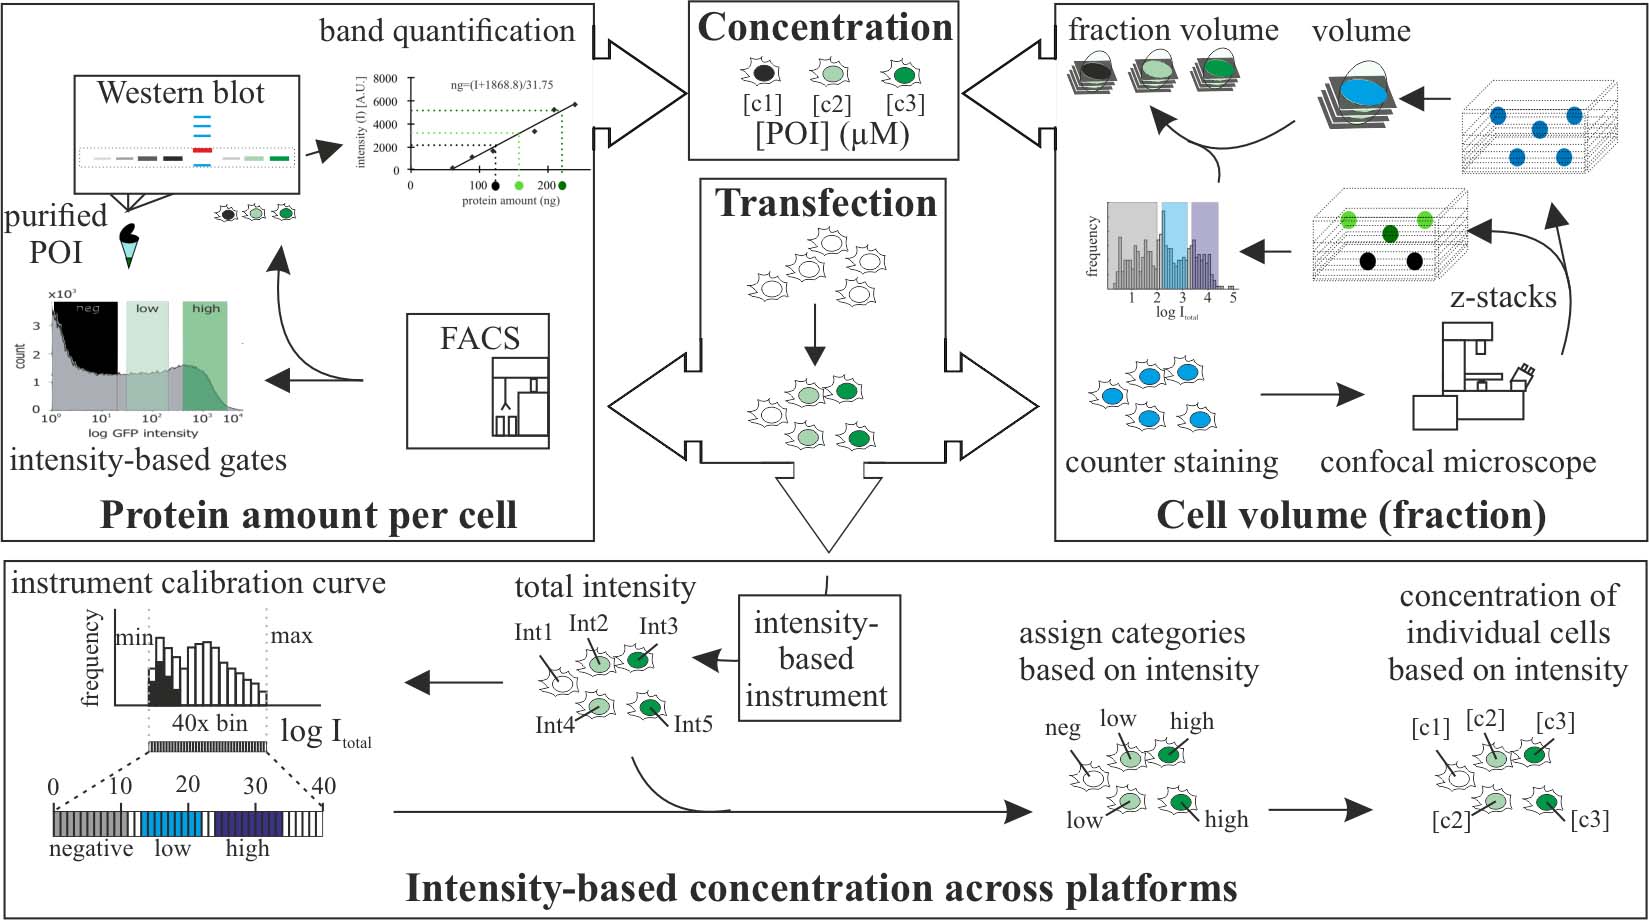
Protein level quantification across fluorescence-based platforms
Background
The use of fluorescently tagged proteins is a common tool in cell biology to study a variety of molecular processes. Although fluorescence is directly related to concentration of the fluorophore, the values of intensities do not translate directly into concentration of molecules. This is important to reproduce (patho)physiological concentrations of molecules including proteins. Western blots can be used to determine the average amount of proteins within a cell population. We performed fluorescence-activated cell sorting (FACS) prior to analysis by western blot to quantify protein levels within a cell population with defined fluorescence intensities and cell amounts. In addition, we developed a method that allows the direct relation of fluorescence intensities to get molecular concentration categories at the single-cell level. Furthermore, we expanded the method to allow concentration comparison between samples detected in different systems. Lastly, we extended the method to calculate average subcellular concentration variations. Other existing methods to determine protein concentrations are based on single-molecule imaging to calculate the number of molecules in beads (Chiu et al., 2001; Sugiyama et al., 2005) or, alternatively, use lipid or polymer layers in which the density of the fluorophore is known (Dustin, 1997; Zwier et al., 2004; Galush et al., 2008). These methods, although maybe more accurate in the estimation of concentration than ours, require calibration for each experiment and/or sophisticated equipment, whereas our method relies on equipment available in most molecular cell biology laboratories.
In the publication in which we utilized the method (Zhang et al., 2022), we used it to quantify ectopic protein concentrations in single cells and subcellular compartments. This allowed us to reproduce the same concentrations in cells and in in vitro experiments and to relate it to physiological tissue concentrations. Variations of the method can be used to quantify endogenous levels of tagged proteins (i.e., in cells with genomically engineered loci) or proteins labeled with antibodies.
Materials and reagents
Biological samples
Bovine serum albumin (BSA) (Sigma-Aldrich, catalog number: A8412); see General note 1
C2C12, mouse (Mus musculus) myoblasts (Yaffe and Saxel, 1977); see General note 1
Plasmid pc1208 (pEG-MeCP2) (Kudo et al., 2003); see General note 1
Rat IgG anti-MeCP2 4H7 antibody. Self-made, not commercial (Jost et al., 2011); see General note 1
Donkey anti-rat IgG-Cy3 antibody (Jackson ImmunoResearch, catalog number: 111560); see General notes 1 and 2
Reagents
1,4-Diazabicyclo-[2.2.2]octane (DABCO) (Sigma-Aldrich, catalog number: D2522)
2-propanol (AppliChem GmbH, catalog number: 131090.1212)
4′,6′-diamidine-2-phenylindole dihydrochloride (DAPI) (Carl Roth, catalog number: 6335.1)
Aluminum sulfate 14–18 hydrate (Carl Roth, catalog number: 3731.1)
Ammonium persulfate (Carl Roth, catalog number: 9592.3)
Bromophenol blue (Bio-Rad Laboratories, catalog number: 161-0404)
Coomassie, Brilliant Blue R (Sigma-Aldrich, catalog number: 1.12553)
Dimethylsulfoxide (DMSO) (Sigma-Aldrich, catalog number: D4540)
Di-sodium hydrogen phosphate 7-hydrate (Na2HPO4·7H2O) (Carl Roth, catalog number: X987.2)
Dithiothreitol (DTT) (Sigma-Aldrich, catalog number: D9779)
Ethanol absolute pure, pharma grade (AppliChem GmbH, catalog number: A4230)
Ethylenedinitrilotetraacetic acid (EDTA) (AppliChem GmbH, catalog number: 131026.1211)
Glucose (Sigma-Aldrich, catalog number: G5400)
Glycerol (Sigma-Aldrich, catalog number: G9422)
Hybond ECL membrane (nitrocellulose membrane) (VWR, catalog number: RPN3032D)
Low fat milk pulver (Sucofin)
Methanol for analysis EMPARTA® ACS (Sigma Aldrich, catalog number: 1070182511)
Mowiol® 4-88 (Sigma-Aldrich, catalog number: 81381)
NonidetTM P-40 substitute (NP-40) (Roche, catalog number: 11332473001)
Pepstatin A (Sigma-Aldrich, catalog number: P5318)
Phenylmethylsulfonyl fluoride (PMSF) (Carl Roth, catalog number: 6367.1)
Potassium chloride (KCl) (Sigma-Aldrich, catalog number: P9541)
Potassium dihydrogen phosphate (KH2PO4) (Carl Roth, catalog number: 3904.1)
Tris (Sigma-Aldrich, catalog number: 93362)
Sodium chloride (NaCl) (Carl Roth, catalog number: 3957.1)
Sodium dodecyl sulfate (SDS) (Sigma-Aldrich, catalog number: 11667289001)
Trans-epoxysuccinyl-L-leucylamido(4-guanidino)butane (E64) (Sigma-Aldrich, catalog number: E3132)
Tween 20 (Carl Roth, catalog number: 131026.1211)
Whatman 3MM CHR (Whatman paper) (Cytiva, catalog number: 3030-672)
Solutions
Acrylamide/bis-acrylamide 30% (Polyacrylamide) (Sigma-Aldrich, catalog number: A3699)
Dulbecco’s modified Eagle’s medium, high glucose (Sigma-Aldrich, catalog number: D7777)
Fetal bovine serum advanced (Capricorn Scientific, catalog number: FBS-11A)
Formaldehyde solution, 36.5%–38% in H2O (Sigma-Aldrich, catalog number: F8775)
Orthophosphoric acid (Carl Roth, catalog number: 6366.1)
PierceTM 660 nm Protein Assay Reagent (Thermo Fisher, catalog number: 22660)
PierceTM 10× Western Blot Transfer buffer, methanol-free (transfer buffer) (Thermo Fisher, catalog number: 35040)
Tetramethylethylenediamine (TEMED) (Sigma-Aldrich, catalog number: T9281)
Trypsin (Sigma-Aldrich, catalog number: T4049)
Ammonium persulfate 10% (see Recipes)
Coomassie destaining solution (see Recipes)
Coomassie staining solution (see Recipes)
DAPI solution (see Recipes)
E64 solution (see Recipes)
Loading buffer (see Recipes)
Low-fat milk 3% in PBS (see Recipes)
Low-fat milk 5% in PBS (see Recipes)
Lysis buffer (see Recipes)
Mounting media (see Recipes)
Pepstatin A solution (see Recipes)
Phosphate buffered saline (PBS) (see Recipes)
PBS-EDTA 0.02% (w/v) (see Recipes)
PMSF solution (see Recipes)
Polyacrylamide gel 5% (stacking) for 10 mL gel (see Recipes)
Polyacrylamide gel 8% (separating) for 10 mL gel (see Recipes)
Running buffer 10× (see Recipes)
Sodium dodecyl sulfate (SDS) 10% (see Recipes)
Tris 1 M pH 6.8 (see Recipes)
Tris 1 M pH 8.5 (see Recipes)
Tris 1.5 M pH 8.8 (see Recipes)
Recipes
Ammonium persulfate 10%
Reagent Final concentration Quantity Ammonium persulfate 10% (w/v) 1 g H2O n/a to 10 mL Total n/a 10 mL Coomassie destaining solution
Reagent Final concentration Quantity Ethanol 10% (v/v) 40 mL Orthophosphoric acid 2% (v/v) 2 mL H2O n/a 58 mL Total n/a 100 mL Coomassie staining solution
Reagent Final concentration Quantity Coomassie 0.2% (w/v) 0.2 g Orthophosphoric acid 2% (v/v) 2 mL Ethanol 10% (v/v) 10 mL H2O n/a to 100 mL Total n/a 100 mL DAPI solution
Reagent Final concentration Quantity DAPI 1 mg/mL 10 mg H2O n/a to 10 mL Total n/a 10 mL E64 solution
Reagent Final concentration Quantity E64 1 mM 360 μg Ethanol 50% (v/v) 500 μL H2O n/a 500 μL Total n/a 1 mL Loading buffer
Reagent Final concentration Quantity Tris 50 mM 0.3 g SDS 2% (v/v) 2 mL Glycerol 10% (v/v) 10 mL Bromophenol blue 0.01% (v/v) 100 μL DTT 100 mM 1.5 g H2O n/a to 100 mL Total n/a 100 mL Low-fat milk 3% in PBS
Reagent Final concentration Quantity Low-fat milk pulver 3% (w/v) 0.3 g PBS n/a to 10 mL Total n/a 10 mL Low-fat milk 5% in PBS
Reagent Final concentration Quantity Low-fat milk pulver 3% (w/v) 0.5 g PBS n/a to 10 mL Total n/a 10 mL Lysis buffer
Reagent Final concentration Quantity Tris 25 mM 0.03 g NaCl 1 M 0.6 g Glucose 50 mM 0.09 g EDTA 10 mM 0.03 g Tween 20 0.2% (v/v) 20 μL NonidetTM P-40 substitute 0.2% (v/v) 20 μL PMSF solution 1 mM 1 μL E64 solution 10 μM 1 μL Pepstatin A solution 29 μM 1 μL H2O n/a 10 mL Total n/a 10 mL Mounting media
Reagent Final concentration Quantity Mowiol 4-88 13% (w/v) 8 g Tris-HCl 1 M pH 8.5 133 mM 8 mL H2O n/a 32 mL Glycerol 33% (v/v) 20 mL DABCO 2% (w/v) 1.2 g Total n/a 60 mL Add mowiol to Tris and H2O and heat to 50–60 °C while stirring.
Cool down to room temperature.
Add glycerol and stir again.
Add DABCO and dissolve it by stirring.
Spin the solution at 5,000× g for 15 min.
Aliquot the supernatant and store at -20 °C.
Pepstatin A solution
Reagent Final concentration Quantity Pepstatin A 2.9 mM 2 mg DMSO n/a 1 mL Total n/a 1 mL Phosphate buffered saline (PBS)
Reagent Final concentration Quantity NaCl 1.37 M 80 g KCl 27 mM 2 g Na2HPO4·7H2O 10 mM 21.7 g KH2PO4 10 mM 2.4 g H2O n/a to 1 L Total n/a 1 L PBS-EDTA 0.02% (w/v)
Reagent Final concentration Quantity EDTA 0.02 % (w/v) 2 mg PBS n/a to 100 mL Total n/a 100 mL PMSF solution
Reagent Final concentration Quantity PMSF 100 mM 17.42 mg 2-propanol n/a 1 mL Total n/a 1 mL Polyacrylamide gel 5% (stacking) for 10 mL gel
Reagent Final concentration Quantity Polyacrylamide 5% (v/v) 0.33 mL Tris 1 M pH 6.8 125 mM 0.25 mL SDS 10% 0.1% (v/v) 0.02 mL Ammonium persulfate 10% 0.1% (v/v) 0.02 mL TEMED 0.001% (v/v) 0.002 mL H2O n/a 1.4 mL Total n/a 2 mL Polyacrylamide gel 8% (separating) for 10 mL gel (see General note 1)
Reagent Final concentration Quantity Polyacrylamide 8% (v/v) 2.7 mL Tris 1.5 M pH 6.8 375 mM 2.5 mL SDS 10% 0.1% (v/v) 0.1 mL Ammonium persulfate 10% 0.1% (v/v) 0.1 mL TEMED 0.0006% (v/v) 0.006 mL H2O n/a 4.6 mL Total n/a 10 mL Running buffer 10×
Reagent Final concentration Quantity Tris base 25 mM 30 g Glycin 1.92 M 144 g SDS 1% (v/v) 100 mL H2O n/a to 1 L Total n/a 1 L SDS 10%
Reagent Final concentration Quantity SDS 10% (v/v) 10 mL H2O n/a 90 mL Total n/a 100 mL Tris 1 M pH 6.8
Reagent Final concentration Quantity Tris 1 M 12.1 g H2O n/a to 100 mL Total n/a 100 mL Tris 1 M pH 8.5
Reagent Final concentration Quantity Tris 1 M 12.1 g H2O n/a to 100 mL Total n/a 100 mL Tris 1.5 M pH 8.8
Reagent Final concentration Quantity Tris 1.5 M 18.15 g H2O n/a to 100 mL Total n/a 100 mL
Equipment
AMAXA nucleofector (Lonza) or equivalent. Required for transfection of cells. See General note 1
Confocal microscope Leica TCS SPE-II (Leica) or equivalent. Required for imaging z-stacks to calculate volumes. See General note 1
Imager AI600 (Amersham) or equivalent. Required for imaging of SDS-PAGE gels (Epi-white light of 470–635 nm, any appropriate filter to see Coomassie stained proteins) and western blots (fluorescence epi light: 460, 520, or 630 nm with corresponding emission filters Cy2-525BP20, Cy3-605BP40, or Cy5-705BP40, see General note 2)
Mini-PROTEAN Tetra Vertical Electrophoresis Cell (Bio-Rad Laboratories) or equivalent
PowerPac Basic Power Supply (Bio-Rad Laboratories) or equivalent
S3e Cell Sorter (Bio-Rad Laboratories) or equivalent. It requires an illumination source and filters fitting to the fluorescent tag fused to the protein of interest: for EGFP, a 488 nm laser with emission filter 525/30 nm can be used
Single-molecule setup on a Nikon Eclipse Ti (Nikon). Used as example of fluorescence platforms. In the example given, EGFP images were taken using an OBIS 488 nm (100 mW) laser and a Quadbandpass (432/25 515/25 595/25 730/70 nm) filter from Nikon. See General note 1
Trans-Blot® SD Semi-Dry Transfer Cell (Bio-Rad Laboratories) or equivalent
Wide field microscope Axiovert 200 (Zeiss). Used as example of fluorescence platforms. In the example given, EGFP images were taken using a HBO100 bulb and a hard coated EGFP filter (ex: 482/18; bs: 495LP; em: 520/28). See General note 1
12 mm round coverslips (thickness 0.13–0.16 mm) (Diagonal, catalog number 41001112) or equivalent according to your microscope sample
#1.5H 24 mm round coverslips (thickness 175 ± 5 μm) (Thor laboratories, catalog number: CG15XH1). Used for live-cell microscopy in single-molecule setup. See General note 1
Widefield microscope Nikon Eclipse TiE2 (Nikon). Used for validation of the gate sorting across platforms. Spectra X LED 395 ± 25 nm (295 mW) and 370 ± 24 nm were used as illumination for DAPI and GFP respectively and a Quadbandpasss (432 ± 25, 515 ± 25, 595 ± 25, 730 ± 70 nm) as emission filter. Images were acquired using a 20× SPlan Fluor LWD DIC objective with numerical aperture of 0.7
Software and datasets
S3 ProSortTM Software (Bio-Rad Laboratories) or equivalent. Used to analyze and sort the cells in the cell sorter
ImageJ (FIJI) (Schindelin et al., 2012). In the examples given, FIJI version 1.52q was used and the plugin BioFormats was required to open the images generated in the widefield and confocal microscopes
Volocity 6.3 (Perkin-Elmer). See General note 1. ImageJ plugin 3D suite can be used instead to calculate volumes and intensity in z-stacks
Procedure
文章信息
版权信息
© 2023 The Author(s); This is an open access article under the CC BY-NC license (https://creativecommons.org/licenses/by-nc/4.0/).
如何引用
Romero, H., Schmidt, A. and Cardoso, M. C. (2023). Protein Level Quantification Across Fluorescence-based Platforms. Bio-protocol 13(19): e4834. DOI: 10.21769/BioProtoc.4834.
分类
生物化学 > 蛋白质 > 定量
细胞生物学 > 细胞成像 > 荧光
分子生物学 > 蛋白质 > 检测
您对这篇实验方法有问题吗?
在此处发布您的问题,我们将邀请本文作者来回答。同时,我们会将您的问题发布到Bio-protocol Exchange,以便寻求社区成员的帮助。