

Relative Membrane Potential Measurements Using DISBAC2(3) Fluorescence in Arabidopsis thaliana Primary Roots
使用DISBAC2(3)荧光测量拟南芥主根中的相对膜电位
发布: 2023年07月20日第13卷第14期 DOI: 10.21769/BioProtoc.4778 浏览次数: 1933
评审: Samik BhattacharyaIgnacio Lescano
参见作者原研究论文
The authors used this protocol in:

Sep 2021
Advertisement


Abstract
In vivo microscopy of plants with high-frequency imaging allows observation and characterization of the dynamic responses of plants to stimuli. It provides access to responses that could not be observed by imaging at a given time point. Such methods are particularly suitable for the observation of fast cellular events such as membrane potential changes. Classical measurement of membrane potential by probe impaling gives quantitative and precise measurements. However, it is invasive, requires specialized equipment, and only allows measurement of one cell at a time. To circumvent some of these limitations, we developed a method to relatively quantify membrane potential variations in Arabidopsis thaliana roots using the fluorescence of the voltage reporter DISBAC2(3). In this protocol, we describe how to prepare experiments for agar media and microfluidics, and we detail the image analysis. We take an example of the rapid plasma membrane depolarization induced by the phytohormone auxin to illustrate the method. Relative membrane potential measurements using DISBAC2(3) fluorescence increase the spatio-temporal resolution of the measurements and are non-invasive and suitable for live imaging of growing roots. Studying membrane potential with a more flexible method allows to efficiently combine mature electrophysiology literature and new molecular knowledge to achieve a better understanding of plant behaviors.
Key features
• Non-invasive method to relatively quantify membrane potential in plant roots.
• Method suitable for imaging seedlings root in agar or liquid medium.
• Straightforward quantification.
Keywords: Auxin (生长素)Background
Establishment of a membrane potential is essential to support cell function in all living organisms. In plants, membrane potential reflects the electrical difference between the cytoplasm and the apoplast (in root epidermis between -120 and -160 mV, Sze et al., 1999; reviewed in Serre et al., 2021). This phenomenon is mostly driven by the H+-ATPases proton pumps, which extrude positively charged protons from the cytoplasm to the apoplast (Sze, 1985), resulting in negative membrane potentials (Sze et al., 1999). These negative membrane potentials are essential for ion transport across the plasma membranes, and thus play an important role in plant nutrition, growth, and development (Tyerman and Schachtman, 1992; Ragel et al., 2019). Reflecting the spectacular ability of plants to adapt to changing local environments, membrane potential can be quickly shifted from the resting potential value to a hyperpolarized (more negative) or a depolarized (more positive) state. Responses vary according to the stimuli and can potentially lead to stress-induced electrical signaling (Mudrilov et al., 2021). For example, salt stress (NaCl) causes a quick and massive entry of positively charged sodium ions into the root tissues, triggering a leak of potassium ions outside the cells to counterbalance the membrane depolarization (for review, see Cuin et al., 2008). Equally, the hormone auxin triggers almost instantaneous membrane depolarization in roots, leading to root growth inhibition by mechanism(s) still not fully understood (Tretyn et al., 1991; Dindas et al., 2018 and 2020, Paponov et al., 2019; Li et al., 2021; Serre et al., 2021; Qi et al., 2022; Roosjen et al., 2022).
Membrane potential is traditionally measured by impaling electrodes into living tissues (Shabala et al.,2005). While this method gives extremely accurate and quantitative measurements, it is invasive, requires dedicated equipment, and is not fully adapted to the study of growing tissues for a long period of time. Furthermore, the reported potential only concerns one cell and thus limits high resolution spatio-temporal studies.
To circumvent these challenges, we reviewed the literature and available voltage reporter dyes. We selected DISBAC2(3) for its uniform staining of roots and lack of obvious toxicity (Serre et al., 2021). This staining method allowed us to relatively observe membrane potential over time in different tissues. However, the method does not give actual potential values (in mV), lacks sensitivity in strongly hyperpolarized states, and so should always be used in comparison to roots observed under control conditions.
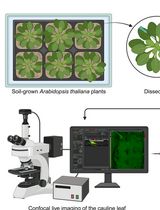
Here, we explain how to analyze relative changes in membrane potential using confocal fluorescence microscopy, taking as an example the imaging of rapid auxin-induced cellular depolarization in Arabidopsis thaliana primary root. We describe how to prepare experiments for imaging of the membrane potential in microfluidics to observe the first instants of the response, as well as imaging in agar media for observation of established responses. Microfluidics is adapted to this type of observation, as each plant can be observed first in control and then in treatment condition, granting internal control fluorescence intensities for every seedling.
The protocols detailed here can be adapted for other dyes to study dynamic events in A. thaliana roots in response to various (a)biotic stimuli.
Materials and reagents
General
Arabidopsis thaliana wildtype Columbia-0 (Col-0) sterile seeds
Porous tape 1.25 cm large (Duchefa, Leucopore, L3302)
Autoclaved wooden toothpicks (any supermarket)
Square Petri dishes (e.g., 15 mm × 15 mm or 10 mm × 10 mm, any brand)
1.5 mL tubes (any brand)
15 mL tubes (any brand)
0.5 mL tubes (any brand)
96% ethanol (Sigma, catalog number: 1.59010), store at room temperature in a flame-protective cabinet
Auxin 3-indoleacetic acid (IAA) (Sigma-Aldrich, catalog number: I2886-5G), store at -20 °C
Murashige and Skoog (MS) medium (Duchefa, catalog number: M0221.0050), store at room temperature
Plant agar (Duchefa, catalog number: P1001), store at room temperature
Sucrose (Duchefa, catalog number: S0809), store at room temperature
MES (Duchefa, catalog number: M1503.0100), store at room temperature
1 M KOH (Sigma-Aldrich, catalog number: 06103), store at room temperature
DISBAC2(3) (Invitrogen, Thermo Fisher, catalog number: B413), store at -20 °C in dark
DMSO (Sigma-Aldrich, catalog number: 94563), store at room temperature
Fluorescein Dextran 10 K MW (Thermo Fisher, Invitrogen, catalog number: D1821)
DISBAC2(3) master stock (see Recipes)
DISBAC2(3) working aliquots (see Recipes)
70% ethanol (approximately) prepared from 96% ethanol (see Recipes)
500 mL of buffered liquid 1/2 MS (see Recipes)
500 mL of buffered solid 1/2 MS (see Recipes)
IAA 10 mM stock (see Recipes)
IAA 100 μM solution (see Recipes)
Fluorescent tracer (to follow treatment arrival in microfluidics) (see Recipes)
Specific to agar media experiments
Round 9 cm diameter Petri dishes (e.g., SterilinTM, Thermo Fisher, catalog number: 101R20)
NuncTM Lab-TekTM II microscopy chambers (VWR, catalog number: 734-2055) or 3D printed (see https://cellgrowth-lab.weebly.com/3d-prints.html)
Specific to microfluidic experiments
Microfluidic chips suited for A. thaliana root imaging (e.g., Grossmann et al., 2011; Fendrych et al., 2018; Serre et al., 2021; for review, see Yanagisawa et al., 2021)
Filtering system (Nalgene, P-Lab, N325045)
0.45 μm pore size 47 mm diameter round filtering membrane (Macherey-Nagel, P-Lab, M680447)
Equipment
Precision scale (any brand)
Vortex bench mixer (any brand)
Sterile laminar flow hood (any brand)
Lab scale (any brand)
Thin tweezers (Dumont No.5, Youlab, F003)
Autoclave (any brand)
pH meter (any brand)
Stirring magnetic rod and magnetic mixer (e.g., 2MAG, Dutscher, catalog number: 699010)
Autoclavable 0.5 L borosilicate glass bottles (e.g., SLS, Dutscher, catalog number: 257065)
500 mL graduated cylinder (any brand, plastic or glass)
1,000 mL beaker (any brand, plastic or glass)
Thin spatula (e.g., Heathrow, Dutscher, catalog number: 037874)
Growth room set in long days [e.g., 23 °C by day (16 h), 18 °C by night (8 h), 60% humidity, and light intensity of 120 μmol photons m-2·s-1]
Confocal microscope setup (see below)
Observation of the membrane potential with DISBAC2(3) staining requires a confocal laser or spinning disk microscope (with a 515 nm source of excitation). Here, we present an example based on our microscopy setup. Spinning disk confocal microscopy is particularly adapted to the imaging of fast responses in high spatio-temporal resolution, as the images are acquired under short exposure times. Moreover, the use of vertical inverted stage microscopy allows to keep the seedlings in their natural orientation (towards gravity) and thus avoid bias based on putting the seedlings on the horizontal plane (von Wangenheim et al., 2017).
Microscope body: Axio Observer 7 inverted (Zeiss); the microscope was set up on its back to obtain a vertical stage (details in von Wangenheim et al., 2017; Zeiss also provides custom mounting on request).
Spinning disk: CSU-W1-T2 spinning disk unit with 50 μm pinholes (Yokogawa)
Excitation source: VS-HOM1000 excitation light homogenizer (Visitron Systems)
Objective: Plan-Apochromat × 20/0.8 (Zeiss)
Detection: PRIME-95B Back-Illuminated sCMOS camera 1,200 × 1,200 pixels (Photometrics)
For microfluidic only: microfluidic pressure driven flow setup
We also describe a protocol to prepare media to observe membrane potential using microfluidics. There are a multitude of microfluidic (or perfusion) setups possible based on manufacturer, budget, and need. The same for the production of microfluidic chips. A detailed protocol describing the establishment of a microfluidic setup and the microfluidic chip production is thus out of scope of this protocol. For an example of microfluidic setup using manually closable and reusable chips, see https://www.elveflow.com/microfluidic-applications/microfluidic-cell-culture/microfluidic-microscopy-imaging/. Note that any microfluidic chip adapted to A. thaliana would work, either conventional glass coverslip–sealed microfluidic chips (e.g., Grossmann et al., 2011; Fendrych et al., 2018; for review, see Yanagisawa et al., 2021) or manually closed microfluidics chips (Serre et al., 2021).
Software
Microscopy imaging software (here, we used Visiview, Visitron, https://www.visitron.de)
ImageJ (v1.53t) Fiji (v2.9.0) (Schindelin et al., 2012)
LibreOffice Calc (https://www.libreoffice.org/) or Microsoft Office Excel (https://www.microsoft.com/fr-fr/microsoft-365/microsoft-office)
R (R Core Team, 2022, https://www.R-project.org/) with the nparcomp (Konietschke et al., 2015) package installed
R studio IDE (optional, https://posit.co/)
Python in the Anaconda distribution platform [tested with Python v3.8, https://www.anaconda.com/products/distribution)] with Spyder IDE (tested with v5.2.2, command: conda install spyder) and installed Seaborn package (tested with v0.11.2, command: conda install seaborn)
Optional: Inkscape
Procedure
文章信息
版权信息
© 2023 The Author(s); This is an open access article under the CC BY-NC license (https://creativecommons.org/licenses/by-nc/4.0/).
如何引用
Dubey, S. M., Fendrych, M. and Serre, N. B. C. (2023). Relative Membrane Potential Measurements Using DISBAC2(3) Fluorescence in Arabidopsis thaliana Primary Roots. Bio-protocol 13(14): e4778. DOI: 10.21769/BioProtoc.4778.
分类
植物科学 > 植物细胞生物学 > 细胞成像
植物科学 > 植物发育生物学 > 综合
细胞生物学 > 细胞成像 > 活细胞成像
您对这篇实验方法有问题吗?
在此处发布您的问题,我们将邀请本文作者来回答。同时,我们会将您的问题发布到Bio-protocol Exchange,以便寻求社区成员的帮助。