- EN - English
- CN - 中文
Quantifying Single and Dual Channel Live Imaging Data: Kymograph Analysis of Organelle Motility in Neurons
量化单通道和双通道实时成像数据: 神经元中细胞器运动的Kymograph分析
发布: 2023年05月20日第13卷第10期 DOI: 10.21769/BioProtoc.4675 浏览次数: 2537
评审: Xi FengJose Martinez HernandezAnonymous reviewer(s)
Abstract
Live imaging is commonly used to study dynamic processes in cells. Many labs carrying out live imaging in neurons use kymographs as a tool. Kymographs display time-dependent microscope data (time-lapsed images) in two-dimensional representations showing position vs. time. Extraction of quantitative data from kymographs, often done manually, is time-consuming and not standardized across labs. We describe here our recent methodology for quantitatively analyzing single color kymographs. We discuss the challenges and solutions of reliably extracting quantifiable data from single-channel kymographs. When acquiring in two fluorescent channels, the challenge becomes analyzing two objects that may co-traffic together. One must carefully examine the kymographs from both channels and decide which tracks are the same or try to identify the coincident tracks from an overlay of the two channels. This process is laborious and time consuming. The difficulty in finding an available tool for such analysis has led us to create a program to do so, called KymoMerge. KymoMerge semi-automates the process of identifying co-located tracks in multi-channel kymographs and produces a co-localized output kymograph that can be analyzed further. We describe our analysis, caveats, and challenges of two-color imaging using KymoMerge.
Keywords: Kymograph (Kymograph)Background
Time-lapse imaging using fluorescence microscopy is a useful tool for studying vesicle trafficking in neurons. Information about vesicle behaviors (such as speed, directionality, pause times, etc.) needs to be quantified in order to understand and compare how different vesicle populations behave under different conditions. Extracting quantitative information from live imaging data is time consuming and carried out differently by different labs. Kymographs are often used to easily display vesicle behavior over time in a figure but can also be used to quantify these behaviors. A kymograph shows the directionality on the x-axis and time along the y-axis. This technique has applications across a wide variety of studies: it is used in studying microtubule growth (Zwetsloot et al., 2018), kinetochore movement (Hertzler et al., 2020), lamellipodial advance or collapse (Menon et al., 2014), and, probably most commonly, vesicle movement in neurons (Maday and Holzbaur, 2016; Farías et al., 2017; Farfel-Becker et al., 2019). Neuronal processes are particularly amenable to the use of kymograph analysis because of their inherent linear morphology. The highly polarized structure of axons and dendrites provides built-in tracks along one axis where movement of a variety of biological structures can be followed. With fluorescent labeling, either from adding fluorescent tracers or by transfection with plasmids encoding fluorescent proteins, various processes and structures can be analyzed, such as trafficking of organelles (Wang et al., 2009; Yap et al., 2018) or cytoskeletal elements (Liang et al., 2020; Ganguly and Roy, 2022).
Kymographs contain a great deal of information about trafficking dynamics. Parameters available for analysis include the number of anterograde, retrograde, and stationary events, event speed, pause time, and event distance. Quantifying these parameters can be done manually or by several available software programs suitable for one-channel images. If these parameters are to be measured under the condition where two proteins are trafficking together, events must be identified that coincide in both channels. A review of the literature shows that current kymograph analysis is largely limited to tracking one channel at a time (Lasiecka et al., 2010; Chien et al., 2017; Boecker et al., 2020). The common method of creating kymographs from time-lapse fluorescent microscope data is done on one channel, producing one independent kymograph per marker with no direct connection between them, even though multiple channels can easily be acquired. To analyze two objects that co-traffic together, one has to carefully examine the kymographs from both channels and decide which tracks are the same, or one could try to identify the coincident tracks from an overlay of the two channels (see Lasiecka et al., 2014 as an example). Tracks can merge and diverge, and such events are not easy to identify when looking at two separate images, so marking them can be a challenge. The whole process is laborious and time consuming. Detailed information from two kymographs would only be useful if all the data of interest were in one image. Our lab has been studying the dynamics of a variety of endosomal compartments and their inter-relationship in neurons using more than one endosomal marker (Yap et al., 2008, 2017 and 2018). The difficulty in finding an available application for such analysis has led us to create a program to do so, called KymoMerge (McMahon et al., 2021). KymoMerge addresses the issues discussed by automating the process of identifying co-located tracks in multi-channel kymographs and producing an output that can be analyzed directly.
Software
FIJI open-source image analysis software (https://imagej.net/software/fiji/downloads)
Procedure
文章信息
版权信息
© 2023 The Author(s); This is an open access article under the CC BY-NC license (https://creativecommons.org/licenses/by-nc/4.0/).
如何引用
Readers should cite both the Bio-protocol article and the original research article where this protocol was used:
- Laura, D., McMahon, L. P., Duston, A., Yap, C. C. and Winckler, B. (2023). Quantifying Single and Dual Channel Live Imaging Data: Kymograph Analysis of Organelle Motility in Neurons. Bio-protocol 13(10): e4675. DOI: 10.21769/BioProtoc.4675.
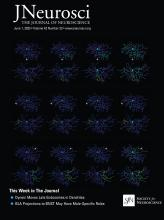
- Yap, C.C., Digilio, L., McMahon, L.P., Wang, T. Winckler, B. (2022). Dynein Is Required for Rab7-Dependent Endosome Maturation, Retrograde Dendritic Transport, and Degradation. J Neurosci 42(22): 4415-4434.
分类
神经科学 > 细胞机理
细胞生物学 > 细胞成像 > 活细胞成像
您对这篇实验方法有问题吗?
在此处发布您的问题,我们将邀请本文作者来回答。同时,我们会将您的问题发布到Bio-protocol Exchange,以便寻求社区成员的帮助。
Share
Bluesky
X
Copy link


