- EN - English
- CN - 中文
In vivo Assessment of Lysosomal Stress in the Drosophila Brain Using Confocal Fluorescence Microscopy
利用共聚焦荧光显微镜对果蝇大脑溶酶体压力的体内评估
发布: 2023年01月20日第13卷第2期 DOI: 10.21769/BioProtoc.4599 浏览次数: 1778
评审: Nafisa M. JadavjiSrajan KapoorAnonymous reviewer(s)
Abstract
Lysosomes play a central role in signaling, nutrient sensing, response to stress, and the degradation and recycling of cellular content. Defects in lysosomal digestive enzymes or structural components can impair lysosomal function with dire consequences to the cell, such as neurodegeneration. A number of methods exist to assess lysosomal stress in the model Drosophila, such as specific driver and reporter strains, transmission electron microscopy, and the investigation of gene expression. These methods, however, can be time consuming and, in some cases, costly. The procedure described here provides a quick, reliable, and low-cost approach to measure lysosomal stress in the Drosophila brain. Using fluorescence confocal microscopy and the LysoTracker staining, this protocol allows for the direct measurement of lysosome size and number. This method can be used to assess lysosomal stress under a number of different genetic and environmental scenarios in the Drosophila brain.
Keywords: Lysosome (溶酶体)Background
In the eukaryotic cell, lysosomes are a signaling hub central to the response to stress (Ballabio and Bonifacino, 2020; Bouhamdani et al., 2021; Saftig and Puertollano, 2021). Their acidic environment and repertoire of over 60 types of hydrolytic enzymes make them the main cellular degradative organelle, capable of digesting and recycling proteins, glycans, lipids, and nucleic acids (Bouhamdani et al., 2021). Through endocytosis and autophagy, the external and internal materials delivered to lysosomes allow them to collect information about a range of cellular processes. Given that, lysosomes are key components of the response to stress, sensing the nutritional environment and the presence of pathogens, and even regulating membrane receptors (Ballabio and Bonifacino, 2020; Saftig and Puertollano, 2021). As a recipient of different environmental cues, lysosomes become a platform that generates signals to help maintain cellular homeostasis (Ballabio and Bonifacino, 2020; Saftig and Puertollano, 2021). For instance, they contain hundreds of membrane proteins and signaling complexes on the cytosolic surface, which can transmit information to the nucleus. One example is the target of rapamycin complex 1 (TORC1). In a rich nutritional environment, TORC1 becomes active and localizes to the cytosolic side of the lysosomal membrane, promoting cell anabolism. Under starvation, lysosomes radically decrease in number and increase in size and TORC1 is no longer active or present in the lysosomal membrane (Demetriades et al., 2014; Ballabio and Bonifacino, 2020; Saftig and Puertollano, 2021). These organelles are, thus, highly heterogeneous. They change in size, shape, acidity, and location depending on the cellular environment and cell type (Bouhamdani et al., 2021). Genetics and environmental factors that impair lysosomal membrane integrity, enzyme activity, acidity, and size, affect protein aggregation, or increase reactive oxygen species (ROS) levels cause lysosomal stress and may lead to cell damage or death (Lin et al., 2016; Lakpa et al., 2021). Lysosomal storage disorders (LSD) are a group of over 50 disorders that arise from mutations affecting lysosomal function and structure, resulting in their inability to digest content, and triggering their enlargement (Darios and Stevanin, 2020; Barral et al., 2022). With a high metabolic activity and lack of cellular division, neurons are especially susceptible to LSD. The buildup of non-digested lysosomal material may severely affect the neuronal activity leading to neurodegeneration (Darios and Stevanin, 2020; Barral et al., 2022).
The fly genetic toolkit offers a range of lysosomal proteins tagged with fluorescent markers that can be used to investigate lysosomal function, such as tagged Lamp (lysosomal-associated membrane protein) or Atg (autophagy-related gene) proteins (Rigon et al., 2021). Using these strains, however, may require crossing schemes in case recessive alleles are under investigation, which may become time consuming. Another approach is transmission electron microscopy, a reliable method that may be able to identify the cell types where lysosomal stress is taking place (Lorincz et al., 2017). Nonetheless, this method is not always available, may be costly relatively to other approaches, and requires a more in-depth understanding of cell morphology. Interrogating the expression of genes involved in lysosome function is also an alternative, such as RT-qPCR or next-generation sequencing (Rigon et al., 2021), but they provide indirect measures of lysosomal stress. The method described here involves the use of LysoTracker staining and fluorescence confocal microscopy, and it allows for the in vivo measurement of lysosomes’ size and number without the need of fly husbandry. LysoTracker is a dye for cellular acidic compartments, including lysosomes and autolysosomes (Chazotte, 2011). This method was recently implemented (Martelli et al., 2022) to measure the area occupied by lysosomes in the Drosophila larval brain in response to exposure to the insecticide spinosad. The procedure used here cannot pinpoint the cell type where lysosomal stress takes place, but it can be adapted with the use of other markers to achieve that. This protocol can also be modified to assess impacts on lysosomes under the effect of other drugs, rearing conditions, or mutations.
Materials and Reagents
1.7 mL microtubes (Axygen, catalog number: MCT-175-C)
48-well Nunc cell plate (Thermo Scientific, catalog number: 150687)
Micropipette 200 µL tips (Axygen, catalog number: T-200-Y)
Double-sided tape (Scotch 665 12.7 mm × 22.8 m)
Aluminum foil
Microscopy slides (Westlab, catalog number: 663-249)
Cover slips (Trajan, catalog number: 471112440M)
Fly stocks of interest
LysoTrackerTM Red DND-99 (Thermo Fisher Scientific, catalog number: L7528)
LysoTrackerTM Blue DND-22 (Thermo Fisher Scientific, catalog number: L7525).
LysoTrackerTM Green DND-26 (Thermo Fisher Scientific, catalog number: L7526).
Phosphate-buffered saline (PBS) (Sigma-Aldrich, catalog number: P5493)
Schneider's Drosophila medium 1× (Thermo Fisher Scientific, catalog number: 21720024)
Spinosad (Sigma-Aldrich, catalog number: 33706)
Dimethyl sulfoxide (DMSO) (Sigma-Aldrich, catalog number: 276855-100ML)
Vectashield 10 mL mounting medium (Vector, catalog number: VEH1000)
Analytical standard sucrose (Merk, product number: 47289)
5% sucrose solution (200 mL) (see Recipes)
1,000 ppm spinosad solution in DMSO (see Recipes)
5× spinosad stock solution (see Recipes)
5× DMSO stock solution (see Recipes)
LysoTracker 1:100 working stock solution (see Recipes)
Distilled water
Equipment
Dissecting forceps (Fine Science Tools, Dumont #5 Forceps, catalog number:1195-10)
Stereo microscope (Zeiss, model: Stemi 2000-C)
Confocal fluorescence microscope (Leica TCS SP8, DM600 CS)
Micropipette P200
500 mL laboratory bottles
Nutating mixer (Corning, catalog number: 6720)
Software
Fluorescence microscope image acquisition software (LAS X)
ImageJ/FIJI (NIH, https://fiji.sc/)
GraphPad Prism (Dotmatics, http://www.graphpad.com)
Procedure
Larvae collection and insecticide exposure
Using the micropipette, load a 48-well Nunc plate with 200 µL of 5% sucrose solution per well.
Using a pair of forceps, gently transfer 25 early third-instar larvae per well (Figure 1A, B).
For the insecticide exposure, add 50 µL of the 5× spinosad stock solution (see Recipes) to each well containing larvae to be exposed and give the plate a gentle swirl. For unexposed controls, add 50 µL of the 5× DMSO stock solution instead (see Recipes). The final concentration of insecticide used here is 2.5 ppm.
Keep the plate at 25°C and covered with aluminum foil to protect it from light for 2 h (or desirable number of hours), until exposure is over.
Once exposure time is over, using a pair of forceps gently transfer larvae to a new well containing 250 µL of 1× PBS.
Tissue dissection and staining
Transfer larvae from the PBS-containing well to a microscopy slide containing a drop of cold (4°C) Schneider's medium 1×.
Under the stereo microscope, begin the dissection. Using two pairs of forceps, hold the larval body at the midpoint (Figure 1C) and pull the anterior and posterior regions apart (Figure 1D).
Using a pair of forceps, gently transfer the anterior body section (Figure 1E) to a microtube containing 495 µL of cold (4°C) 1× PBS.
Add 5 µL of LysoTracker Red working stock solution (see Recipes) to the microtube. Final LysoTracker concentration of 1:10,000 (Figure 1F).
Wrap the microtube in aluminum foil to protect it from light and keep it at slow agitation on a nutator mixer for 7 min (Figure 1G).
Using a micropipette, slowly and completely remove the staining solution without touching the sample (Figure 1H).
Gently add 500 µL of 1× cold (4°C) PBS back into the microtube (Figure H) and place it back on the nutator mixer for 5 min (Figure I).
Under the stereo microscope, add a drop of cold (4°C) Schneider's medium 1× to a new microscopy slide. Using a pair of forceps, gently transfer the stained sample from the microtube onto the slide (Figure 1J).
Conclude the dissection by holding the anterior body section sideways with two pairs of forceps and gently pull them apart from each other to tear the cuticle. Once the brain is located, use a pair of forceps to clear the surrounding tissues (Figure 1K).
Mounting slides for fluorescence microscopy
Add a small drop of Vectashield on top of the brain, only enough to cover it. Using a pair of forceps, if necessary, adjust sample orientation.
Cut two small pieces of double-sided tape and place them flanking the sample in Vectashield.
Place the coverslip on the top, aligning its border with the double-sided tape (Figure 1L).
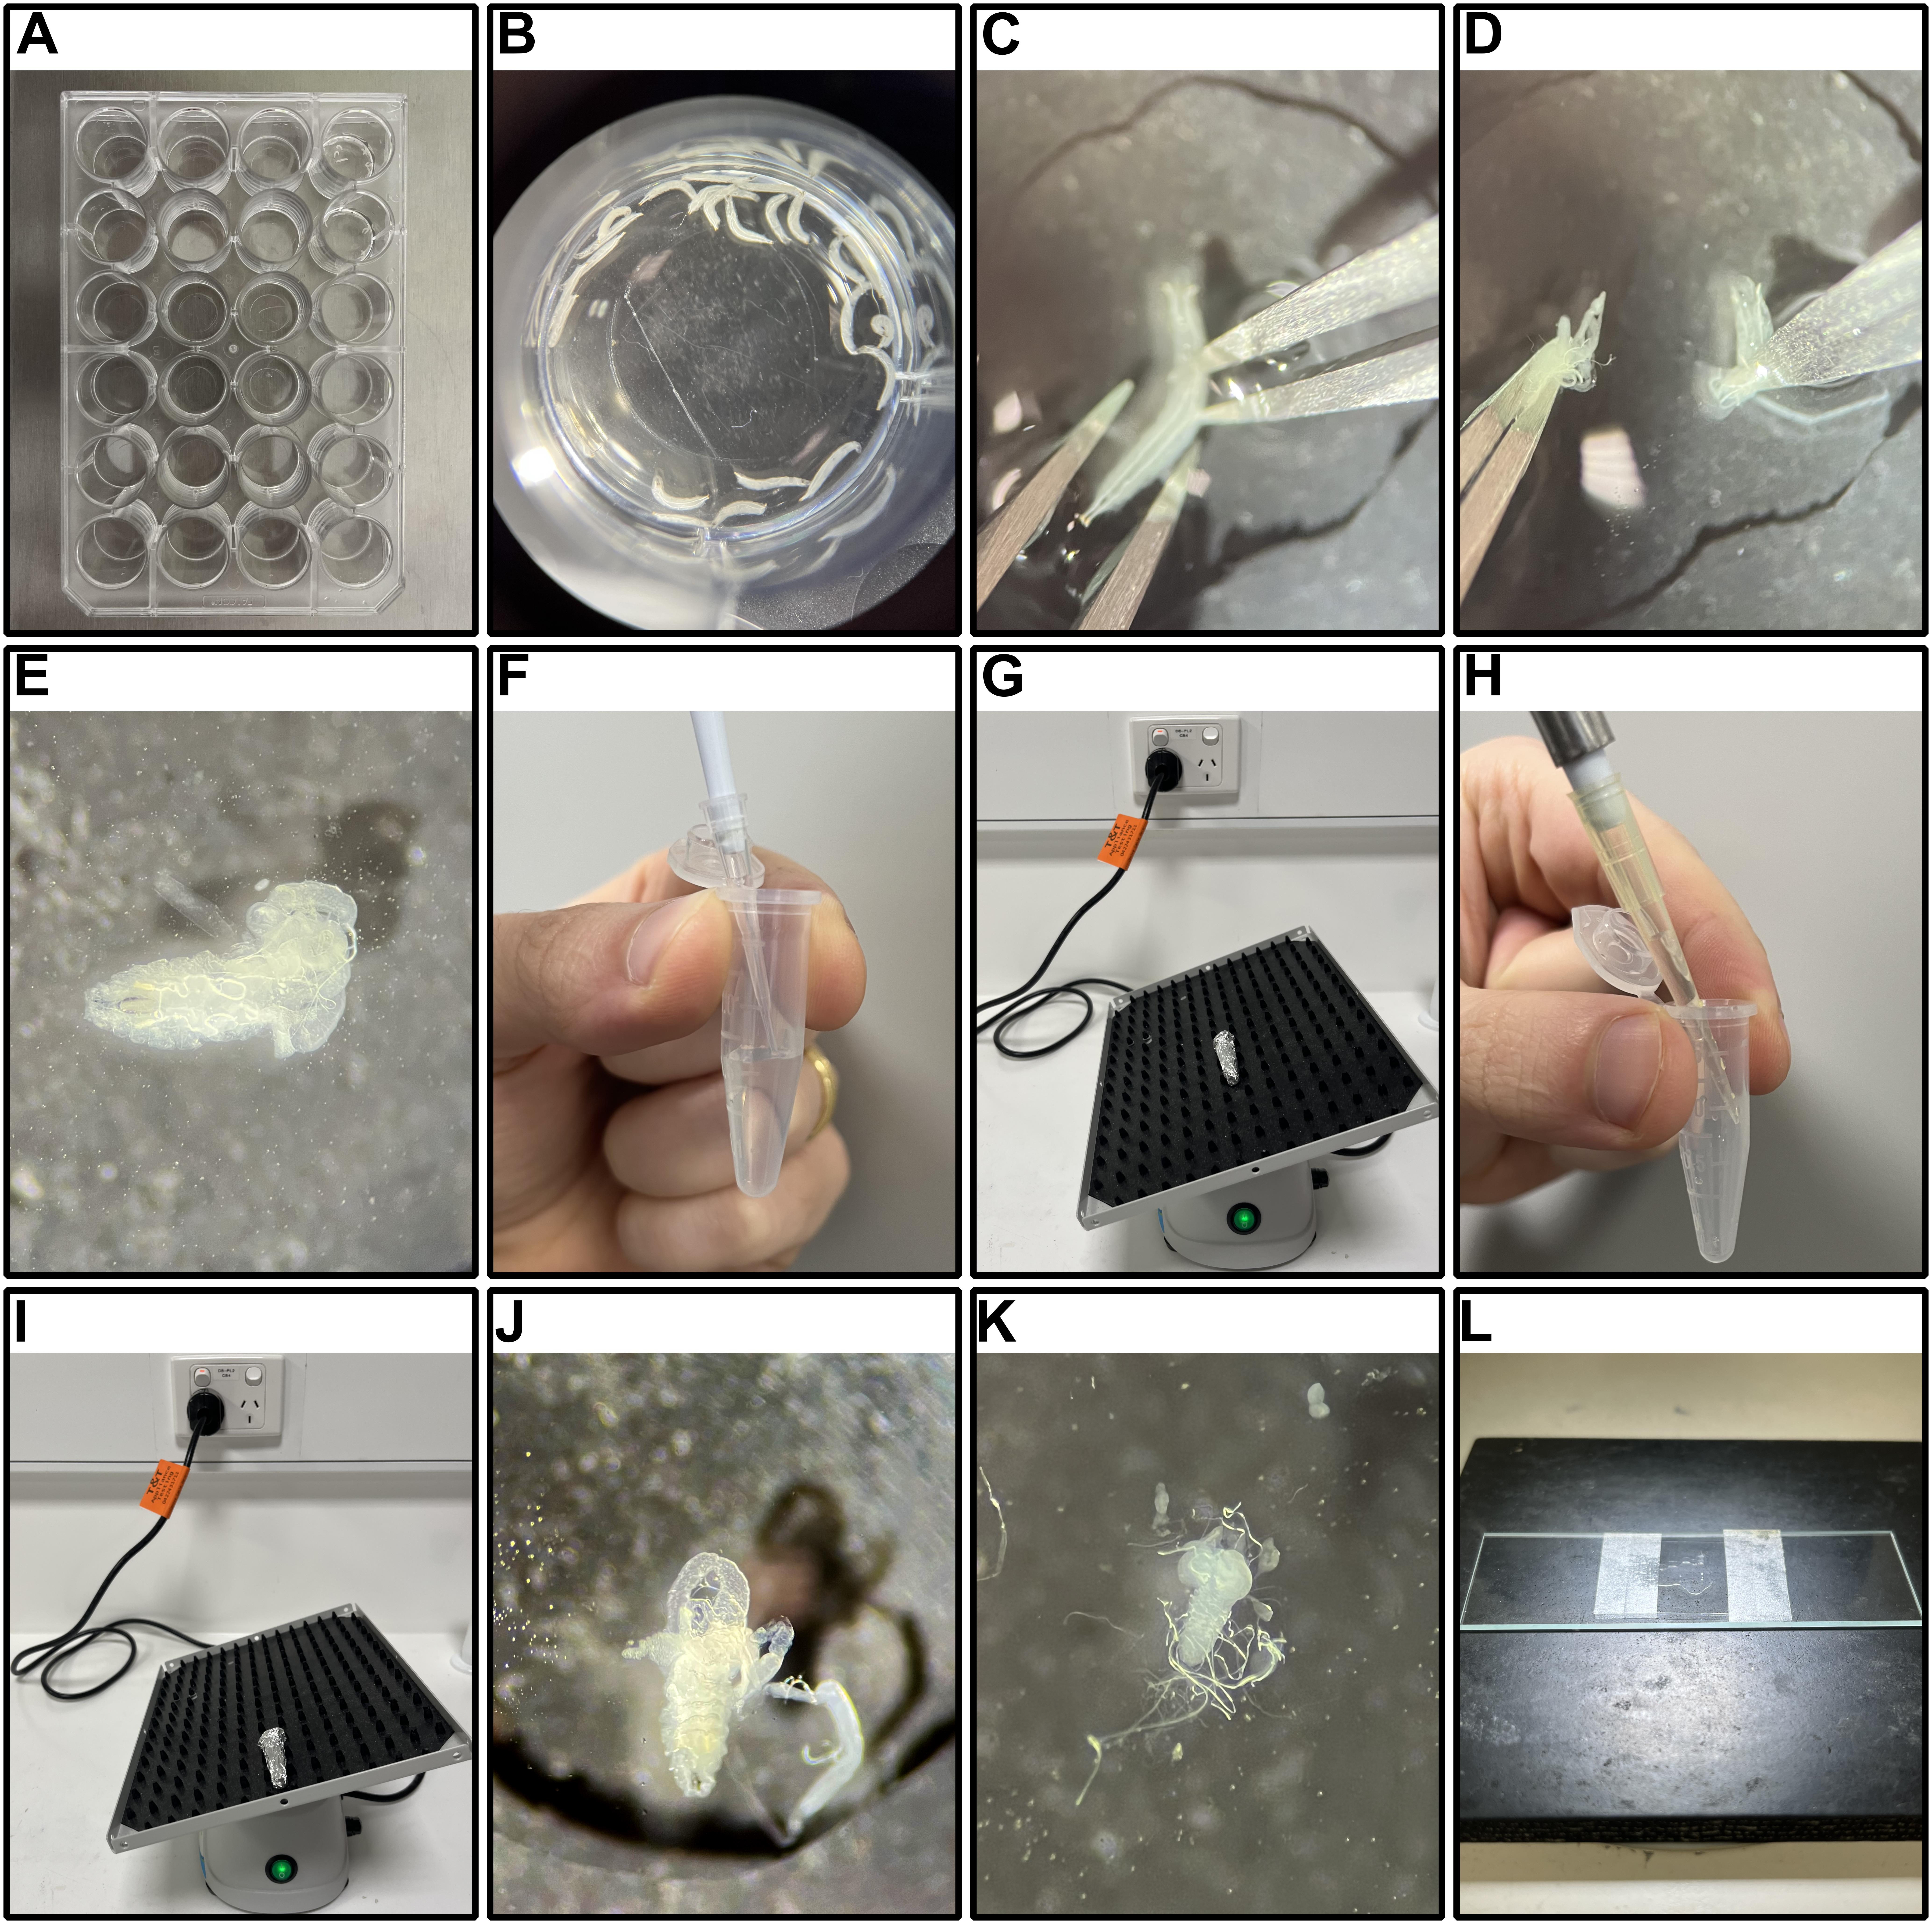
Figure 1. Experimental procedure. A. 48-well Nunc plate with 200 µL of 5% sucrose solution and 25 larvae per well. B. Detail of well containing 25 early third-instar larvae. C. For partial dissection start by holding down a larva at midpoint. D. Pull anterior and posterior body regions apart. E. Larva anterior body region. F. Transfer the anterior body region to a microtube containing cold 1× PBS and add LysoTracker Red working stock solution to it. G. Wrap the microtube in aluminum foil and keep it at slow agitation on a nutator mixer for 7 min. H. Perform one washing step by replacing the solution in the microtube with cold 1× PBS. I. Return the microtube wrapped in foil to the nutator mixer at low agitation for 5 min. J. Transfer the partially dissected sample to a slide containing a drop of cold Schneider’s medium. K. Under the microscope, conclude dissection, and isolate the brain from other tissues. L. Mount the slide for microscopy using double-sided tape, Vectashield, and a cover slip and proceed to image acquisition immediately.Imaging
Proceed to image acquisition with a confocal fluorescence microscope immediately. Given that no fixative solution is used here, time from partial dissection to acquisition of last image should be kept within 30 min to avoid tissue degradation.
In some cases, LysoTracker staining may not penetrate the more central parts of the brain or may aggregate at the brain’s surface. For that reason, to maintain consistency across samples, it is desirable to acquire images from a zone that excludes the brain’s surface and avoids central areas (Figure 2A).
To ensure consistency and accuracy in the measurements, set optimal values of laser power and gain with a control sample and maintain the same settings across all samples.
Select the same zones for imaging across all samples. Here, to maintain consistency, images were only acquired from the optic lobes.
Once the zone is localized, acquire red signal (excitation/emission 577/590 nm) using a 40× objective (NA 1.1). It is important to find consistency in the signal observed within control samples, as well as exposed samples. Lack of consistency may indicate sample degradation or inappropriate staining.
Acquire at least 20 images across the z-stack for every sample with 1 µm distance between them and avoid imaging the sample’s top and bottom. Image at least seven brain samples per group/treatment condition.
Data analysis
Analyzing microscopy images on ImageJ
Open the image files on ImageJ and, using the rectangle selection tool, create a region of interest (ROI) of 30 × 30 µm (Figure 2A). The ROI will be used to quantify the percentage of area occupied by LysoTracker.
Right click on the rectangle and duplicate the selected area.
On top bar menu, click Image > Adjust > Threshold. A new window will appear; select Dark background. If necessary, adjust the threshold bar to reduce background. Take note of the percentage of area occupied by LysoTracker (Figure 2B).
Acquire three to five independent ROIs, randomly assigned across the z-stack and within the zone, to each sample. Measure the percentage of area occupied by LysoTracker for each ROI in the same way.
LysoTracker is also available in the options blue and green.
Statistical analysis and plotting
Make an average of the independent measurements acquired per sample. Use these averaged values for plotting graphs and performing statistical analysis.
Using a statistics software of your preference (such as GraphPad Prism), perform a Student’s unpaired t-test. Plot results as a bar plot including the dot plot for individual values (Figure 2C).
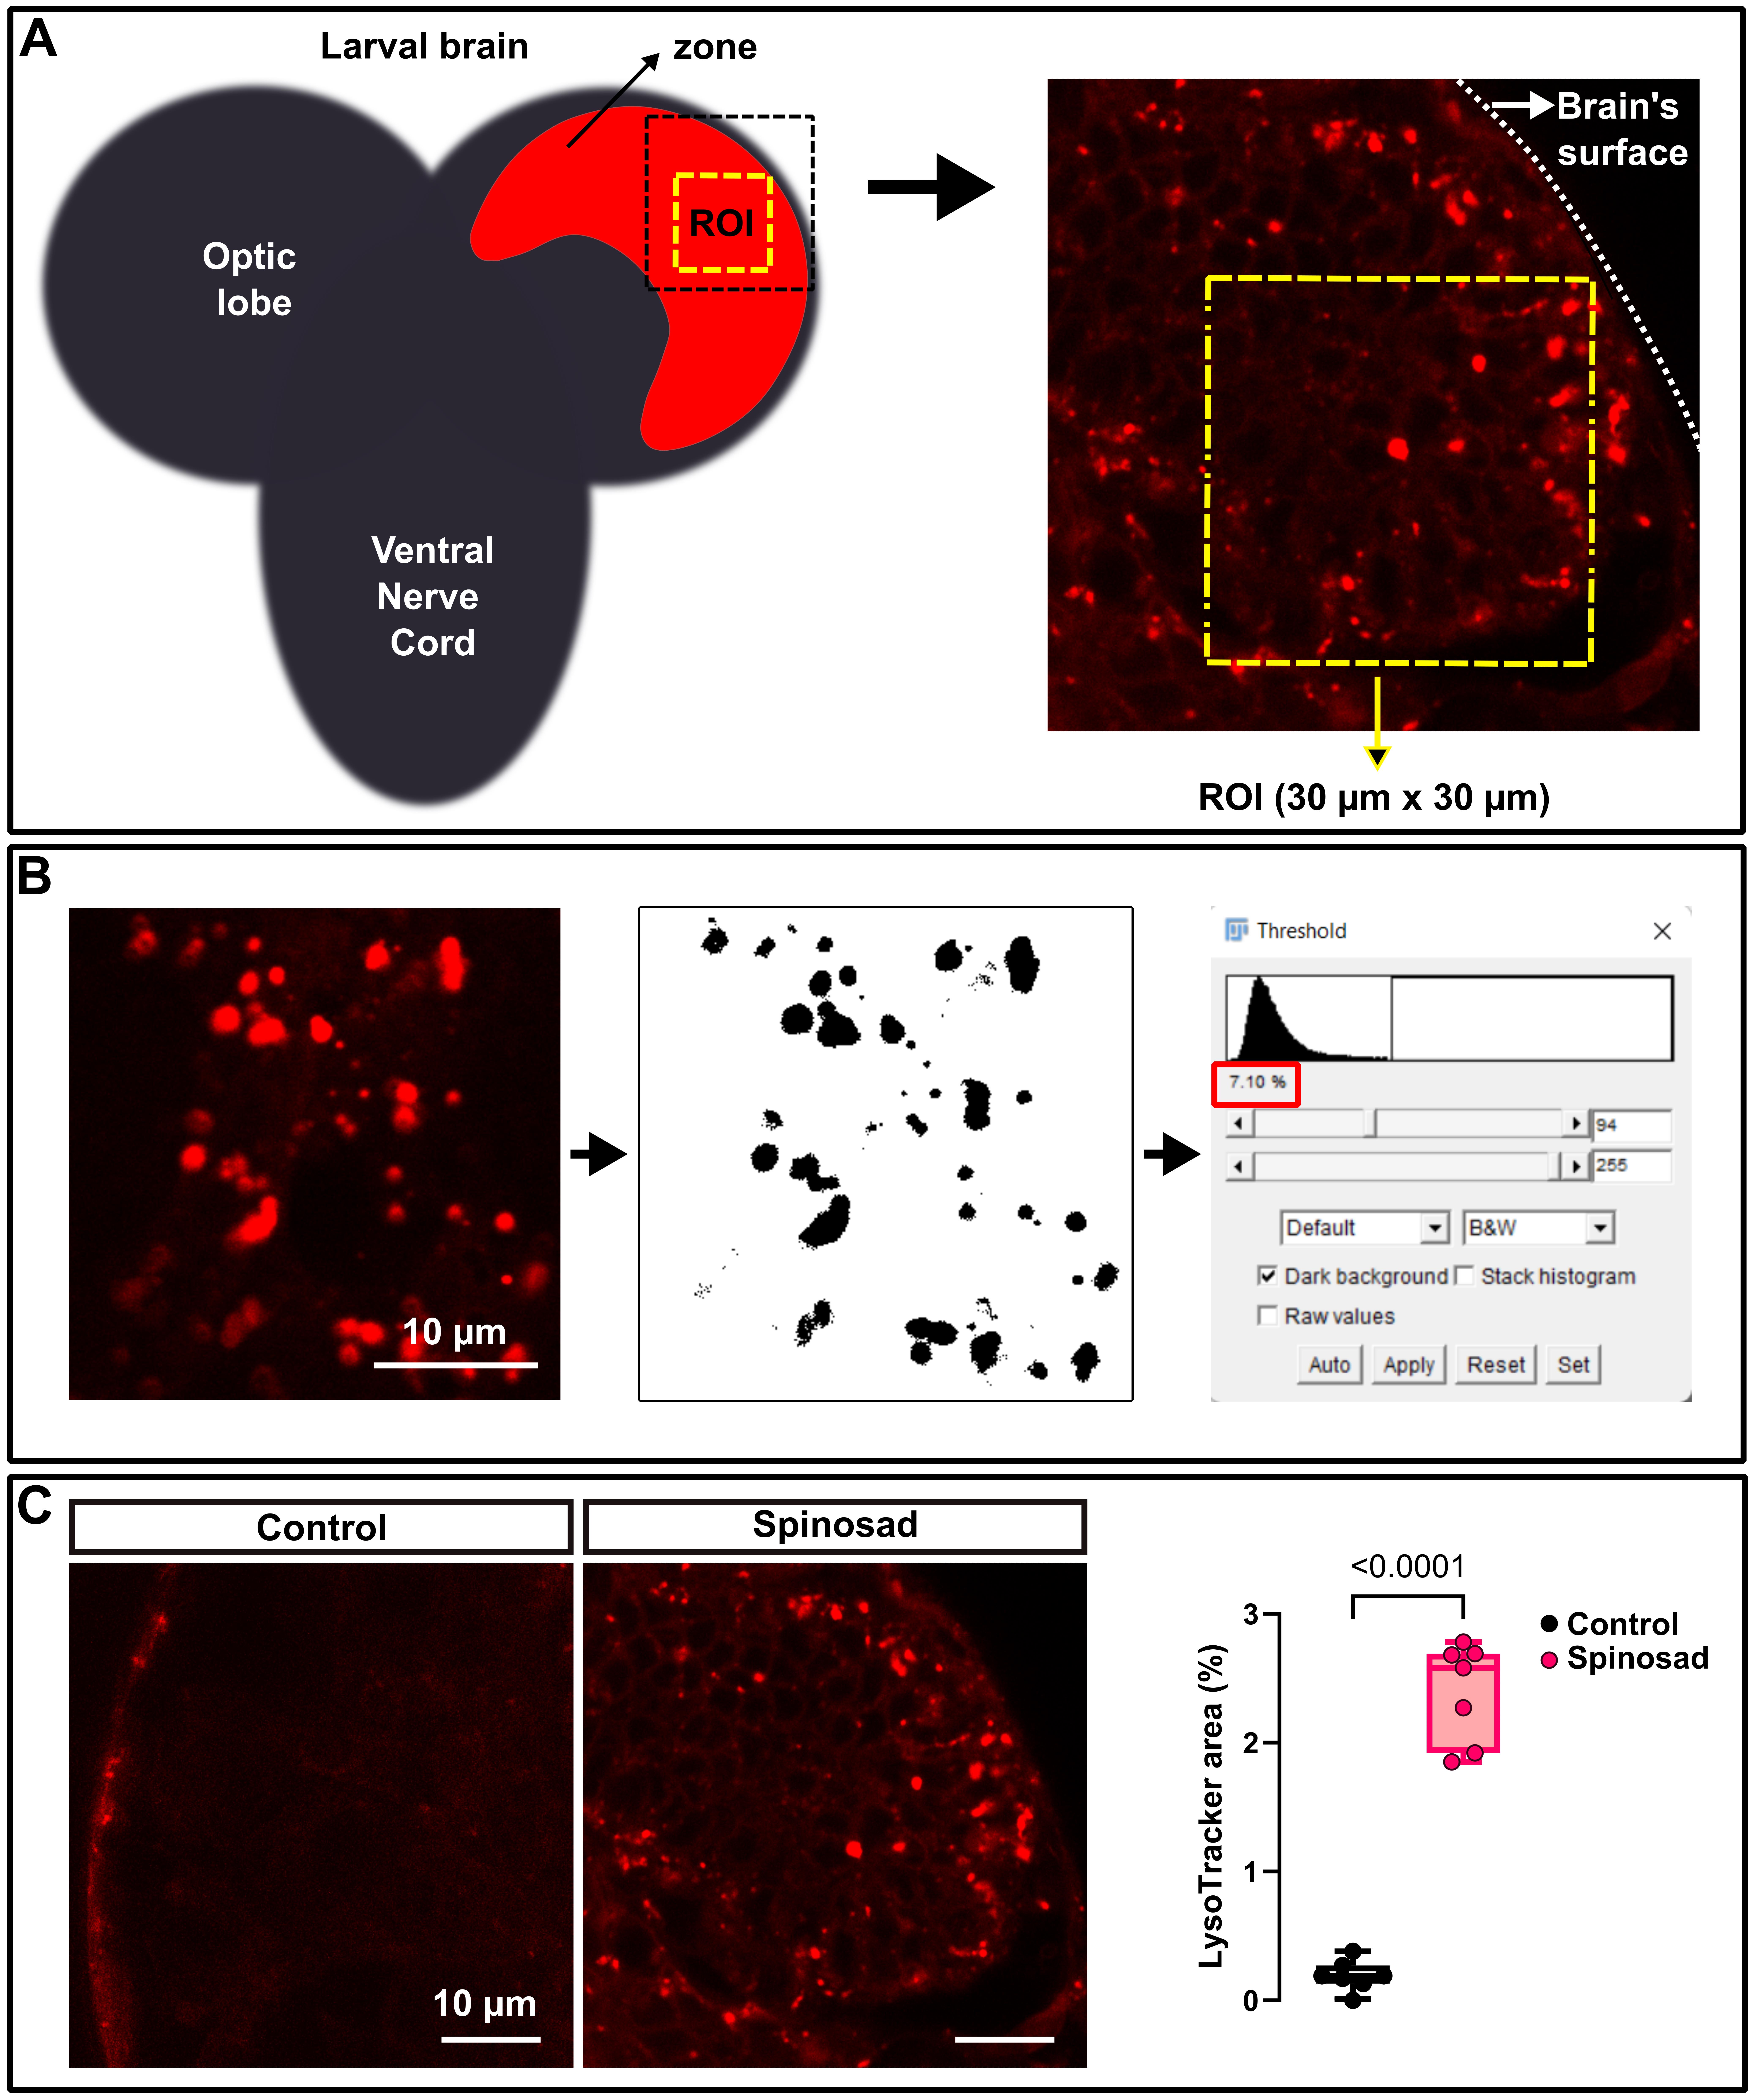
Figure 2. Image analysis and data representation. A. Acquire images of the brain zone (i.e., excluding the brain’s surface and avoiding central areas) from where regions of interest (ROIs) will be later selected. B. Duplicate a 30 × 30 µm ROI and, using the threshold tool, measure the percentage of area occupied by LysoTracker (small red box). 400× magnification. C. LysoTracker area (%) (n = 7 brain samples/treatment; three image sections/brain), Student’s unpaired t-test, p-value < 0.0001.
Notes
Given the exposure method used here, early third-instar larvae are preferable, as late wandering third instars may crawl out of the wells or start pupation during insecticide exposure.
Start the exposure of each well at regular intervals to accommodate time to perform dissections and microscopy. This will optimize the number of samples that can be assessed per experimental batch.
Recipes
5% sucrose solution (200 mL)
Distilled water 190 mL
Analytical standard sucrose 10 g
Into a 500 mL glass bottle, add 190 mL of water and 10 g of sucrose. Give the bottle a swirl until completely dissolved. The solution can be stored at 4°C for up to one month. Solution must be at room temperature for usage.
1,000 ppm spinosad solution in DMSO
DMSO 1 mL
Spinosad 1 mg
Add 1 mL of DMSO and 1 mg of spinosad into a 1.7 mL microtube and vortex it vigorously for a few minutes until solubilized. Create ten 100 µL aliquots in separated microtubes and store them at -20°C. Avoiding multiple freeze-thaw cycles and protecting the solutions from light will increase the insecticide’s half-life. Let the solution thaw at room temperature before usage.
5× spinosad stock solution
1,000 ppm spinosad solution in DMSO 12.5 µL
5% sucrose solution 987.5 µL
Add 987.5 µL of 5% sucrose solution and 12.5 µL of the 1,000 ppm spinosad solution in DMSO into a 1.7 mL microtube and vortex for 30 s. This will create a 12.5 ppm spinosad solution that will be used to dose the wells of the Nunc plate where larvae are to be exposed.
5× DMSO stock solution
DMSO 12.5 µL
5% sucrose solution 987.5 µL
Add 987.5 µL of 5% sucrose solution and 12.5 µL of DMSO into a 1.7 mL microtube and vortex it for 30 s. This will create a 12.5 ppm DMSO solution that will be used to generate the control exposure.
LysoTracker 1:100 working stock solution
1× PBS 495 µL
LysoTrackerTM Red DND-99 5 µL
Thaw one LysoTrackerTM Red DND-99 vial at room temperature. To a 1.7 mL microtube add 495 µL of 1× PBS and 5 µL of LysoTrackerTM Red DND-99. Using a micropipette, gently mix the solution. Wrap the microtube in foil to protect it from light and keep it at room temperature. Prepare it immediately before usage.
Acknowledgments
The author was supported by a Victorian Latin America Doctoral Scholarship (Victorian Government and the University of Melbourne), an Alfred Nicholas Fellowship (University of Melbourne), and a University of Melbourne Faculty of Science Travelling Scholarship.
Original research paper:
Martelli, F., Hernandes, N. H., Zuo, Z., Wang, J., Wong, C. O., Karagas, N. E., Roessner, U., Rupasinghe, T., Robin, C., Venkatachalam, K., et al. (2022). Low doses of the organic insecticide spinosad trigger lysosomal defects, elevated ROS, lipid dysregulation, and neurodegeneration in flies.Elife 11: e73812.
Competing interests
The author declares no conflicts of interest.
Ethics
Genetically modified Drosophila strains were maintained in a physical containment insectary facility following the biosafety guidelines by the Office of Research Ethics & Integrity at the University of Melbourne.
References
- Ballabio, A. and Bonifacino, J. S. (2020). Lysosomes as dynamic regulators of cell and organismal homeostasis. Nat Rev Mol Cell Biol 21(2): 101-118.
- Barral, D. C., Staiano, L., Guimas Almeida, C., Cutler, D. F., Eden, E. R., Futter, C. E., Galione, A., Marques, A. R. A., Medina, D. L., Napolitano, G., et al. (2022). Current methods to analyze lysosome morphology, positioning, motility and function. Traffic 23(5): 238-269.
- Bouhamdani, N., Comeau, D. and Turcotte, S. (2021). A Compendium of Information on the Lysosome. Front Cell Dev Biol 9: 798262.
- Chazotte, B. (2011). Labeling lysosomes in live cells with LysoTracker. Cold Spring Harb Protoc 2011(2): pdb prot5571.
- Darios, F. and Stevanin, G. (2020). Impairment of Lysosome Function and Autophagy in Rare Neurodegenerative Diseases. J Mol Biol 432(8): 2714-2734.
- Demetriades, C., Doumpas, N. and Teleman, A. A. (2014). Regulation of TORC1 in response to amino acid starvation via lysosomal recruitment of TSC2. Cell 156(4): 786-799.
- Lakpa, K. L., Khan, N., Afghah, Z., Chen, X. and Geiger, J. D. (2021). Lysosomal Stress Response (LSR): Physiological Importance and Pathological Relevance. J Neuroimmune Pharmacol 16(2): 219-237.
- Lin, J., Shi, S. S., Zhang, J. Q., Zhang, Y. J., Zhang, L., Liu, Y., Jin, P. P., Wei, P. F., Shi, R. H., Zhou, W., et al. (2016). Giant Cellular Vacuoles Induced by Rare Earth Oxide Nanoparticles are Abnormally Enlarged Endo/Lysosomes and Promote mTOR-Dependent TFEB Nucleus Translocation. Small 12(41): 5759-5768.
- Lorincz, P., Mauvezin, C. and Juhasz, G. (2017). Exploring Autophagy in Drosophila. Cells 6(3).
- Martelli, F., Hernandes, N. H., Zuo, Z., Wang, J., Wong, C. O., Karagas, N. E., Roessner, U., Rupasinghe, T., Robin, C., Venkatachalam, K., et al. (2022). Low doses of the organic insecticide spinosad trigger lysosomal defects, elevated ROS, lipid dysregulation, and neurodegeneration in flies. Elife 11: e73812.
- Rigon, L., De Filippis, C., Napoli, B., Tomanin, R. and Orso, G. (2021). Exploiting the Potential of Drosophila Models in Lysosomal Storage Disorders: Pathological Mechanisms and Drug Discovery. Biomedicines 9(3).
- Saftig, P. and Puertollano, R. (2021). How Lysosomes Sense, Integrate, and Cope with Stress. Trends Biochem Sci 46(2): 97-112.
文章信息
版权信息
Martelli. This article is distributed under the terms of the Creative Commons Attribution License (CC BY 4.0).
如何引用
Readers should cite both the Bio-protocol article and the original research article where this protocol was used:
- Martelli, F. (2023). In vivo Assessment of Lysosomal Stress in the Drosophila Brain Using Confocal Fluorescence Microscopy. Bio-protocol 13(2): e4599. DOI: 10.21769/BioProtoc.4599.
- Martelli, F., Hernandes, N. H., Zuo, Z., Wang, J., Wong, C. O., Karagas, N. E., Roessner, U., Rupasinghe, T., Robin, C., Venkatachalam, K., et al. (2022). Low doses of the organic insecticide spinosad trigger lysosomal defects, elevated ROS, lipid dysregulation, and neurodegeneration in flies. Elife 11: e73812.
分类
神经科学 > 神经系统疾病 > 细胞机制
细胞生物学 > 细胞染色 > 细胞器
细胞生物学 > 细胞成像 > 共聚焦显微镜
您对这篇实验方法有问题吗?
在此处发布您的问题,我们将邀请本文作者来回答。同时,我们会将您的问题发布到Bio-protocol Exchange,以便寻求社区成员的帮助。
Share
Bluesky
X
Copy link


