

Gastrulation Screening to Identify Anti-metastasis Drugs in Zebrafish Embryos
原肠胚筛选以识别斑马鱼胚胎中的抗转移药物
发布: 2022年10月05日第12卷第19期 DOI: 10.21769/BioProtoc.4525 浏览次数: 2540
评审: Xi FengQin TangSalim Gasmi
参见作者原研究论文
The authors used this protocol in:

Dec 2021
Advertisement


Abstract
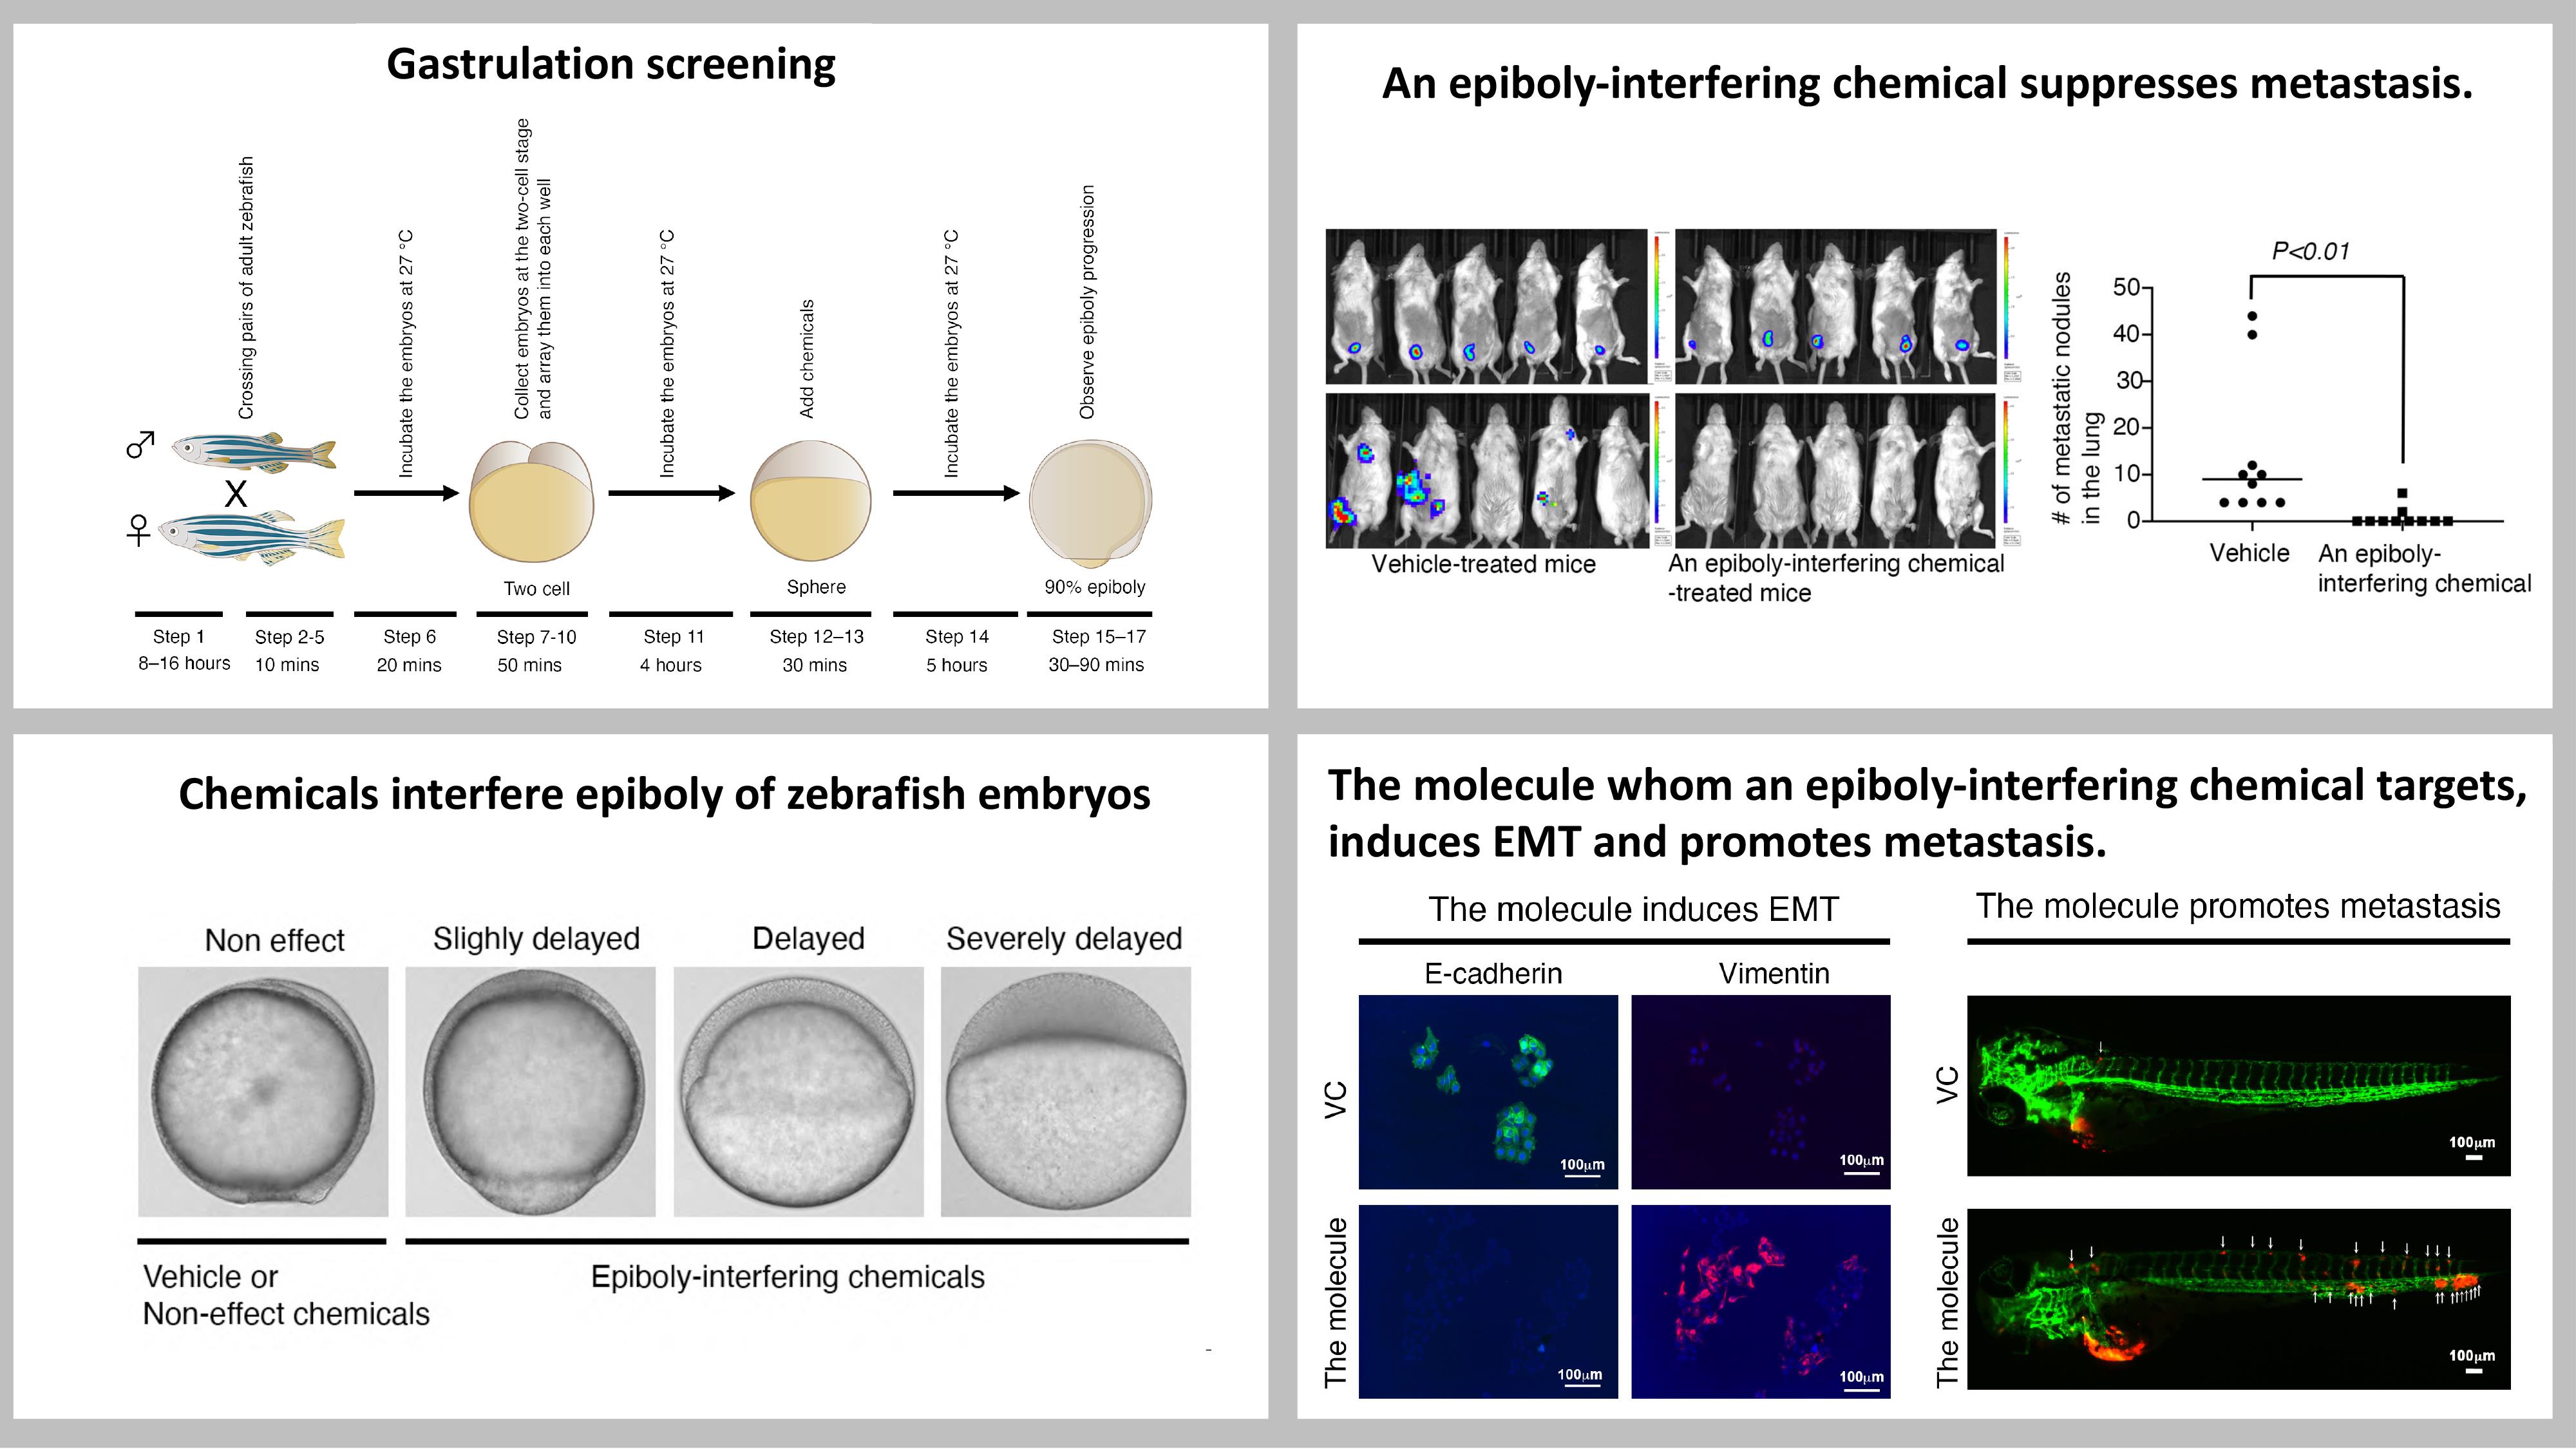
Few models exist that allow for rapid and effective screening of anti-metastasis drugs. Here, we present a drug screening protocol utilizing gastrulation of zebrafish embryos for identification of anti-metastasis drugs. Based on the evidence that metastasis proceeds through utilizing the molecular mechanisms of gastrulation, we hypothesized that chemicals interrupting zebrafish gastrulation might suppress the metastasis of cancer cells. Thus, we developed a phenotype-based chemical screen that uses epiboly, the first morphogenetic movement in gastrulation, as a marker. The screen only needs zebrafish embryos and enables hundreds of chemicals to be tested in five hours by observing the epiboly progression of chemical-treated embryos. In the screen, embryos at the two-cell stage are firstly corrected and then developed to the sphere stage. The embryos are treated with a test chemical and incubated in the presence of the chemical until vehicle-treated embryos develop to the 90% epiboly stage. Finally, positive ‘hit’ chemicals that interrupt epiboly progression are selected by comparing epiboly progression of the chemical-treated and vehicle-treated embryos under a stereoscopic microscope. A previous study subjected 1,280 FDA-approved drugs to the screen and identified adrenosterone and pizotifen as epiboly-interrupting drugs. These were validated to suppress metastasis of breast cancer cells in mice models of metastasis. Furthermore, 11β-hydroxysteroid dehydrogenase 1 (HSD11β1) and serotonin receptor 2C (HTR2C), the primary targets of adrenosterone and pizotifen, respectively, promoted metastasis through induction of epithelial-mesenchymal transition (EMT). Therefore, this screen could be converted into a chemical genetic screening platform for identification of metastasis-promoting genes.
Graphical abstract:
Background
Cancer research using zebrafish as a model has attracted attention because it offers many unique advantages that are not readily provided by other animal models. Furthermore, the zebrafish system has also been increasingly recognized as a chemical screening platform because it provides the advantage of high-throughput screening in an in vivo vertebrate setting with physiologic relevance to humans (Zon and Peterson, 2005; MacRae and Peterson, 2015; Nakayama et al., 2020; Nakayama and Makinoshima, 2020; Nakayama and Gong, 2020).
Metastasis is responsible for approximately 90% of cancer-associated mortality. It proceeds through multiple steps: invasion, intravasation, survival in the circulatory system, extravasation, colonization, and metastatic tumor formation in secondary organs with angiogenesis (Nguyen et al., 2009; Chaffer and Weinberg, 2011; Welch and Hurst, 2019). Dissemination of cancer cells is an initial step of metastasis, and its molecular mechanism involves local breakdown of basement membrane, loss of cell polarity, and induction of epithelial-mesenchymal transition (EMT) (Tsai, J. H. and Yang, 2013; Lu, W. and Kang, 2019). These cellular and biological phenomena are also observed during vertebrate gastrulation in that evolutionarily conserved morphogenetic movements of epiboly, internalization, convergence, and extension cooperate to generate germ layers and sculpt the body plan (Solnica-Krezel, 2005). In zebrafish, the first morphogenetic movement, epiboly, is initiated at approximately four hours post fertilization (hpf) to move cells from the animal pole to eventually engulf the entire yolk cell by 10 hpf. These movements are governed by molecular mechanisms that are induced by temporally and spatially regulated gene expression; these mechanisms and changes in gene expression are partially observed in metastatic progression (White et al., 2017).
At least 50 common genes are involved in both gastrulation and metastasis progression (Table 1) (Yang, J. and Weinberg, 2008; Thiery et al., 2009; Nieto et al., 2016; Dongre and Weinberg, 2019; Yang, J. et al., 2020). These genes are expressed in Xenopus or zebrafish embryos, and genetic inhibition of each gene in these embryos interferes with gastrulation progression. Conversely, the same 50 genes are ectopically expressed in metastatic cancer cells and confer metastatic properties to cancer cells; genetic inhibition of each of these genes suppresses metastasis progression. This evidence led us to hypothesize that chemicals that interfere with zebrafish gastrulation might suppress metastasis progression of cancer cells. Based on the hypothesis, we developed a phenotype-based chemical screen that uses epiboly, the first morphogenetic movement in gastrulation, as a marker. This screen measures the suppressor effect of each test chemical by observing epiboly progression of chemical-treated embryos (Figures 1 and 2).
Table 1. A list of the 50 common genes that are involved in gastrulation and metastasis progression.
| Genes | Gastrulation Defects | Reference | Effects in Metastasis | Reference |
|---|---|---|---|---|
| BMP | Convergence and extension | (Kondo, 2007) | EMT | (Katsuno et al., 2008) |
| WNT | Convergence and extension | (Tada and Smith, 2000) | Migration and invasion | (Vincan and Barker, 2008) |
| FGF | Convergence and extension | (Yang, X. et al., 2002) | Invasion | (Nomura et al., 2008) |
| EGF | Epiboly | (Song et al., 2013) | Migration | (Lu, Z. et al., 2001) |
| PDGF | Convergence and extension | (Damm and Winklbauer, 2011) | EMT | (Jechlinger et al., 2006) |
| CXCL12 | Migration of endodermal cells | (Mizoguchi et al., 2008) | Migration and invasion | (Shen et al., 2013) |
| CXCR4 | Migration of endodermal cells | (Mizoguchi et al., 2008) | Migration and invasion | (Shen et al., 2013) |
| PIK3CA | Convergence and extension | (Montero et al., 2003) | Migration and invasion | (Wander et al., 2013) |
| YES | Epiboly | (Tsai, W. B. et al., 2005) | Migration | (Barraclough et al., 2007) |
| FYN | Epiboly | (Sharma et al., 2005) | Migration and invasion | (Yadav and Denning, 2011) |
| MAPK1 | Epiboly | (Krens et al., 2008) | Migration | (Radtke et al., 2013) |
| SHP2 | Convergence and extension | (Jopling et al., 2007) | Migration | (Wang, F. M. et al., 2005) |
| SNAI1 | Convergence and extension | (Ip and Gridley, 2002) | EMT | (Batlle et al., 2000) |
| SNAI2 | Mesoderm and neural crest formation | (Shi, J. et al., 2011) | EMT | (Medici et al., 2008) |
| TWIST1 | Mesoderm formation | (Castanon and Baylies, 2002) | EMT | (Yang, J. et al., 2004) |
| TBXT | Convergence and extension | (Tada and Smith, 2000) | EMT | (Fernando et al., 2010) |
| ZEB1 | Epiboly | (Vannier et al., 2013) | EMT | (Spaderna et al., 2008) |
| GSC | Mesodermal patterning | (Sander et al., 2007) | EMT | (Hartwell et al., 2006) |
| FOXC2 | Unclear, defects in gastrulation | (Wilm et al., 2004) | EMT | (Mani et al., 2007) |
| STAT3 | Convergence and extension | (Miyagi et al., 2004) | Migration | (Abdulghani et al., 2008) |
| POU5F1 | Epiboly | (Lachnit et al., 2008) | EMT | (Dai et al., 2013) |
| EZH2 | Unclear, defects in gastrulation | (O'Carroll et al., 2001) | Invasion | (Ren et al., 2012) |
| EHMT2 | Defects in neurogenesis | (Lin, F. et al., 2005) | Migration and invasion | (Chen et al., 2010) |
| BMI1 | Defects in skeleton formation | (van der Lugt et al., 1994) | EMT | (Guo et al., 2011) |
| RHOA | Convergence and extension | (Zhu, S. et al., 2006) | Migration and invasion | (Yoshioka et al., 1999) |
| CDC42 | Convergence and extension | (Choi and Han, 2002) | Migration and invasion | (Reymond et al., 2012) |
| RAC1 | Convergence and extension | (Habas et al., 2003) | Migration and invasion | (Vega and Ridley, 2008) |
| ROCK2 | Convergence and extension | (Marlow et al., 2002) | Migration and invasion | (Itoh et al., 1999) |
| PAR1 | Convergence and extension | (Kusakabe and Nishida, 2004) | Migration | (Shi, X. et al., 2004) |
| PRKCI | Convergence and extension | (Kusakabe and Nishida, 2004) | EMT | (Gunaratne et al., 2013) |
| CAP1 | Convergence and extension | (Seifert et al., 2009) | Migration | (Yamazaki et al., 2009) |
| EZR | Epiboly | (Link et al., 2006) | Migration | (Khanna et al., 2004) |
| EPCAM | Epiboly | (Slanchev et al., 2009) | Migration and invasion | (Ni et al., 2012) |
| ITGB1/ITA5 | Mesodermal migration | (Skalski et al., 1998) | Migration and invasion | (Felding-Habermann, 2003) |
| FN1 | Convergence and extension | (Marsden and DeSimone, 2003) | Invasion | (Malik et al., 2010) |
| HAS2 | Dorsal migration of lateral cells | (Bakkers et al., 2004) | Invasion | (Kim et al., 2004) |
| MMP14 | Convergence and extension | (Coyle et al., 2008) | Invasion | (Perentes et al., 2011) |
| COX1 | Epiboly | (Cha et al., 2006) | Invasion | (Kundu and Fulton, 2002) |
| PTGES | Convergence and extension | (Speirs et al., 2010) | Invasion | (Wang, D. and Dubois, 2006) |
| SLC39A6 | Anterior migration | (Yamashita et al., 2004) | EMT | (Lue et al., 2011) |
| GNA12/13 | Convergence and extension | (Lin, F. et al., 2005) | Migration and invasion | (Yagi et al., 2011) |
| OGT | Epiboly | (Webster et al., 2009) | Migration and invasion | (Lynch et al., 2012) |
| CCN1 | Cell movement | (Latinkic, 2003) | Migration and invasion | (Lin, J. et al., 2012) |
| TRPM7 | Convergence and extension | (Liu et al., 2011) | Migration | (Middelbeek et al., 2012) |
| MAPKAPK2 | Epiboly | (Holloway et al., 2009) | Migration | (Kumar et al., 2010) |
| B4GALT1 | Convergence and extension | (Machingo et al., 2006) | Invasion | (Zhu, X. et al., 2005) |
| IER2 | Convergence and extension | (Hong et al., 2011) | Migration | (Neeb et al., 2012) |
| TIP1 | Convergence and extension | (Besser et al., 2007) | Migration and invasion | (Han et al., 2012) |
| PAK5 | Convergence and extension | (Faure et al., 2005) | Migration | (Gong et al., 2009) |
| MARCKS | Convergence and extension | (Iioka et al., 2004) | Migration and invasion | (Rombouts et al., 2013) |
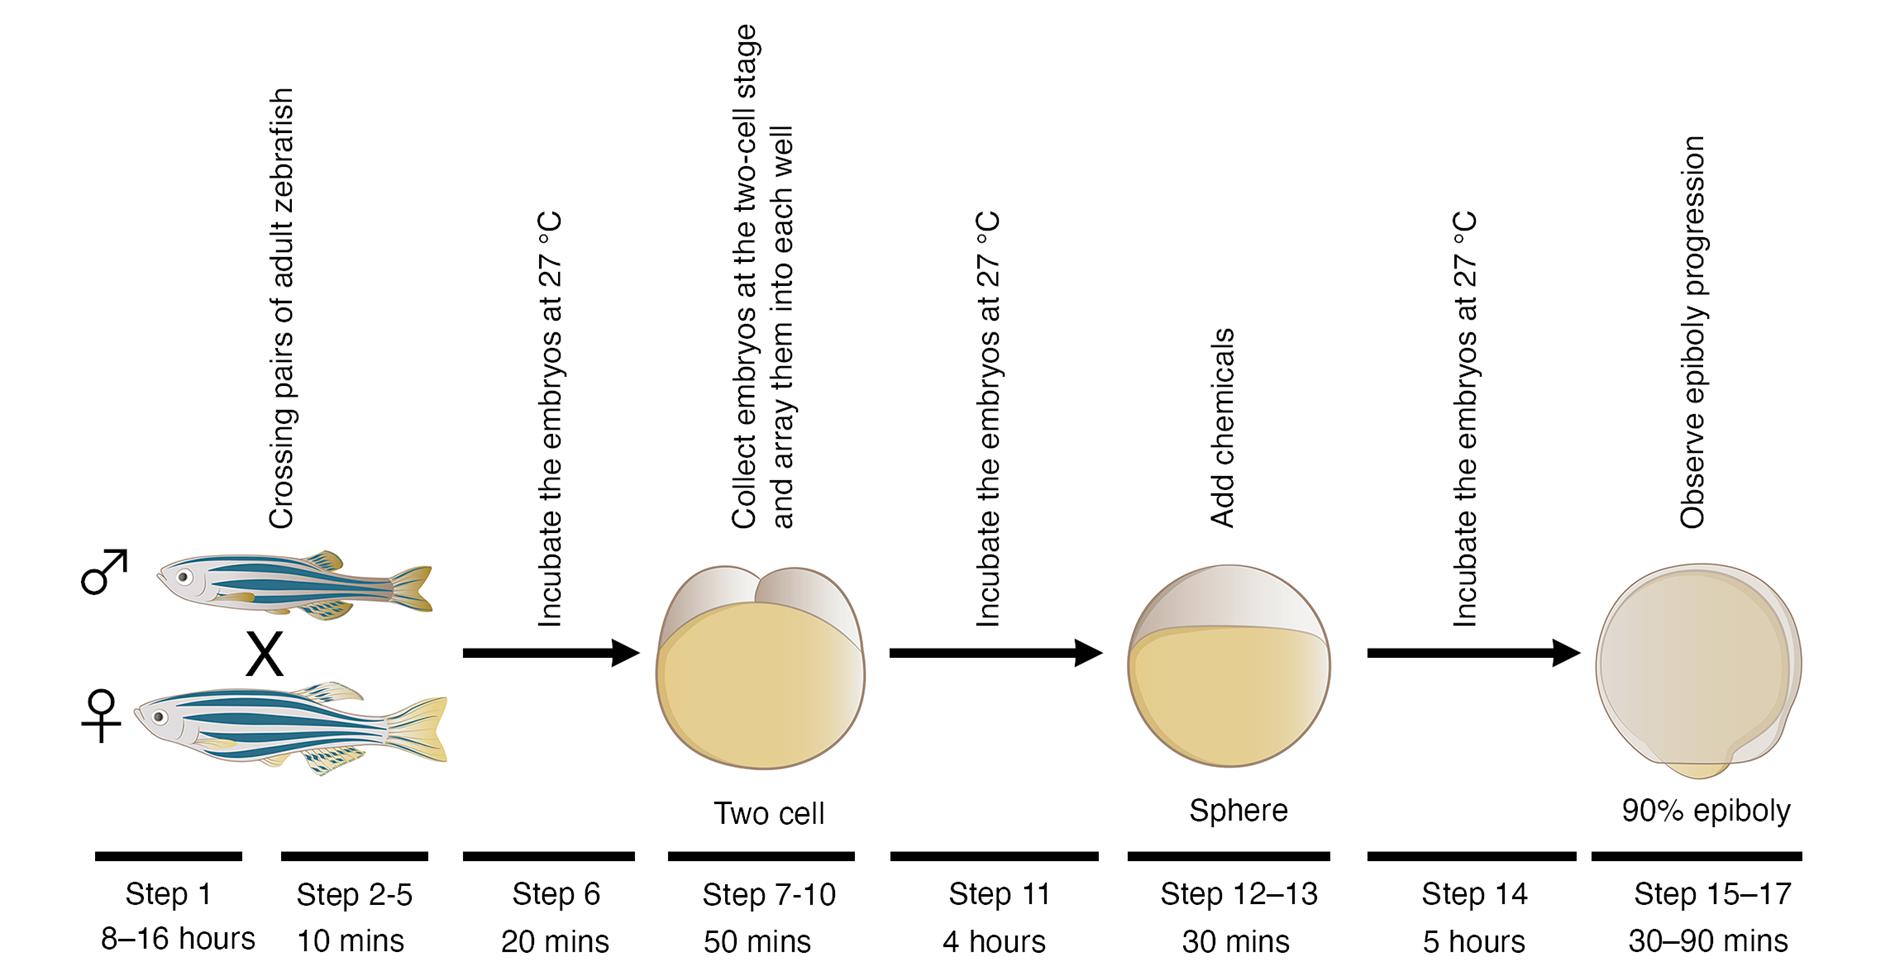
Figure 1. Schematic diagram of a phenotype-based chemical screen using zebrafish embryos. Pairs of adult zebrafish are crossed, and their embryos are collected at the two-cell stage and arrayed into individual wells of a 24-well plate. Different chemicals are added to each well when the embryos develop to the sphere stage. Epiboly progression of each chemical-treated embryo is compared to DMSO-treated embryos under a stereoscopic microscope when DMSO-treated embryos develop to the 90% epiboly stage.
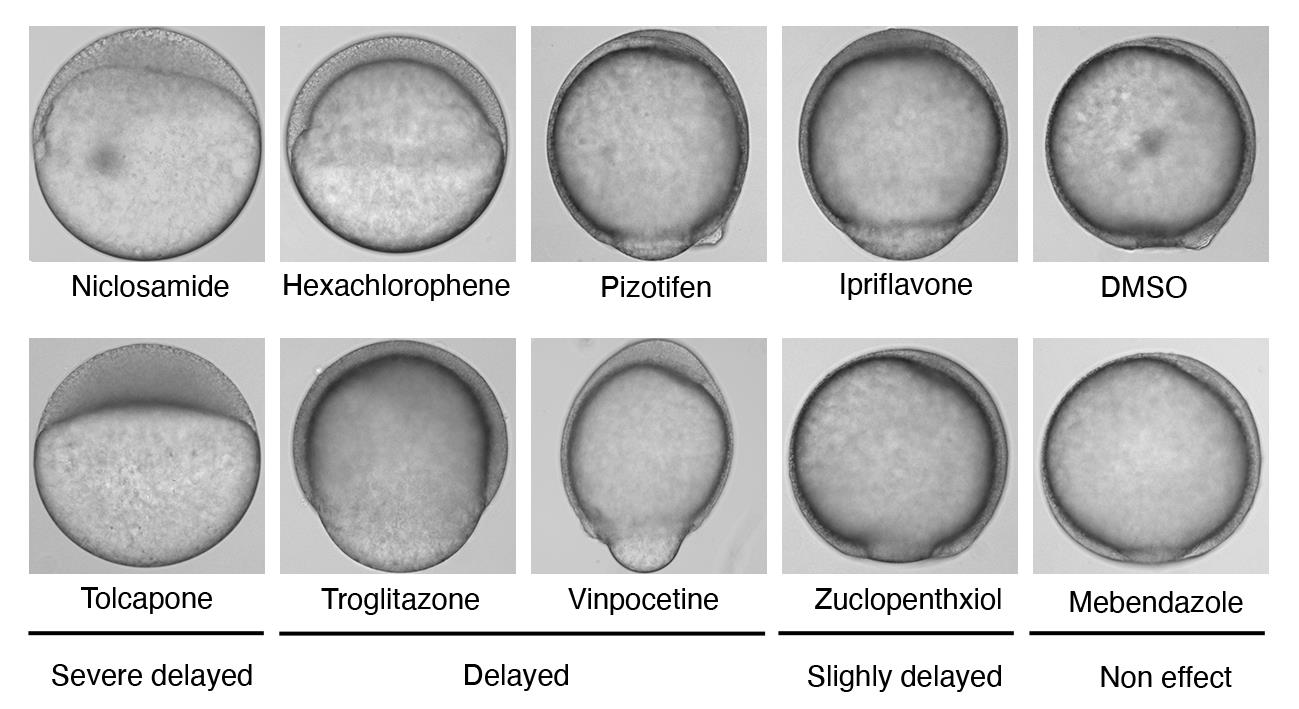
Figure 2. Representative samples of chemical-treated embryos. Embryos at the sphere stage were treated with 10 μM of each indicated chemical. Niclosamide-treated embryos served as positive controls, while DMSO-treated embryos served as negative controls. Epiboly progression of each chemical-treated embryo was compared with that of DMSO-treated embryos under a stereoscopic microscope, when DMSO-treated embryos developed to the 90% epiboly stage.
This screen enables hundreds of chemicals to be tested in only five hours. Our study subjected 1,280 FDA-approved drugs to this screen and identified adrenosterone and pizotifen as epiboly-interfering drugs. These were further validated to suppress metastasis of breast cancer cells in mouse models of metastasis (Figure 3) (Nakayama et al., 2021a, 2021b). This screen can also measure suppressor effect of crude drugs. We subjected 120 herbal medicines to this screen and identified cinnamon bark extract as an epiboly-interfering drug. Cinnamon bark extract was validated to suppress metastatic dissemination of breast cancer cells in a zebrafish xenograft model (Nakayama et al., 2022). Moreover, this screen can be converted into a chemical genetic screening platform for identification of metastasis-promoting genes. We demonstrated that 11β-hydroxysteroid dehydrogenase 1 (HSD11β1) and serotonin receptor 2C (HTR2C), the primary targets of adrenosterone and pizotifen, respectively, induced EMT and promoted metastasis of breast cancer cells (Nakayama et al., 2021a, 2021b) (Figure 4).
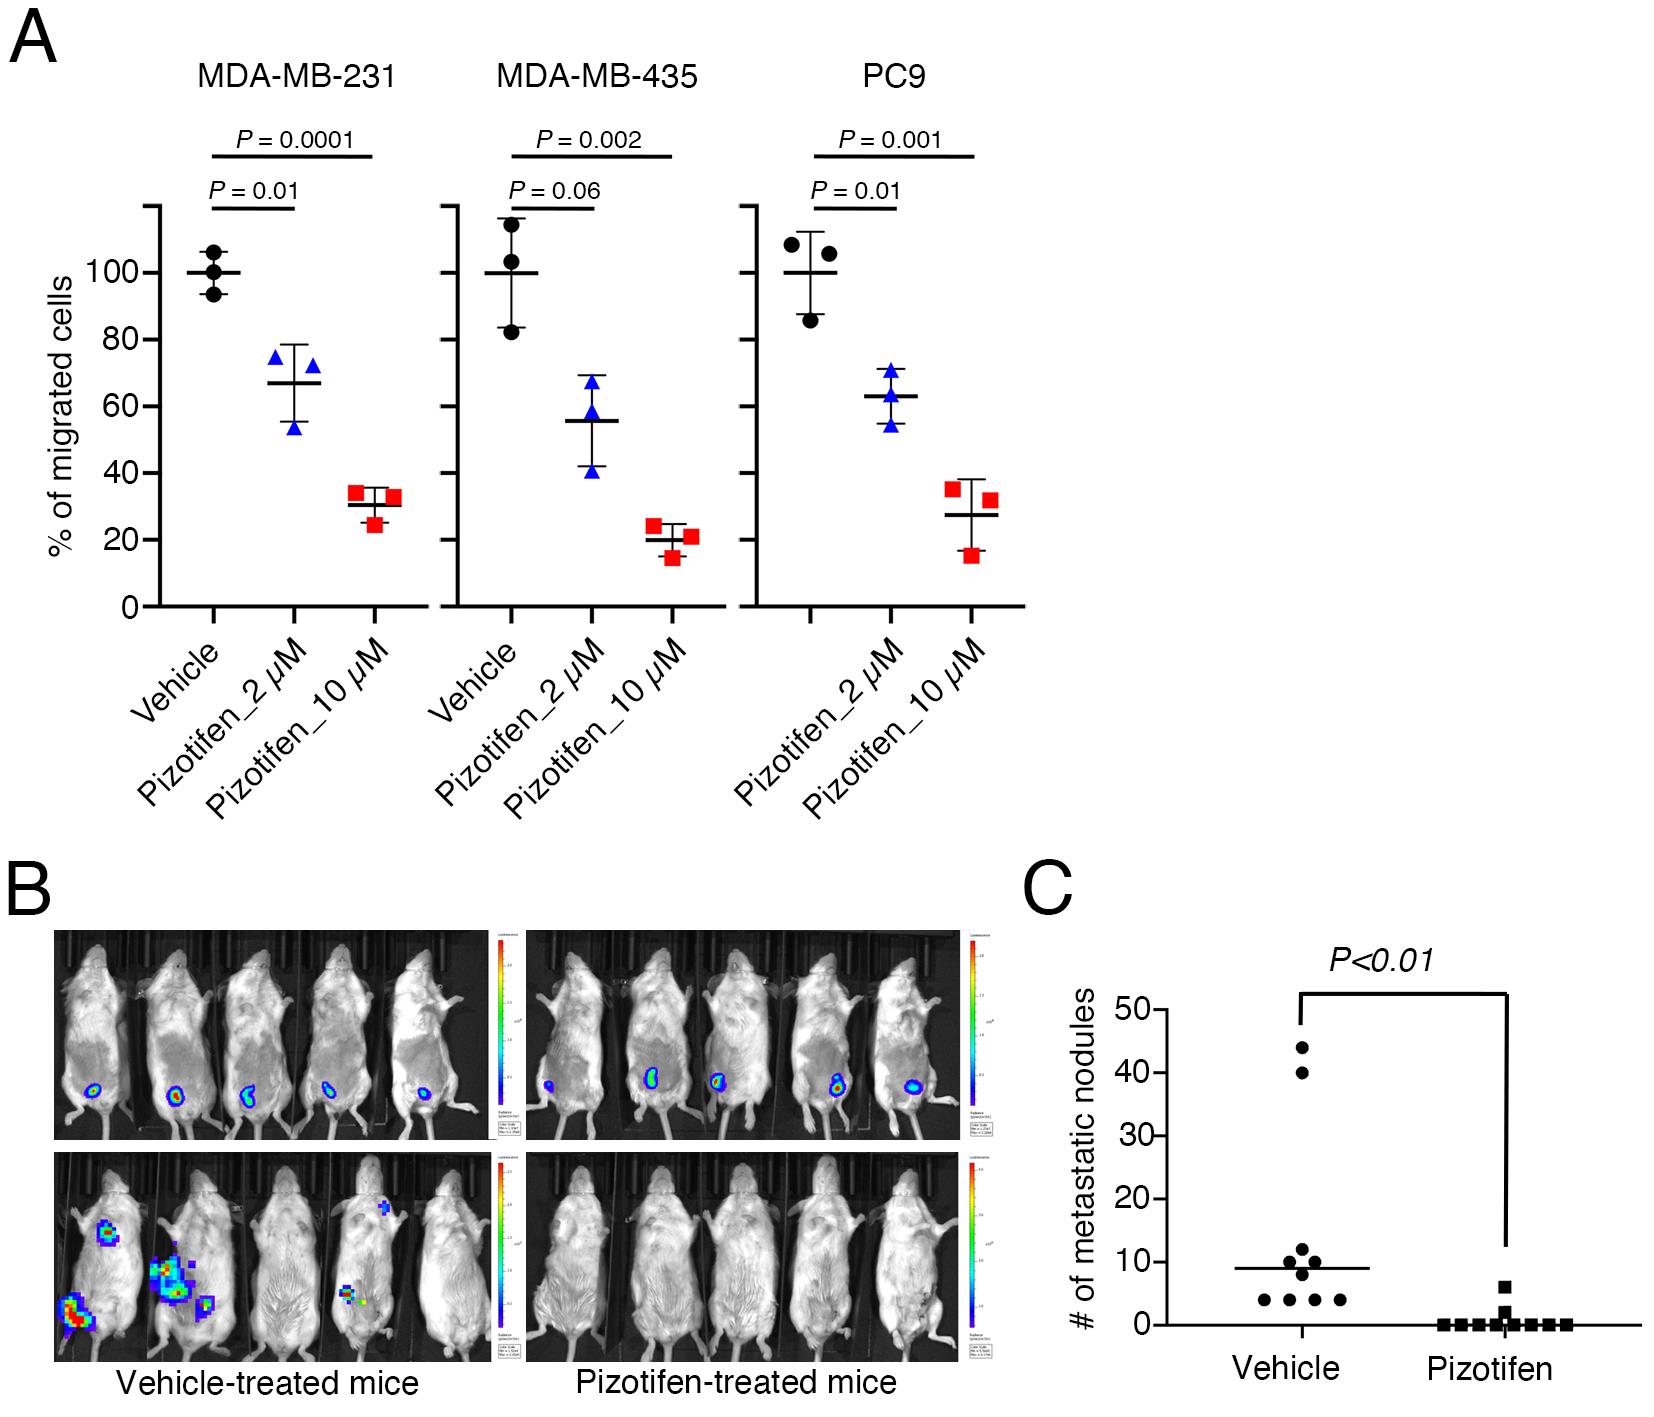
Figure 3. Pizotifen, one of the epiboly-interrupting drugs, suppresses metastatic progression of breast cancer cells in vitro and in vivo. (A) Effect of pizotifen on cell motility and invasion of MBA-MB-231, MDA-MB-435, and PC9 cells. Either vehicle- or pizotifen-treated cells were subjected to Boyden chamber assays. Fetal bovine serum (1% v/v) was used as the chemoattractant in both assays. Each experiment was performed at least twice. (B) Representative images of primary tumors on day 10 post-injection (top panels) and metastatic burden on day 70 post-injection (bottom panels) taken using an IVIS Imaging System. (C) Number of metastatic nodules in the lungs of vehicle- and pizotifen-treated mice.
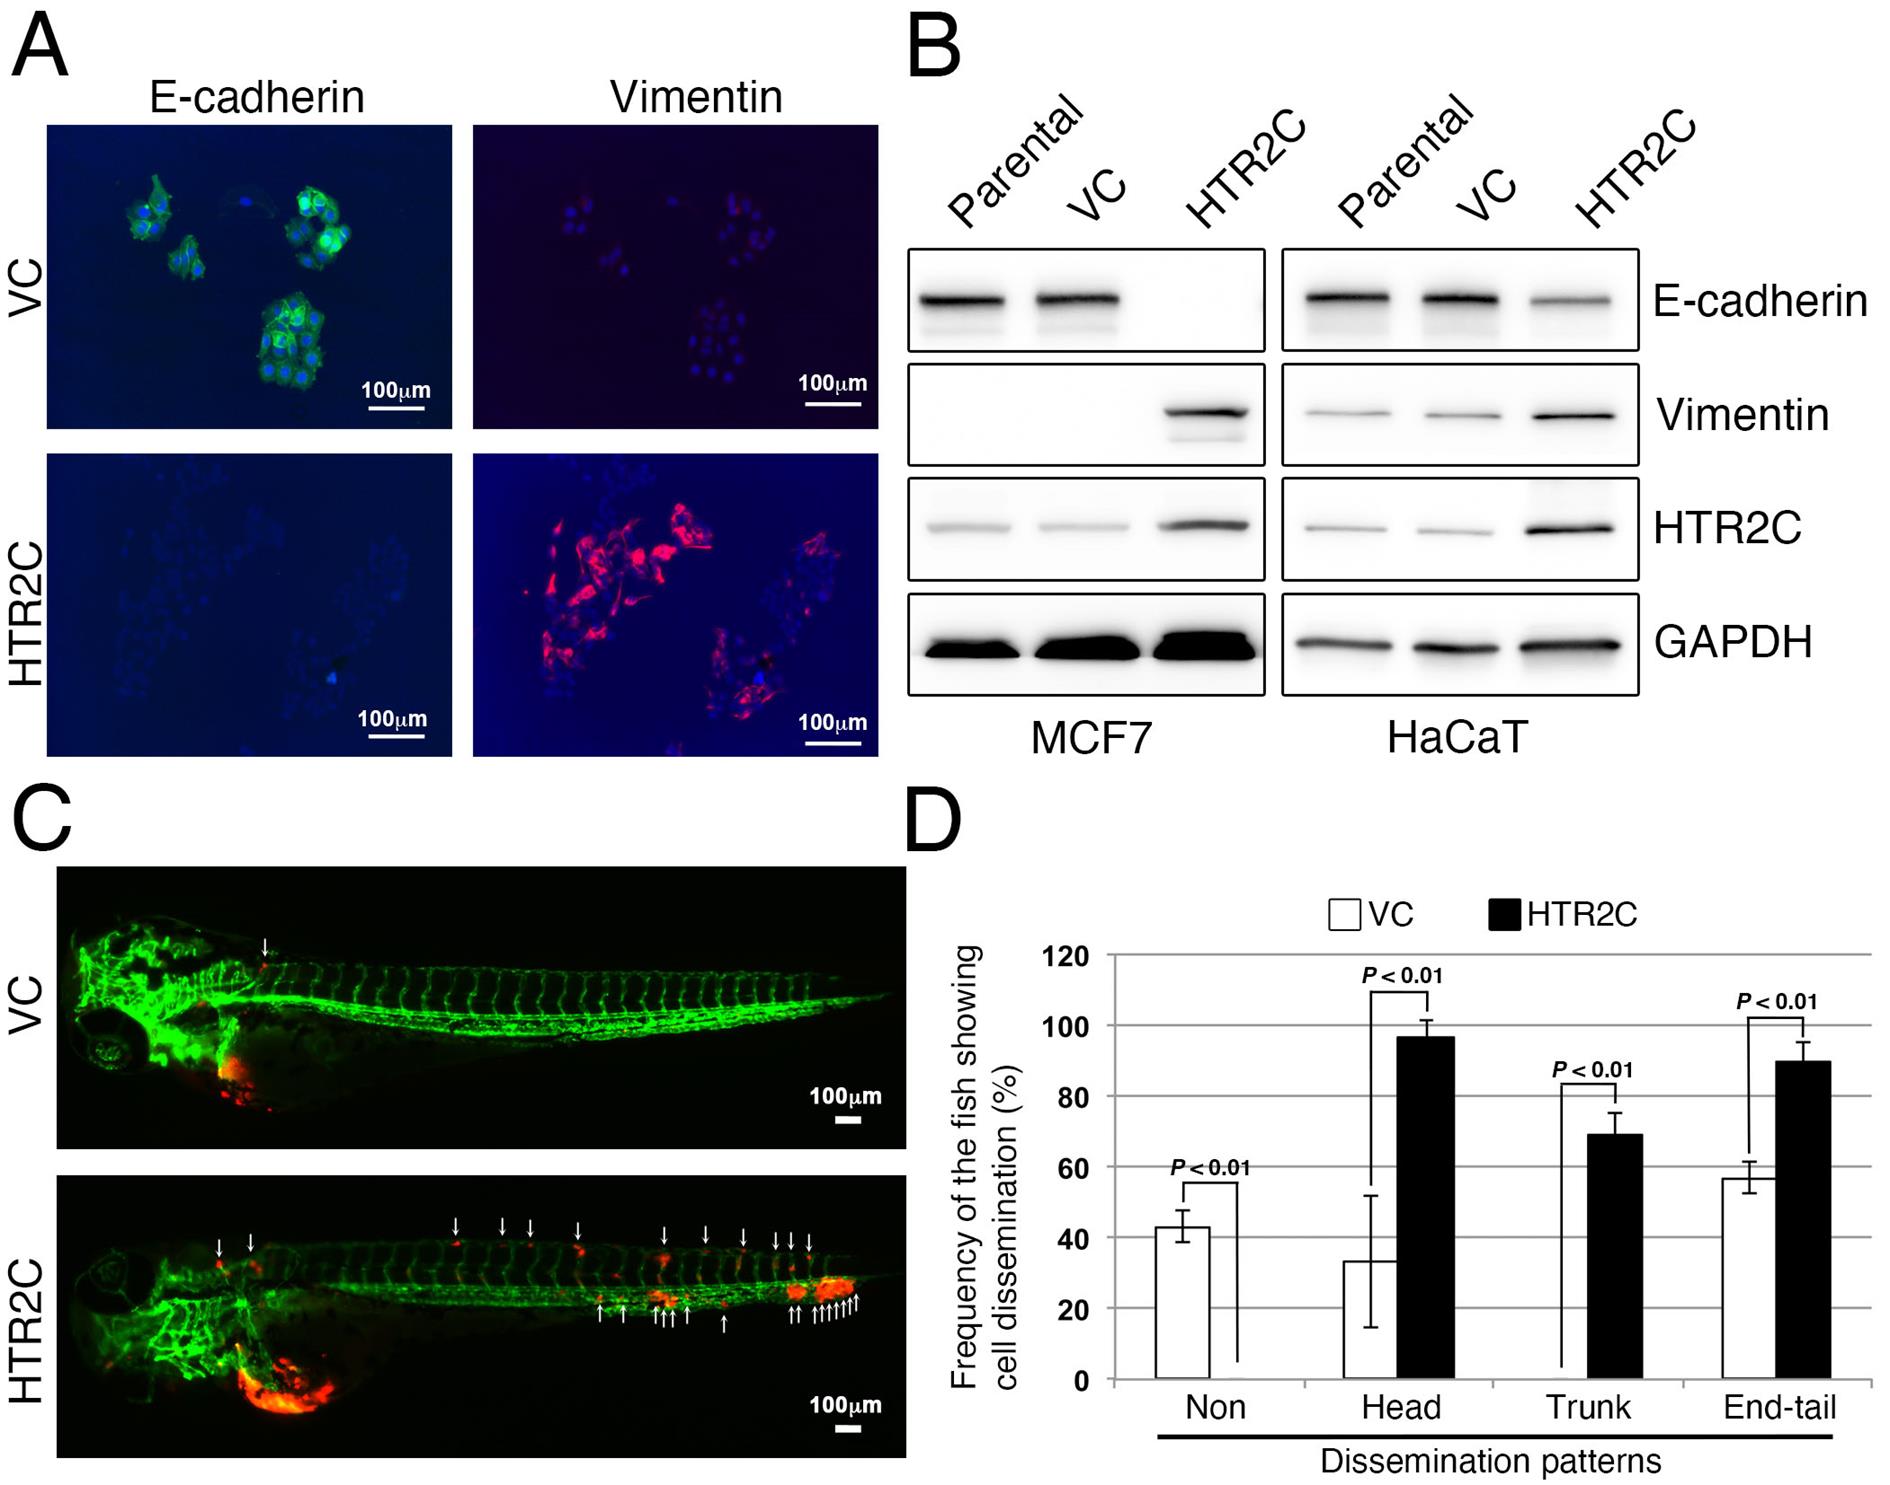
Figure 4. HTR2C, a primary target of pizotifen, induces EMT-mediated metastatic dissemination of human cancer cells. (A) Immunofluorescence staining of E-cadherin and vimentin expressions in the MCF7 cells. (B) Expression of E-cadherin, vimentin, and HTR2C were examined by Western blotting in the MCF7 and HaCaT cells; GAPDH loading control is also shown (bottom). (C) Representative images of dissemination patterns of MCF7 cells expressing either the control vector (top left) or HTR2C (lower left) in a zebrafish xenotransplantation model. White arrowheads indicate disseminated MCF7 cells. (D) Mean frequencies of the fish showing head, trunk, or end-tail dissemination (right). Each value is indicated as the mean ± SEM of two independent experiments. Statistical analysis was determined by Student’s t-test.
Materials and Reagents
150 mm dish (Corning, catalog number: 430599)
24-well flat bottom plastic plates (Corning, catalog number: CLS3473)
Wild-type zebrafish strain (AB line)
Tg (kdrl:eGFP) zebrafish (Provided by Dr. Stainier)
FDA-, EMA-, and other agencies-approved chemical libraries (Prestwick Chemical, Illkirch, France)
Niclosamide (Sigma-Aldrich, catalog number: N3510)
DMSO (Sigma-Aldrich, catalog number: D8418)
Anti-E-cadherin antibody (Cell Signaling Technology, catalog number: 14472)
Anti-vimentin antibody (Cell Signaling Technology, catalog number: 5741)
Anti-HTR2C antibody (Abcam, catalog number: ab133570)
Anti-GAPDH antibody (Cell Signaling Technology, catalog number: 2118)
Human breast cancer cell line MCF7 (ATCC, catalog number: HTB-22)
NaCl (Sigma-Aldrich, catalog number: S3014)
KCl (Sigma-Aldrich, catalog number: P9541)
MgSO4·7H2O (Sigma-Aldrich, catalog number: M2773)
E3 medium (see Recipes)
Equipment
External tank, a part of zebrafish breeding tank (Tecniplast, catalog number: ZB10BTE)
Perforated internal tank, a part of zebrafish breeding tank (Tecniplast, catalog number: ZB10BTI)
Polycarbonate divider, a part of zebrafish breeding tank (Tecniplast, catalog number: ZB10BTD)
Polycarbonate lid (Tecniplast, catalog number: ZB10BTL)
Incubator (AQUALYTIC, catalog number: 2418210)
Stereomicroscope (Leica, catalog number: MZ75)
Procedure
Zebrafish mating setup (Day 0); 10 min
At the night before collecting embryos, arrange pairs of male and female zebrafish separated by a divider (Figure 5).
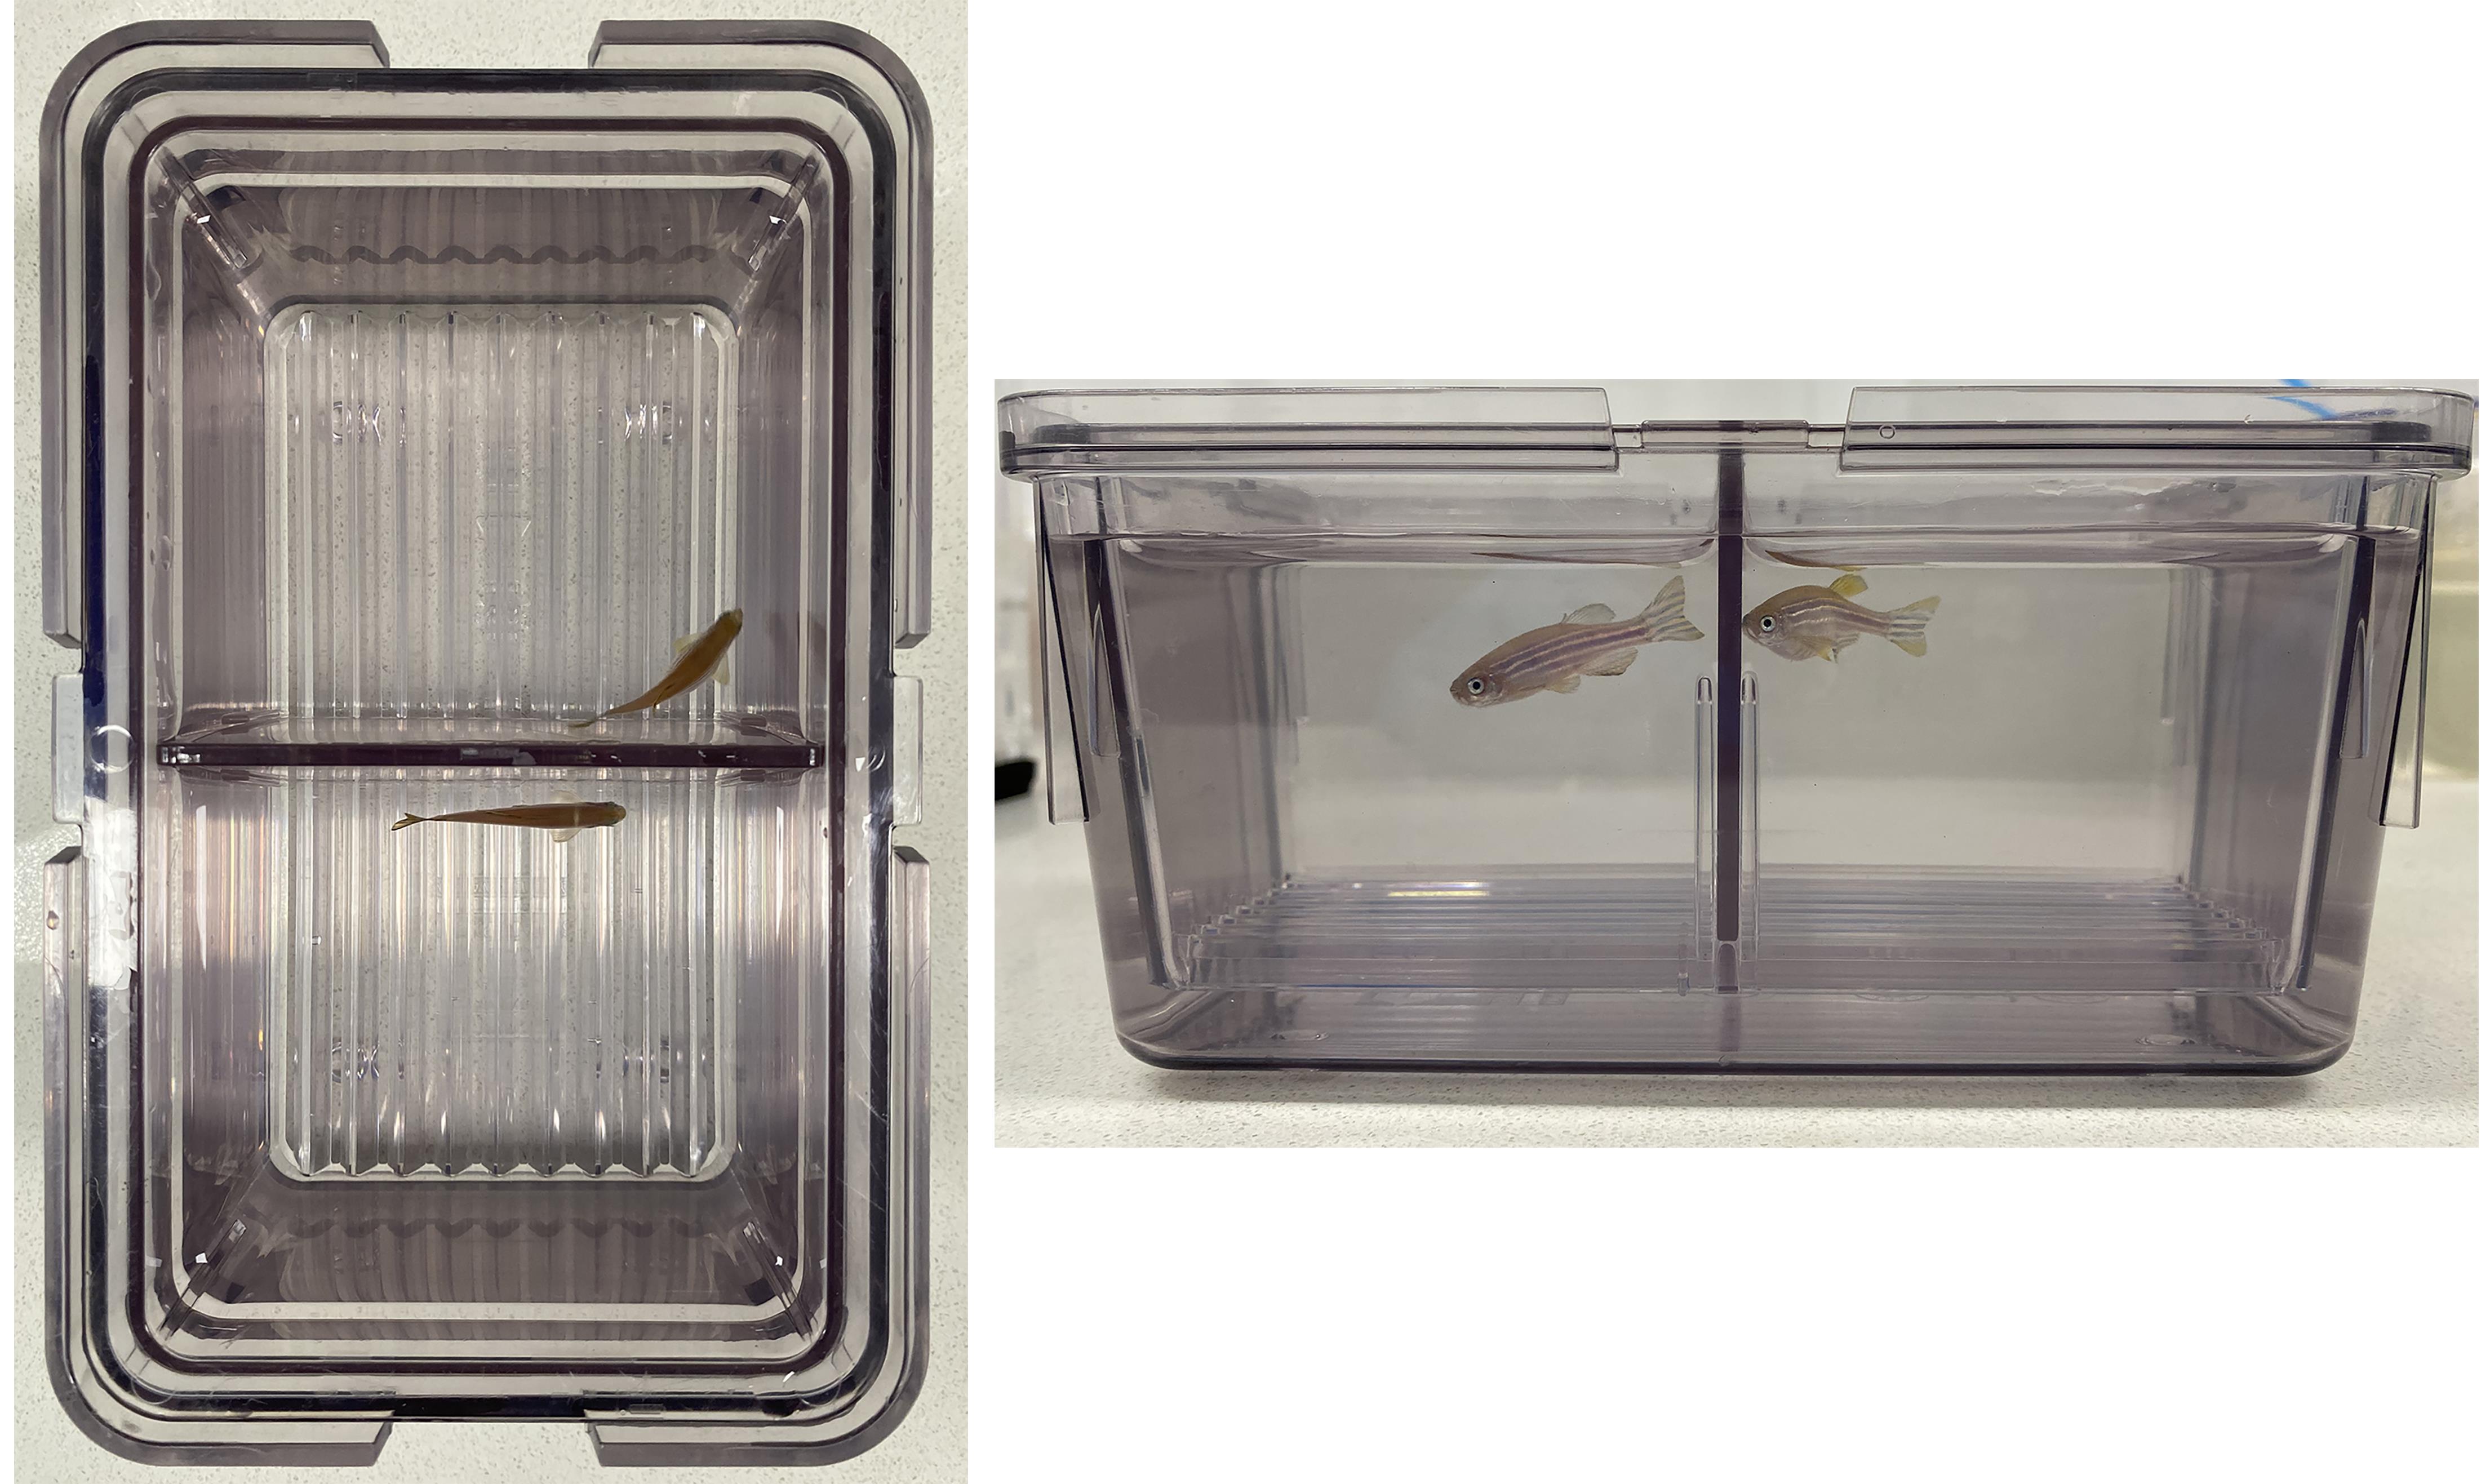
Figure 5. Zebrafish breeding tank with a divider. Male and female zebrafish are separated by a divider which prevents contact for mating. The images are viewed from overhead angle (left) and from the side (right). The divider is then removed, which allows male zebrafish to contact female zebrafish for mating.Note: Young adult zebrafish (3–9 months old) should be used for the crossing. The quality of zebrafish embryos affects screening efficiency (critical step). Water temperature is 27 °C. Duration of sunshine is set from 7:00 to 19:00.
Embryo collection and distribution (Day 1); 80 min
Remove the divider to allow the fish to spawn in the morning (7:00–10:00).
Allow crossing for 10 min to obtain zebrafish embryos of the same developmental stage. For example, if more than 20 chemicals are tested, the crossing might be performed three times at three different time points (Group A: 8:30, Group B: 9:00, and Group C: 9:30).
For example, a 60-drug screening would require approximately 1,300 embryos if each drug needs to be tested at one concentration:
Group A: 20 (embryos) × 1 (concentration) × 30 (drugs) + 20 (vehicle control) + 20 (positive control).
Group B: 20 (embryos) × 1 (concentration) × 30 (drugs) + 20 (vehicle control) + 20 (positive control).
Similarly, if each drug needs to be tested at two concentrations, approximately 2,600 embryos would be required:
Group A: 20 (embryos) × 2 (concentrations) × 30 (drugs) + 40 (vehicle controls) + 20 (positive control).
Group B: 20 (embryos) × 2 (concentrations) × 30 (drugs) + 40 (vehicle controls) + 20 (positive control).
After 10 min, replace the divider to prevent the zebrafish from spawning.
Note: This screen measures the suppressor effect of each chemical on the progression of epiboly in live zebrafish embryos. Therefore, epiboly proceeds while the researcher is measuring the effect under a stereoscopic microscope. If more than 20 chemicals need to be tested, the screening should be divided into more than two sessions, and each of the sessions should start at a different time point. For example, if 60 chemicals need to be tested, zebrafish should be crossed at three different time points that are over 30 min apart. That allows 30 min for measuring the effects (critical step).
Collect the embryos in 150 mm dishes containing E3 medium and remove dead embryos.
Incubate the embryos at 27 °C for 20 min.
Collect two-cell stage embryos under the stereoscopic microscope.
Note: This step has limited throughput. The collection of zebrafish embryos should be completed during the two-cell stage. Thus, 900–1,200 embryos at the two-cell stage would be the upper limit for one researcher.
Array approximately 20 embryos into each well of a 24-well plate.
Remove E3 medium from each well by using a pipet.
Add 900 µL of E3 medium to each well.
Embryo development to the sphere stage; 4 h
Incubate the embryos at 27 °C until they develop to the sphere stage
Note: The temperature of the E3 medium affects the development rate of zebrafish embryos. Higher temperatures accelerate the development rate; conversely, lower temperatures slow it down (Urushibata et al., 2021). Therefore, a non-uniform temperature in each well of a 24-well plate can cause false positives (critical step).
Addition of chemicals; 30 min
Prepare a 10-fold concentration of each chemical in E3 medium 30 min before adding the chemicals to the embryos.
Note: After preparing the respective 10-fold concentration of the media, the medium should be stored at 27 °C.
When the embryos develop to the sphere stage, add 100 µL of the respective 10-fold media to the wells.
For example, a 60-drug screening is divided into three groups:
The first set of 20 test chemicals, as well as niclosamide and DMSO as positive and negative controls, are added into group A when embryos from group A develop to the sphere stage.
The second set of 20 test chemicals, niclosamide, and DMSO are added into group B when embryos from group B develop to the sphere stage.
The last set of 20 test chemicals, niclosamide, and DMSO are added into group C when embryos from group C develop to the sphere stage.
Development of DMSO-treated embryos to the 90% epiboly stage; 5 h
After adding the test chemicals, incubate the embryos at 27 °C for approximately 5 h.
Note: The temperature of the E3 medium affects the development rate of zebrafish embryos. Non-uniform temperature in each well of a 24-well plate would cause false positives (critical step).
Measuring the inhibition effects of each chemical; 30 min
Compare the epiboly progression of chemical-treated embryos from group A and DMSO-treated embryos under the stereoscopic microscope, when the DMSO-treated embryos develop to the 90% epiboly stage.
Note: This step has limited throughput. Comparisons should be completed before DMSO-treated embryos at the 90% epiboly stage develop to the next development stage. Thus, 20–30 chemicals would be the upper limit for one researcher.
Compare the epiboly progression of chemical-treated embryos from group B and DMSO-treated embryos under the stereoscopic microscope, when the DMSO-treated embryos develop to the 90% epiboly stage.
Compare the epiboly progression of chemical-treated embryos from group C and DMSO-treated embryos under the stereoscopic microscope, when the DMSO-treated embryos develop to the 90% epiboly stage.
Note: Epiboly proceeds while a researcher is comparing the epiboly progression of chemical-treated and DMSO-treated embryos under the stereoscopic microscope. Therefore, measuring the effect should be completed in 30 mins (critical step). To confirm the reproducibility of whether 'hit' chemicals could interrupt the epiboly progression of zebrafish embryos, further testing on subsequent day is advised (critical step).
Data analysis
This screen measures the suppressor effect of chemicals based on the epiboly progression of zebrafish embryos. Niclosamide and DMSO can be used as positive and negative controls, respectively. Epiboly progression of chemical-treated embryos is compared with that of DMSO-treated embryos under a stereoscopic microscope, allowing positive ‘hit’ chemicals that interrupt epiboly progression to be selected (Figure 2) (Nakayama et al., 2021b, 2022).
Limitations
Throughput in steps 7 and 15, determine how many chemicals can be tested in one screening session. In step 7, the collection of zebrafish embryos should be completed during the two-cell stage and before the four-cell stage. Thus, 900–1,200 embryos at the two-cell stage would be the upper limit for one researcher. In step 15, comparing epiboly progression of each chemical-treated embryo with DMSO-treated embryos under the stereoscopic microscope should be completed before DMSO-treated embryos at the 90% epiboly stage develop to the next stage. Thus, 20–30 chemicals would be the upper limit for one researcher.
In addition, there are some limitations regarding chemical deliverance to zebrafish embryos. These are surrounded by the acellular chorion, which is known to be approximately 1.5–2.5 µm thick and to consist of three layers pierced by pore canals. The pore allows passage of water, ions, and chemicals. A study reported that molecules larger than 3–4 KDa fail to pass through the chorion. Therefore, this screen may not be able to measure the suppressor effect of molecules larger than 3–4 KDa (Pelka et al., 2017).
Troubleshooting
The quality of zebrafish embryos affects screening efficiency. For example, low-quality embryos show high frequencies of asymmetric cell cleavage, and their development is arrested at early cleavage stages (Yilmaz et al., 2017). If a screen used low-quality zebrafish embryos, it would generate false ‘hit’ chemicals since the suppressor effect of a test chemical is measured by observing the epiboly progression of chemical-treated embryos. If the number of zebrafish embryos showing morphological abnormalities correlate with the final concentration of a test chemical, those embryo abnormalities may result from the effect of the test chemical.
Anticipated results
Suppressor effects of a tested chemical on the epiboly progression of zebrafish embryos are significantly affected by the final concentration of the chemical. A previous study subjected 1,280 FDA-approved drugs to this screen and showed that 6% (78/1,280) of the tested drugs affected epiboly progression of the embryos treated with 10 μM. Out of these 78 epiboly-interrupting drugs, 25% of the drugs succeeded in suppressing cell motility and invasion of highly metastatic human cancer cells in a Boyden chamber assay. In contrast, epiboly progression was affected more severely when the embryos were treated at 50 μM, by 10.3% (132/1,280) of the tested drugs. From these, 85% (112/132) failed to suppress cell motility and invasion of highly metastatic human cancer cells in a Boyden chamber assay (Nakayama et al., 2021b).
Recipes
E3 medium
5.0 mM NaCl, 0.17 mM KCl, 0.33 mM MgSO4
Reagent Final concentration Amount NaCl 5.0 mM KCl 0.17 mM MgSO4 0.33 mM H2O n/a 1,000 mL
Acknowledgments
Figure 1 was drawn by Ami Inoue (Kyoto University of the Arts). Pictures of zebrafish mating tank with a divider were taken by Dr. Li Yan (National University of Singapore). This study was funded by grants from National Medical Research Council of Singapore (R-154000547511) and Ministry of Education of Singapore (R-154000A23112 and R154000B88112) to ZG. Experiments using mice were supported in part by research funds from the Yamagata prefectural government and the City of Tsuruoka. This screen protocol was used in previous research (Nakayama et al., 2021a, 2021b, 2022).
Competing interests
J.N., H.M., and Z.G. declare no conflict of interest.
Ethics
The study protocol using zebrafish was approved by the Institutional Animal Care and Use Committee of the National University of Singapore (protocol number: R16-1068). The study protocol using mice (protocol number: BRC IACUC #110612) was approved by A*STAR (Agency for Science, Technology and Research, Singapore).
References
- Abdulghani, J., Gu, L., Dagvadorj, A., Lutz, J., Leiby, B., Bonuccelli, G., Lisanti, M. P., Zellweger, T., Alanen, K., Mirtti, T., et al. (2008). Stat3 promotes metastatic progression of prostate cancer. Am J Pathol 172(6): 1717-1728.
- Bakkers, J., Kramer, C., Pothof, J., Quaedvlieg, N. E., Spaink, H. P. and Hammerschmidt, M. (2004). Has2 is required upstream of Rac1 to govern dorsal migration of lateral cells during zebrafish gastrulation. Development 131(3): 525-537.
- Barraclough, J., Hodgkinson, C., Hogg, A., Dive, C. and Welman, A. (2007). Increases in c-Yes Expression Level and Activity Promote Motility But Not Proliferation of Human Colorectal Carcinoma Cells. Neoplasia 9(9): 745-IN732.
- Batlle, E., Sancho, E., Francí, C., Domínguez, D. and Monfar, M. (2000). The transcription factor snail is a repressor of E-cadherin gene expression in epithelial tumour cells. Nat Cell Biol 2(2): 84-89.
- Besser, J., Leito, J. T., van der Meer, D. L. and Bagowski, C. P. (2007). Tip-1 induces filopodia growth and is important for gastrulation movements during zebrafish development. Dev Growth Differ 49(3): 205-214.
- Castanon, I. and Baylies, M. K. (2002). A Twist in fate: evolutionary comparison of Twist structure and function. Gene 287(1-2): 11-22.
- Cha, Y. I., Kim, S. H., Sepich, D., Buchanan, F. G., Solnica-Krezel, L. and DuBois, R. N. (2006). Cyclooxygenase-1-derived PGE2 promotes cell motility via the G-protein-coupled EP4 receptor during vertebrate gastrulation. Genes Dev 20(1): 77-86.
- Chaffer, C. L. and Weinberg, R. A. (2011). A perspective on cancer cell metastasis. Science 331(6024): 1559-1564.
- Chen, M. W., Hua, K. T., Kao, H. J., Chi, C. C., Wei, L. H., Johansson, G., Shiah, S. G., Chen, P. S., Jeng, Y. M., Cheng, T. Y., et al. (2010). H3K9 histone methyltransferase G9a promotes lung cancer invasion and metastasis by silencing the cell adhesion molecule Ep-CAM. Cancer Res 70(20): 7830-7840.
- Choi, S. C. and Han, J. K. (2002). Xenopus Cdc42 regulates convergent extension movements during gastrulation through Wnt/Ca2+ signaling pathway. Dev Biol 244(2): 342-357.
- Coyle, R. C., Latimer, A. and Jessen, J. R. (2008). Membrane-type 1 matrix metalloproteinase regulates cell migration during zebrafish gastrulation: evidence for an interaction with non-canonical Wnt signaling. Exp Cell Res 314(10): 2150-2162.
- Dai, X., Ge, J., Wang, X., Qian, X., Zhang, C. and Li, X. (2013). OCT4 regulates epithelial-mesenchymal transition and its knockdown inhibits colorectal cancer cell migration and invasion. Oncol Rep 29(1): 155-160.
- Damm, E. W. and Winklbauer, R. (2011). PDGF-A controls mesoderm cell orientation and radial intercalation during Xenopus gastrulation. Development 138(3): 565-575.
- Dongre, A. and Weinberg, R. A. (2019). New insights into the mechanisms of epithelial-mesenchymal transition and implications for cancer. Nat Rev Mol Cell Biol 20(2): 69-84.
- Faure, S., Cau, J., de Santa Barbara, P., Bigou, S., Ge, Q., Delsert, C. and Morin, N. (2005). Xenopus p21-activated kinase 5 regulates blastomeres' adhesive properties during convergent extension movements. Dev Biol 277(2): 472-492.
- Felding-Habermann, B. (2003). Integrin adhesion receptors in tumor metastasis. Clin Exp Metastasis 20(3): 203-213.
- Fernando, R. I., Litzinger, M., Trono, P., Hamilton, D. H., Schlom, J. and Palena, C. (2010). The T-box transcription factor Brachyury promotes epithelial-mesenchymal transition in human tumor cells. J Clin Invest 120(2): 533-544.
- Gong, W., An, Z., Wang, Y., Pan, X., Fang, W., Jiang, B. and Zhang, H. (2009). P21-activated kinase 5 is overexpressed during colorectal cancer progression and regulates colorectal carcinoma cell adhesion and migration. Int J Cancer 125(3): 548-555.
- Gunaratne, A., Thai, B. L. and Di Guglielmo, G. M. (2013). Atypical protein kinase C phosphorylates Par6 and facilitates transforming growth factor beta-induced epithelial-to-mesenchymal transition. Mol Cell Biol 33(5): 874-886.
- Guo, B. H., Feng, Y., Zhang, R., Xu, L. H., Li, M. Z., Kung, H. F., Song, L. B. and Zeng, M. S. (2011). Bmi-1 promotes invasion and metastasis, and its elevated expression is correlated with an advanced stage of breast cancer. Mol Cancer 10(1): 10.
- Habas, R., Dawid, I. B. and He, X. (2003). Coactivation of Rac and Rho by Wnt/Frizzled signaling is required for vertebrate gastrulation. Genes Dev 17(2): 295-309.
- Han, M., Wang, H., Zhang, H. T. and Han, Z. (2012). The PDZ protein TIP-1 facilitates cell migration and pulmonary metastasis of human invasive breast cancer cells in athymic mice. Biochem Biophys Res Commun 422(1): 139-145.
- Hartwell, K. A., Muir, B., Reinhardt, F., Carpenter, A. E., Sgroi, D. C. and Weinberg, R. A. (2006). The Spemann organizer gene, Goosecoid, promotes tumor metastasis. Proc Natl Acad Sci U S A 103(50): 18969-18974.
- Holloway, B. A., Gomez de la Torre Canny, S., Ye, Y., Slusarski, D. C., Freisinger, C. M., Dosch, R., Chou, M. M., Wagner, D. S. and Mullins, M. C. (2009). A novel role for MAPKAPK2 in morphogenesis during zebrafish development. PLoS Genet 5(3): e1000413.
- Hong, S. K., Tanegashima, K. and Dawid, I. B. (2011). XIer2 is required for convergent extension movements during Xenopus development. Int J Dev Biol 55(10-12): 917-921.
- Iioka, H., Ueno, N. and Kinoshita, N. (2004). Essential role of MARCKS in cortical actin dynamics during gastrulation movements. J Cell Biol 164(2): 169-174.
- Ip, Y. T. and Gridley, T. (2002). Cell movements during gastrulation: snail dependent and independent pathways. Curr Opin Genet Dev 12(4): 423-429.
- Itoh, K., Yoshioka, K., Akedo, H., Uehata, M., Ishizaki, T. and Narumiya, S. (1999). An essential part for Rho-associated kinase in the transcellular invasion of tumor cells. Nat Med 5(2): 221-225.
- Jechlinger, M., Sommer, A., Moriggl, R., Seither, P., Kraut, N., Capodiecci, P., Donovan, M., Cordon-Cardo, C., Beug, H. and Grunert, S. (2006). Autocrine PDGFR signaling promotes mammary cancer metastasis. J Clin Invest 116(6): 1561-1570.
- Jopling, C., van Geemen, D. and den Hertog, J. (2007). Shp2 knockdown and Noonan/LEOPARD mutant Shp2-induced gastrulation defects. PLoS Genet 3(12): e225.
- Katsuno, Y., Hanyu, A., Kanda, H., Ishikawa, Y., Akiyama, F., Iwase, T., Ogata, E., Ehata, S., Miyazono, K. and Imamura, T. (2008). Bone morphogenetic protein signaling enhances invasion and bone metastasis of breast cancer cells through Smad pathway. Oncogene 27(49): 6322-6333.
- Khanna, C., Wan, X., Bose, S., Cassaday, R., Olomu, O., Mendoza, A., Yeung, C., Gorlick, R., Hewitt, S. M. and Helman, L. J. (2004). The membrane-cytoskeleton linker ezrin is necessary for osteosarcoma metastasis. Nat Med 10(2): 182-186.
- Kim, H. R., Wheeler, M. A., Wilson, C. M., Iida, J., Eng, D., Simpson, M. A., McCarthy, J. B. and Bullard, K. M. (2004). Hyaluronan facilitates invasion of colon carcinoma cells in vitro via interaction with CD44. Cancer Res 64(13): 4569-4576.
- Kondo, M. (2007). Bone morphogenetic proteins in the early development of zebrafish. FEBS J 274(12): 2960-2967.
- Krens, S. F., He, S., Lamers, G. E., Meijer, A. H., Bakkers, J., Schmidt, T., Spaink, H. P. and Snaar-Jagalska, B. E. (2008). Distinct functions for ERK1 and ERK2 in cell migration processes during zebrafish gastrulation. Dev Biol 319(2): 370-383.
- Kumar, B., Koul, S., Petersen, J., Khandrika, L., Hwa, J. S., Meacham, R. B., Wilson, S. and Koul, H. K. (2010). p38 mitogen-activated protein kinase-driven MAPKAPK2 regulates invasion of bladder cancer by modulation of MMP-2 and MMP-9 activity. Cancer Res 70(2): 832-841.
- Kundu, N. and Fulton, A. M. (2002). Selective cyclooxygenase (COX)-1 or COX-2 inhibitors control metastatic disease in a murine model of breast cancer. Cancer Res 62(8): 2343-2346.
- Kusakabe, M. and Nishida, E. (2004). The polarity-inducing kinase Par-1 controls Xenopus gastrulation in cooperation with 14-3-3 and aPKC. EMBO J 23(21): 4190-4201.
- Lachnit, M., Kur, E. and Driever, W. (2008). Alterations of the cytoskeleton in all three embryonic lineages contribute to the epiboly defect of Pou5f1/Oct4 deficient MZspg zebrafish embryos. Dev Biol 315(1): 1-17.
- Latinkic, B. V. (2003). Xenopus Cyr61 regulates gastrulation movements and modulates Wnt signalling. Development 130(11): 2429-2441.
- Lin, F., Sepich, D. S., Chen, S., Topczewski, J., Yin, C., Solnica-Krezel, L. and Hamm, H. (2005). Essential roles of G{alpha}12/13 signaling in distinct cell behaviors driving zebrafish convergence and extension gastrulation movements. J Cell Biol 169(5): 777-787.
- Lin, J., Huo, R., Wang, L., Zhou, Z., Sun, Y., Shen, B., Wang, R. and Li, N. (2012). A novel anti-Cyr61 antibody inhibits breast cancer growth and metastasis in vivo. Cancer Immunol Immunother 61(5): 677-687.
- Link, V., Carvalho, L., Castanon, I., Stockinger, P., Shevchenko, A. and Heisenberg, C. P. (2006). Identification of regulators of germ layer morphogenesis using proteomics in zebrafish. J Cell Sci 119(Pt 10): 2073-2083.
- Liu, W., Su, L. T., Khadka, D. K., Mezzacappa, C., Komiya, Y., Sato, A., Habas, R. and Runnels, L. W. (2011). TRPM7 regulates gastrulation during vertebrate embryogenesis. Dev Biol 350(2): 348-357.
- Lu, W. and Kang, Y. (2019). Epithelial-Mesenchymal Plasticit in Cancer Progression and Metastasis. Developmental Cell 49(3): 361-374.
- Lu, Z., Jiang, G., Blume-Jensen, P. and Hunter, T. (2001). Epidermal growth factor-induced tumor cell invasion and metastasis initiated by dephosphorylation and downregulation of focal adhesion kinase. Mol Cell Biol 21(12): 4016-4031.
- Lue, H. W., Yang, X., Wang, R., Qian, W., Xu, R. Z., Lyles, R., Osunkoya, A. O., Zhou, B. P., Vessella, R. L., Zayzafoon, M., et al. (2011). LIV-1 promotes prostate cancer epithelial-to-mesenchymal transition and metastasis through HB-EGF shedding and EGFR-mediated ERK signaling. PLoS One 6(11): e27720.
- Lynch, T. P., Ferrer, C. M., Jackson, S. R., Shahriari, K. S., Vosseller, K. and Reginato, M. J. (2012). Critical role of O-Linked beta-N-acetylglucosamine transferase in prostate cancer invasion, angiogenesis, and metastasis. J Biol Chem 287(14): 11070-11081.
- Machingo, Q. J., Fritz, A. and Shur, B. D. (2006). A beta1,4-galactosyltransferase is required for convergent extension movements in zebrafish. Dev Biol 297(2): 471-482.
- MacRae, C. A. and Peterson, R. T. (2015). Zebrafish as tools for drug discovery. Nature REVIEWS 14: 721-731.
- Malik, G., Knowles, L. M., Dhir, R., Xu, S., Yang, S., Ruoslahti, E. and Pilch, J. (2010). Plasma fibronectin promotes lung metastasis by contributions to fibrin clots and tumor cell invasion. Cancer Res 70(11): 4327-4334.
- Mani, S. A., Yang, J., Brooks, M., Schwaninger, G., Zhou, A., Miura, N., Kutok, J. L., Hartwell, K., Richardson, A. L. and Weinberg, R. A. (2007). Mesenchyme Forkhead 1 (FOXC2) plays a key role in metastasis and is associated with aggressive basal-like breast cancers. Proc Natl Acad Sci U S A 104(24): 10069-10074.
- Marlow, F., Topczewski, J., Sepich, D. and Solnica-Krezel, L. (2002). Zebrafish Rho kinase 2 acts downstream of Wnt11 to mediate cell polarity and effective convergence and extension movements. Curr Biol 12(11): 876-884.
- Marsden, M. and DeSimone, D. W. (2003). Integrin-ECM Interactions Regulate Cadherin-Dependent Cell Adhesion and Are Required for Convergent Extension in Xenopus. Current Biology 13(14): 1182-1191.
- Medici, D., Hay, E. D. and B.R., O. (2008). Snail and Slug Promote Epithelial-Mesenchymal Transition through -Catenin–T-Cell Factor-4-dependent Expression of Transforming Growth Factor-3. Mol Biol Cell 19(11): 4875-4887.
- Middelbeek, J., Kuipers, A. J., Henneman, L., Visser, D., Eidhof, I., van Horssen, R., Wieringa, B., Canisius, S. V., Zwart, W., Wessels, L. F., et al. (2012). TRPM7 is required for breast tumor cell metastasis. Cancer Res 72(16): 4250-4261.
- Miyagi, C., Yamashita, S., Ohba, Y., Yoshizaki, H., Matsuda, M. and Hirano, T. (2004). STAT3 noncell-autonomously controls planar cell polarity during zebrafish convergence and extension. J Cell Biol 166(7): 975-981.
- Mizoguchi, T., Verkade, H., Heath, J. K., Kuroiwa, A. and Kikuchi, Y. (2008). Sdf1/Cxcr4 signaling controls the dorsal migration of endodermal cells during zebrafish gastrulation. Development 135(15): 2521-2529.
- Montero, J.-A., Kilian, B., Chan, J., Bayliss, P. E. and Heisenberg, C.-P. (2003). Phosphoinositide 3-Kinase Is Required for Process Outgrowth and Cell Polarization of Gastrulating Mesendodermal Cells. Curr Biol 13(15): 1279-1289.
- Nakayama, J. and Gong, Z. (2020). Transgenic zebrafish for modeling hepatocellular carcinoma. MedComm 1(2): 146-156.
- Nakayama, J., Konno, Y., Maruyama, A., Tomita, M. and Makinoshima, H. (2022). Cinnamon bark extract suppresses metastatic dissemination of cancer cells through inhibition of glycolytic metabolism. J Nat Med 76(3): 686-692.
- Nakayama, J. and Makinoshima, H. (2020). Zebrafish-Based Screening Models for the Identification of Anti-Metastatic Drugs. Molecules 25(10): 2407.
- Nakayama, J., Maruyama, A., Ishikawa, T., Nishimura, T., Yamanaka, S., Gotoh, N., Yamauchi, C., Onishi, T., Soga, T., Fujii, S., et al. (2021a). HSD11β1 promotes EMT-mediated breast cancer metastasis. bioRxiv doi: https://doi.org/10.1101/2021.09.27.461934
- Nakayama, J., Tan, L., Li, Y., Goh, B. C., Wang, S., Makinoshima, H. and Gong, Z. (2021b). A zebrafish embryo screen utilizing gastrulation identifies the HTR2C inhibitor pizotifen as a suppressor of EMT-mediated metastasis. Elife 10: e70151.
- Nakayama., J., Lu., J.-W., Makinoshima., H. and Gong., Z. (2020). A Novel Zebrafish Model of Metastasis Identifies the HSD11β1 Inhibitor Adrenosterone as a Suppressor of Epithelial-Mesenchymal Transition and Metastatic Dissemination. Mol Cancer Res 18(3): 477-487.
- Neeb, A., Wallbaum, S., Novac, N., Dukovic-Schulze, S., Scholl, I., Schreiber, C., Schlag, P., Moll, J., Stein, U. and Sleeman, J. P. (2012). The immediate early gene Ier2 promotes tumor cell motility and metastasis, and predicts poor survival of colorectal cancer patients. Oncogene 31(33): 3796-3806.
- Nguyen., D. X., Bos., P. D. and Massagué., J. (2009). Metastasis: from dissemination to organ-specific colonization. Nat Rev Cancer 9(4): 274-284.
- Ni, J., Cozzi, P. J., Duan, W., Shigdar, S., Graham, P. H., John, K. H. and Li, Y. (2012). Role of the EpCAM (CD326) in prostate cancer metastasis and progression. Cancer Metastasis Rev 31(3-4): 779-791.
- Nieto, M. A., Huang, R. Y.-J., Jackson, R. A. and Thiery, J. P. (2016). EMT: 2016. Cell 166(1): 21-45.
- Nomura, S., Yoshitomi, H., Takano, S., Shida, T., Kobayashi, S., Ohtsuka, M., Kimura, F., Shimizu, H., Yoshidome, H., Kato, A., et al. (2008). FGF10/FGFR2 signal induces cell migration and invasion in pancreatic cancer. Br J Cancer 99(2): 305-313.
- O'Carroll, D., Erhardt, S., Pagani, M., Barton, S. C., Surani, M. A. and Jenuwein, T. (2001). The polycomb-group gene Ezh2 is required for early mouse development. Mol Cell Biol 21(13): 4330-4336.
- Pelka, K. E., Henn, K., Keck, A., Sapel, B. and Braunbeck, T. (2017). Size does matter – Determination of the critical molecular size for the uptake of chemicals across the chorion of zebrafish (Danio rerio) embryos. Aquatic Toxicology 185: 1-10.
- Perentes, J. Y., Kirkpatrick, N. D., Nagano, S., Smith, E. Y., Shaver, C. M., Sgroi, D., Garkavtsev, I., Munn, L. L., Jain, R. K. and Boucher, Y. (2011). Cancer cell-associated MT1-MMP promotes blood vessel invasion and distant metastasis in triple-negative mammary tumors. Cancer Res 71(13): 4527-4538.
- Radtke, S., Milanovic, M. and Rossé, C. (2013). ERK2 but not ERK1 mediates HGF-induced motility in non-small cell lung carcinoma cell lines. J Cell Sci 126(Pt11): 2381-2391.
- Ren, G., Baritaki, S., Marathe, H., Feng, J., Park, S., Beach, S., Bazeley, P. S., Beshir, A. B., Fenteany, G., Mehra, R., et al. (2012). Polycomb protein EZH2 regulates tumor invasion via the transcriptional repression of the metastasis suppressor RKIP in breast and prostate cancer. Cancer Res 72(12): 3091-3104.
- Reymond, N., Im, J. H., Garg, R., Vega, F. M., Borda d'Agua, B., Riou, P., Cox, S., Valderrama, F., Muschel, R. J. and Ridley, A. J. (2012). Cdc42 promotes transendothelial migration of cancer cells through beta1 integrin. J Cell Biol 199(4): 653-668.
- Rombouts, K., Carloni, V., Mello, T., Omenetti, S., Galastri, S., Madiai, S., Galli, A. and Pinzani, M. (2013). Myristoylated Alanine-Rich protein Kinase C Substrate (MARCKS) expression modulates the metastatic phenotype in human and murine colon carcinoma in vitro and in vivo. Cancer Lett 333(2): 244-252.
- Sander, V., Reversade, B. and De Robertis, E. M. (2007). The opposing homeobox genes Goosecoid and Vent1/2 self-regulate Xenopus patterning. EMBO J 26(12): 2955-2965.
- Seifert, K., Ibrahim, H., Stodtmeister, T., Winklbauer, R. and Niessen, C. M. (2009). An adhesion-independent, aPKC-dependent function for cadherins in morphogenetic movements. J Cell Sci 122(Pt 14): 2514-2523.
- Sharma, D., Holets, L., Zhang, X. and Kinsey, W. H. (2005). Role of Fyn kinase in signaling associated with epiboly during zebrafish development. Dev Biol 285(2): 462-476.
- Shen, H. B., Gu, Z. Q., Jian, K. and Qi, J. (2013). CXCR4-mediated Stat3 activation is essential for CXCL12-induced cell invasion in bladder cancer. Tumour Biol 34(3): 1839-1845.
- Shi, J., Severson, C., Yang, J., Wedlich, D. and Klymkowsky, M. W. (2011). Snail2 controls mesodermal BMP/Wnt induction of neural crest. Development 138(15): 3135-3145.
- Shi, X., Gangadharan, B., Brass, L. F., Ruf, W. and Mueller, B. M. (2004). Protease-activated receptors (PAR1 and PAR2) contribute to tumor cell motility and metastasis. Mol Cancer Res 2(7): 395-402.
- Skalski, M., Alfandari, D. and Darribere, T. (1998). A key function for alphav containing integrins in mesodermal cell migration during Pleurodeles waltl gastrulation. Dev Biol 195(2): 158-173.
- Slanchev, K., Carney, T. J., Stemmler, M. P., Koschorz, B., Amsterdam, A., Schwarz, H. and Hammerschmidt, M. (2009). The epithelial cell adhesion molecule EpCAM is required for epithelial morphogenesis and integrity during zebrafish epiboly and skin development. PLoS Genet 5(7): e1000563.
- Solnica-Krezel, L. (2005). Conserved patterns of cell movements during vertebrate gastrulation. Curr Biol 15(6): R213-228.
- Song, S., Eckerle, S., Onichtchouk, D., Marrs, J. A., Nitschke, R. and Driever, W. (2013). Pou5f1-dependent EGF expression controls E-cadherin endocytosis, cell adhesion, and zebrafish epiboly movements. Dev Cell 24(5): 486-501.
- Spaderna, S., Schmalhofer, O., Wahlbuhl, M., Dimmler, A., Bauer, K., Sultan, A., Hlubek, F., Jung, A., Strand, D., Eger, A., et al. (2008). The transcriptional repressor ZEB1 promotes metastasis and loss of cell polarity in cancer. Cancer Res 68(2): 537-544.
- Speirs, C. K., Jernigan, K. K., Kim, S. H., Cha, Y. I., Lin, F., Sepich, D. S., DuBois, R. N., Lee, E. and Solnica-Krezel, L. (2010). Prostaglandin Gbetagamma signaling stimulates gastrulation movements by limiting cell adhesion through Snai1a stabilization. Development 137(8): 1327-1337.
- Tada, M. and Smith, J. C. (2000). Xwnt11 is a target of Xenopus Brachyury: regulation of gastrulation movements via Dishevelled, but not through the canonical Wnt pathway. Development 127: 2227-2238.
- Thiery, J. P., Acloque, H., Huang, R. Y. J. and Nieto, M. A. (2009). Epithelial-mesenchymal transitions in development and disease. Cell 139(5): 871-890.
- Tsai, J. H. and Yang, J. (2013). Epithelial-mesenchymal plasticity in carcinoma metastasis. Genes Dev 27(20): 2192-2206.
- Tsai, W. B., Zhang, X., Sharma, D., Wu, W. and Kinsey, W. H. (2005). Role of Yes kinase during early zebrafish development. Dev Biol 277(1): 129-141.
- Urushibata, H., Sasaki, K., Takahashi, E., Hanada, T., Fujimoto, T., Arai, K. and Yamaha, E. (2021). Control of Developmental Speed in Zebrafish Embryos Using Different Incubation Temperatures. Zebrafish 18(5): 316-325.
- van der Lugt, N. M., Domen, J., Linders, K., van Roon, M., Robanus-Maandag, E., te Riele, H., van der Valk, M., Deschamps, J., Sofroniew, M., van Lohuizen, M., et al. (1994). Posterior transformation, neurological abnormalities, and severe hematopoietic defects in mice with a targeted deletion of the bmi-1 proto-oncogene. Genes Dev 8(7): 757-769.
- Vannier, C., Mock, K., Brabletz, T. and Driever, W. (2013). Zeb1 regulates E-cadherin and Epcam (epithelial cell adhesion molecule) expression to control cell behavior in early zebrafish development. J Biol Chem 288(26): 18643-18659.
- Vega, F. M. and Ridley, A. J. (2008). Rho GTPases in cancer cell biology. FEBS Lett 582(14): 2093-2101.
- Vincan, E. and Barker, N. (2008). The upstream components of the Wnt signalling pathway in the dynamic EMT and MET associated with colorectal cancer progression. Clin Exp Metastasis 25(6): 657-663.
- Wander, S. A., Zhao, D., Besser, A. H., Hong, F., Wei, J., Ince, T. A., Milikowski, C., Bishopric, N. H., Minn, A. J., Creighton, C. J. et al. (2013). PI3K/mTOR inhibition can impair tumor invasion and metastasis in vivo despite a lack of antiproliferative action in vitro: implications for targeted therapy. Breast Cancer Res Treat 138(2): 369-381.
- Wang, D. and Dubois, R. N. (2006). Prostaglandins and cancer. Gut 55(1): 115-122.
- Wang, F. M., Liu, H. Q., Liu, S. R., Tang, S. P., Yang, L. and Feng, G. S. (2005). SHP-2 promoting migration and metastasis of MCF-7 with loss of E-cadherin, dephosphorylation of FAK and secretion of MMP-9 induced by IL-1beta in vivo and in vitro. Breast Cancer Res Treat 89(1): 5-14.
- Webster, D. M., Teo, C. F., Sun, Y., Wloga, D., Gay, S., Klonowski, K. D., Wells, L. and Dougan, S. T. (2009). O-GlcNAc modifications regulate cell survival and epiboly during zebrafish development. BMC Dev Biol 9: 28.
- Welch, D. R. and Hurst, D. R. (2019). Defining the Hallmarks of Metastasis. Cancer research 79(12): 3011-3027.
- White, R. J., Collins, J. E., Sealy, I. M., Wali, N., Dooley, C. M., Digby, Z., Stemple, D. L., Murphy, D. N., Billis, K., Hourlier, T., et al. (2017). A high-resolution mRNA expression time course of embryonic development in zebrafish. eLife 6: e30860.
- Wilm, B., James, R. G., Schultheiss, T. M. and Hogan, B. L. (2004). The forkhead genes, Foxc1 and Foxc2, regulate paraxial versus intermediate mesoderm cell fate. Dev Biol 271(1): 176-189.
- Yadav, V. and Denning, M. F. (2011). Fyn is induced by Ras/PI3K/Akt signaling and is required for enhanced invasion/migration. Mol Carcinog 50(5): 346-352.
- Yagi, H., Tan, W., Dillenburg-Pilla, P., Armando, S., Amornphimoltham, P., Simaan, M., Weigert, R., Molinolo, A. A., Bouvier, M. and Gutkind, J. S. (2011). A synthetic biology approach reveals a CXCR4-G13-Rho signaling axis driving transendothelial migration of metastatic breast cancer cells. Sci Signal 4(191): ra60.
- Yamashita, S., Miyagi, C., Fukada, T., Kagara, N., Che, Y. S. and Hirano, T. (2004). Zinc transporter LIVI controls epithelial-mesenchymal transition in zebrafish gastrula organizer. Nature 429(6989): 298-302.
- Yamazaki, K., Takamura, M., Masugi, Y., Mori, T., Du, W., Hibi, T., Hiraoka, N., Ohta, T., Ohki, M., Hirohashi, S., et al. (2009). Adenylate cyclase-associated protein 1 overexpressed in pancreatic cancers is involved in cancer cell motility. Lab Invest 89(4): 425-432.
- Yang, J., Mani, S. A., Donaher, J. L., Ramaswamy, S., Itzykson, R. A., Come, C., Savagner, P., Gitelman, I., Richardson, A. and Weinberg, R. A. (2004). Twist, a master regulator of morphogenesis, plays an essential role in tumor metastasis. Cell 117(7): 927-939.
- Yang, J. and Weinberg, R. A. (2008). Epithelial-mesenchymal transition: at the crossroads of development and tumor metastasis. Dev Cell 14(6): 818-829.
- Yang, X., Dormann, D., Munsterberg, A. E. and Weijer, C. J. (2002). Cell movement patterns during gastrulation in the chick are controlled by positive and negative chemotaxis mediated by FGF4 and FGF8. Dev Cell 3(3): 425-437.
- Yang., J., Parker, A. and Geert, B. (2020). Guidelines and definitions for research on epithelial-mesenchymal transition. Nat Rev Mol Cell Biol 21(6): 341-352.
- Yilmaz, O., Patinote, A., Nguyen, T. V., Com, E., Lavigne, R., Pineau, C., Sullivan, C. V. and Bobe, J. (2017). Scrambled eggs: Proteomic portraits and novel biomarkers of egg quality in zebrafish (Danio rerio). PLoS One 12(11): e0188084.
- Yoshioka, K., Nakamori, S. and Itoh, K. (1999). Overexpression of small GTP-binding protein RhoA promotes invasion of tumor cells. Cancer Res 59(8): 2004-2010.
- Zhu, S., Liu, L., Korzh, V., Gong, Z. and Low, B. C. (2006). RhoA acts downstream of Wnt5 and Wnt11 to regulate convergence and extension movements by involving effectors Rho kinase and Diaphanous: use of zebrafish as an in vivo model for GTPase signaling. Cell Signal 18(3): 359-372.
- Zhu, X., Jiang, J., Shen, H., Wang, H., Zong, H., Li, Z., Yang, Y., Niu, Z., Liu, W., Chen, X., Hu, Y. and Gu, J. (2005). Elevated beta1,4-galactosyltransferase I in highly metastatic human lung cancer cells. Identification of E1AF as important transcription activator. J Biol Chem 280(13): 12503-12516.
- Zon, L. I. and Peterson, R. T. (2005). In vivo drug discovery in the zebrafish. Nat Rev Drug Discov 4(1): 35-44.
文章信息
版权信息
![]() Nakayama et al. This article is distributed under the terms of the Creative Commons Attribution License (CC BY 4.0).
Nakayama et al. This article is distributed under the terms of the Creative Commons Attribution License (CC BY 4.0).
如何引用
Readers should cite both the Bio-protocol article and the original research article where this protocol was used:
- Nakayama, J., Makinoshima, H. and Gong, Z. (2022). Gastrulation Screening to Identify Anti-metastasis Drugs in Zebrafish Embryos. Bio-protocol 12(19): e4525. DOI: 10.21769/BioProtoc.4525.
- Nakayama, J., Tan, L., Li, Y., Goh, B. C., Wang, S., Makinoshima, H. and Gong, Z. (2021b). A zebrafish embryo screen utilizing gastrulation identifies the HTR2C inhibitor pizotifen as a suppressor of EMT-mediated metastasis. Elife 10: e70151.
分类
药物发现 > 药物筛选
癌症生物学 > 侵袭和转移 > 药物发现和分析 > 细胞迁移
细胞生物学 > 细胞运动
您对这篇实验方法有问题吗?
在此处发布您的问题,我们将邀请本文作者来回答。同时,我们会将您的问题发布到Bio-protocol Exchange,以便寻求社区成员的帮助。