

Visualization, Quantification, and Modeling of Endogenous RNA Polymerase II Phosphorylation at a Single-copy Gene in Living Cells
活细胞中单拷贝基因内源性 RNA 聚合酶 II 磷酸化的可视化、量化和建模
发布: 2022年08月05日第12卷第15期 DOI: 10.21769/BioProtoc.4482 浏览次数: 2984
评审: Zinan ZhouPooja VermaRama Reddy Goluguri
参见作者原研究论文
The authors used this protocol in:

May 2021
Advertisement


Abstract
In eukaryotic cells, RNA Polymerase II (RNAP2) is the enzyme in charge of transcribing mRNA from DNA. RNAP2 possesses an extended carboxy-terminal domain (CTD) that gets dynamically phosphorylated as RNAP2 progresses through the transcription cycle, therefore regulating each step of transcription from recruitment to termination. Although RNAP2 residue-specific phosphorylation has been characterized in fixed cells by immunoprecipitation-based assays, or in live cells by using tandem gene arrays, these assays can mask heterogeneity and limit temporal and spatial resolution. Our protocol employs multi-colored complementary fluorescent antibody-based (Fab) probes to specifically detect the CTD of the RNAP2 (CTD-RNAP2), and its phosphorylated form at the serine 5 residue (Ser5ph-RNAP2) at a single-copy HIV-1 reporter gene. Together with high-resolution fluorescence microscopy, single-molecule tracking analysis, and rigorous computational modeling, our system allows us to visualize, quantify, and predict endogenous RNAP2 phosphorylation dynamics and mRNA synthesis at a single-copy gene, in living cells, and throughout the transcription cycle.
Graphical abstract:
Schematic of the steps for visualizing, quantifying, and predicting RNAP2 phosphorylation at a single-copy gene.
Background
Interest in the phosphorylation status of the CTD increased due to recent studies showing its correlation with RNAP2 clustering (Cissé et al., 2013; Cho et al., 2016; Boehning et al., 2018; Pancholi et al., 2021). These findings suggest that RNAP2 clusters form around gene promoters, and early in the transcription cycle, they are enriched in unphosphorylated-RNAP2 and Ser5ph-RNAP2 (Nagashima et al., 2019). RNAP2 phosphorylation distribution along the 1D genome has been extensively studied using immunoprecipitation-based assays (Heidemann et al., 2013; Harlen and Churchman, 2017). However, these techniques are performed using fixed cells and require averaging over a population of cells, limiting temporal resolution and masking heterogeneity (Coulon et al., 2013). Recent advances in fluorescent microscopy and single-molecule tracking (Tokunaga et al., 2008; Chen et al., 2014; Li et al., 2019) have overcome these limitations. Now, it is possible to monitor single RNAP2 dynamics at different locations throughout the genome (Cissé et al., 2013; Steurer et al., 2018) and specific single-copy genes (Cho et al., 2016; Li et al., 2019) pre-marked with MS2 (Tantale et al., 2016; Pichon et al., 2018) or PP7 (Larson et al., 2011; Coulon et al., 2014) RNA stem-loops. When transcribed, MS2 and PP7 tags form hairpin-like secondary structures, which are then bound by their fluorescence-labeled coating proteins, MCP and PCP, respectively. Unfortunately, previous protocols use permanent fluorescent fusion tags to track RNAP2, which cannot distinguish between the crucial RNAP2 phosphorylation states that control transcription.
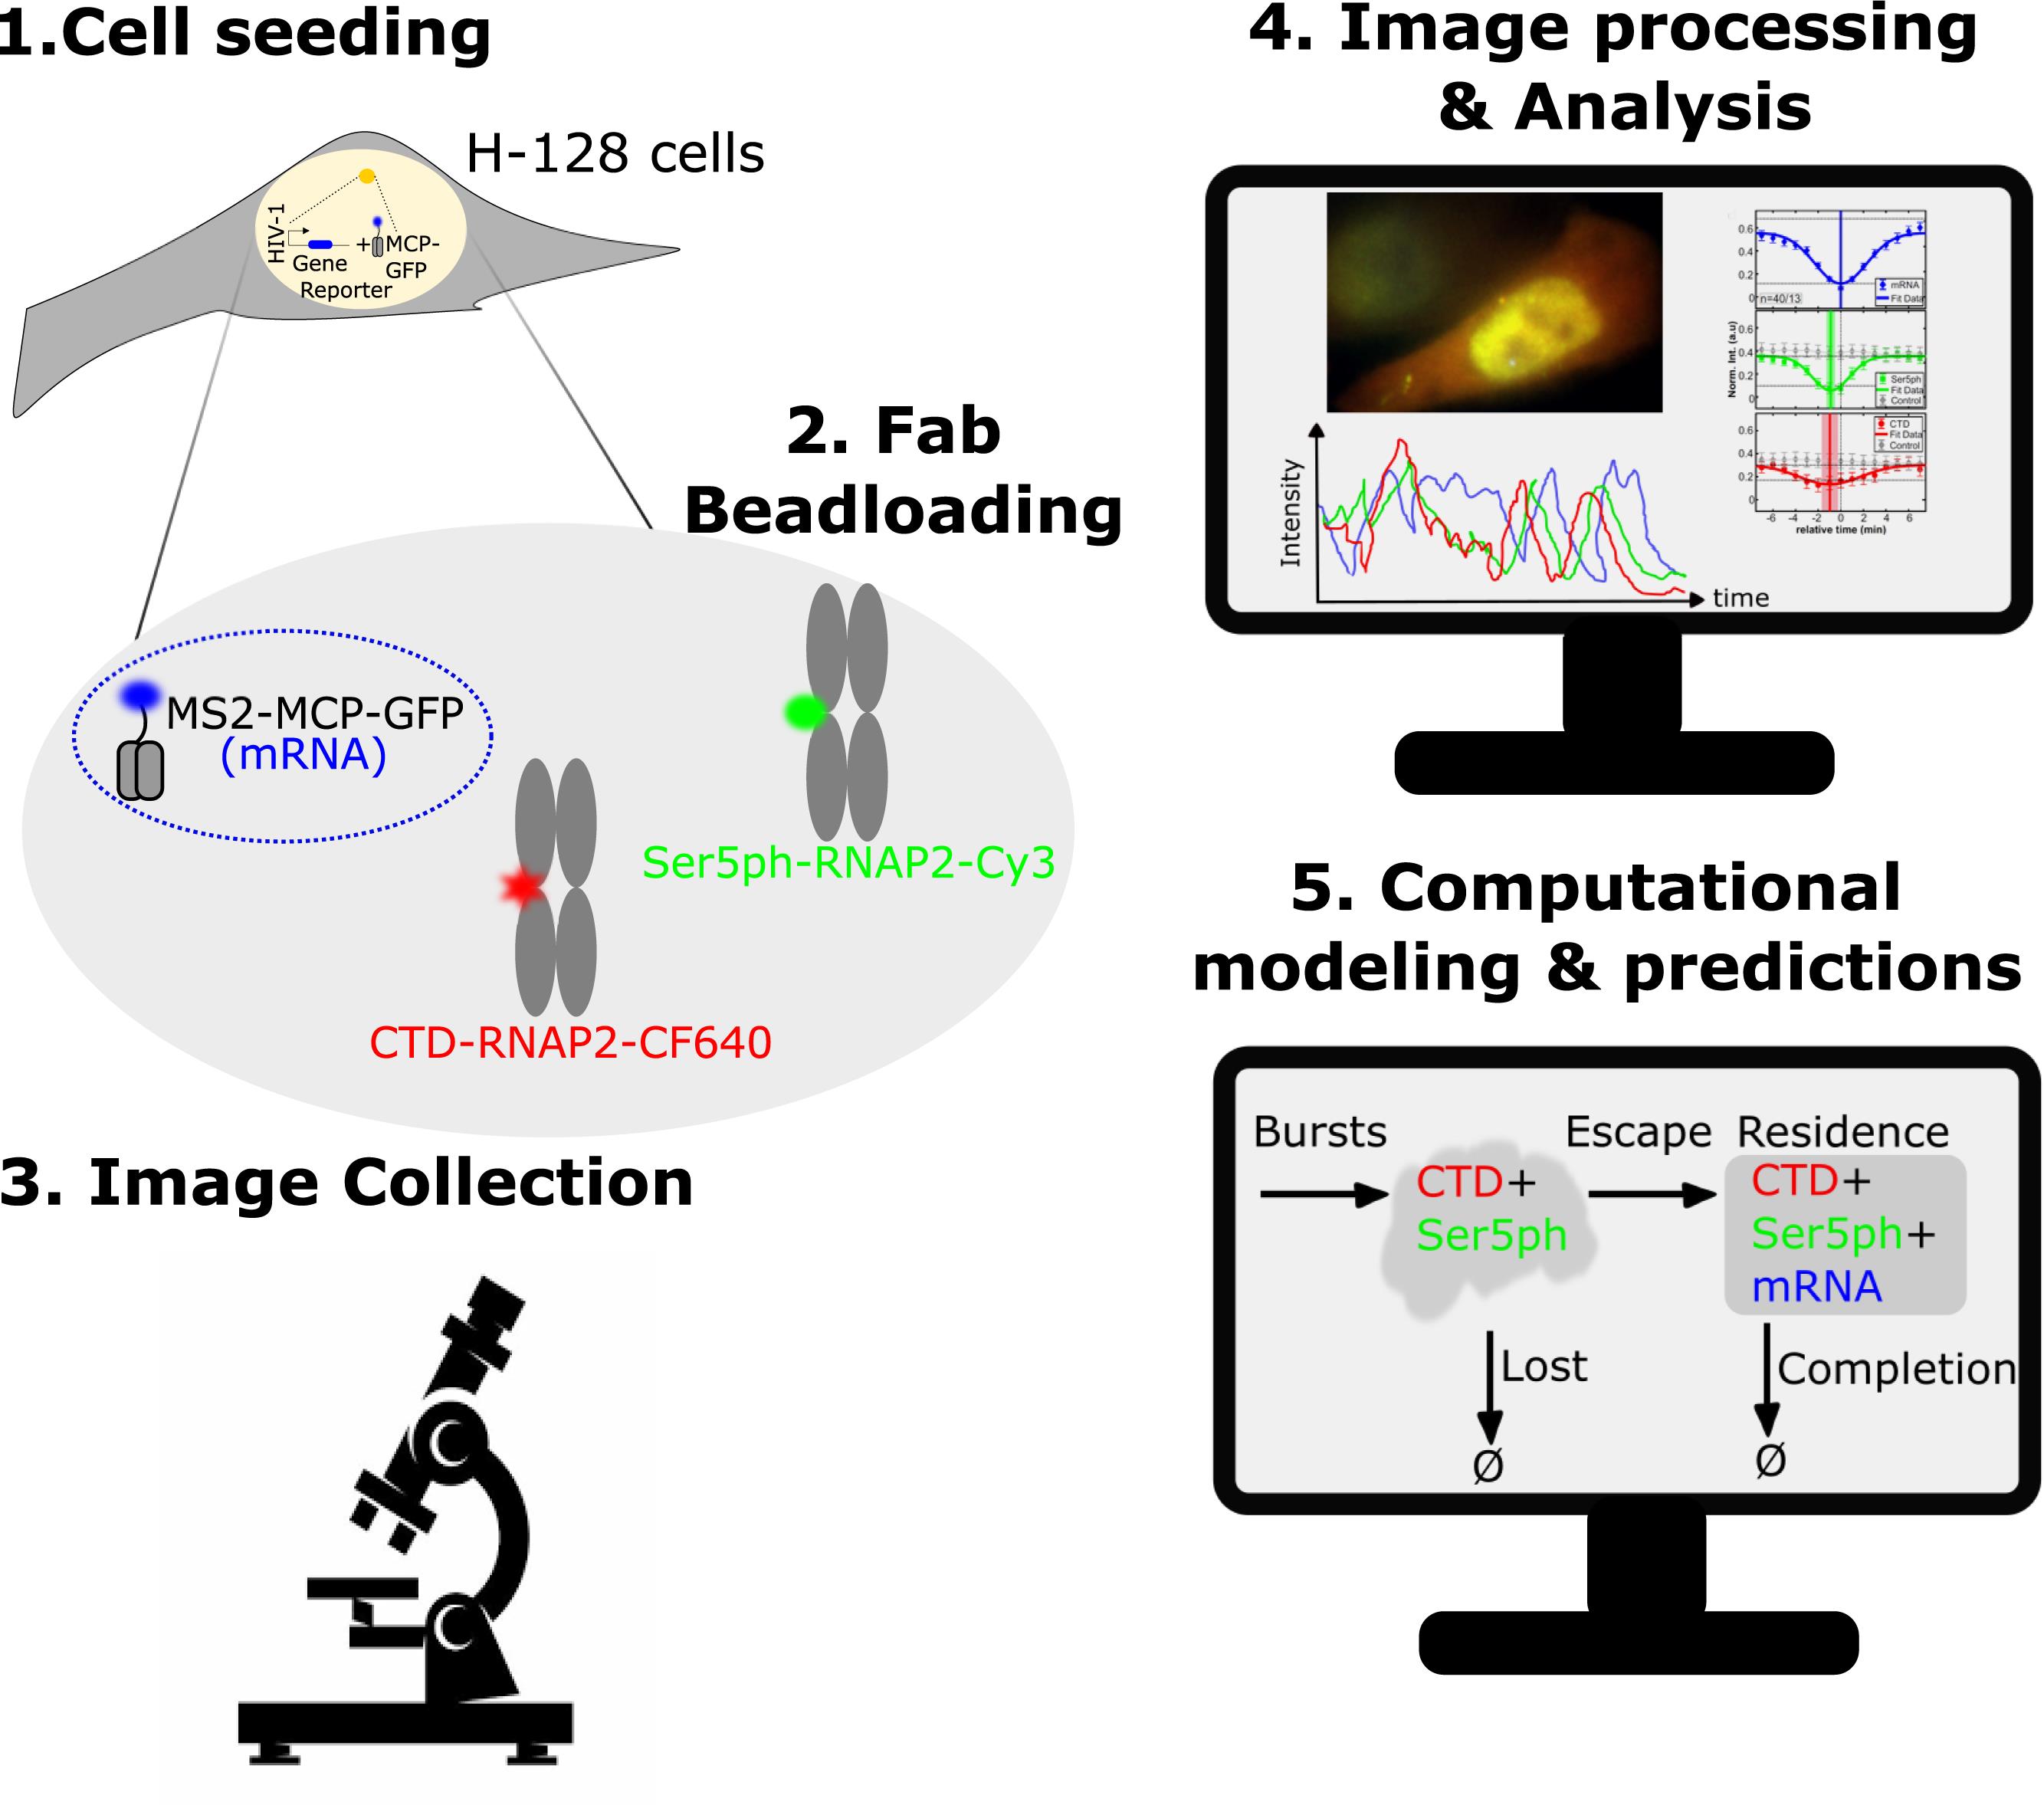
Fluorescent antibody-based (Fab) probes can detect post-translational modifications to RNAP2 by binding and lighting up specific modifications to the CTD of RNAP2 in vivo (Hayashi-Takanaka et al., 2009; Stasevich et al., 2014; Kimura et al., 2015; Lyon and Stasevich, 2017). However, freely diffusing and unbound Fab probes lead to a high background; hence, this technique was previously limited to large tandem gene arrays (Stasevich et al., 2014) that include multiple copies of the same gene to enhance the signal-to-noise ratio. However, using such a protocol averages over many gene copies, and masks heterogeneity from one gene copy to another. Recently, our lab developed a protocol to measure and predict the spatiotemporal dynamics of RNAP2 phosphorylation and mRNA production throughout the transcription cycle of a single-copy gene. This protocol, which we describe here, combines multicolor single-molecule microscopy, complementary Fabs, and rigorous computational modeling (Forero-Quintero et al., 2021). For our system (Forero-Quintero et al., 2021), we utilized an established HeLa cell line (H-128) expressing a single-copy reporter gene controlled by an HIV-1 promoter, comprising an MS2-tag and its MS2 coating protein tagged with GFP (MCP, blue) (Tantale et al., 2016). Our reporter gene is predominantly active due to persistent stimulation by Tat, leading to a bright MCP-GFP signal, that indicates the location of the transcription site within the nucleus, allowing us to observe fluctuations in mRNA synthesis in real-time (Figure 1a). Our loaded Fabs recognize the CTD of RNAP2 (CTD-RNAP2, conjugated with CF640, red) without or with residue-specific phosphorylation, and specific phosphorylation at the Serine 5 within the CTD of RNAP2 (Ser5ph-RNAP2, conjugated with Cy3, green). This combination of imaging probes makes it possible to observe RNAP2 regions enriched or depleted with Ser5ph within the nucleus (Figure 1a, b). Fab binding and unbinding from their targets occurs rapidly, making it a valuable tool to monitor temporal changes in the phosphorylation status of RNAP2 (Hayashi-Takanaka et al., 2011; Stasevich et al., 2014; Kimura et al., 2015). At the HIV-1 reporter transcription site, we typically observe both Fabs present, but on occasion, the Ser5ph-RNAP2 signal becomes dim or absent despite the presence of CTD-RNAP2 and mRNA signals. Furthermore, all signals occasionally reduce to background levels, evidencing correlated fluctuations of the signals, which are caused by natural bursts and pauses in the transcriptional activity of the reporter gene (Figure 1b). By combining these multicolor elements, we can distinguish three distinct steps of the transcription cycle at the HIV-1 reporter gene: (1) RNAP2 recruitment (marked by Fab targeting CTD-RNAP2), (2) initiation (marked by Fab targeting CTD-RNAP2 and Fab targeting Ser5ph-RNAP2), and (3) elongation (marked by both Fabs and MCP binding to mRNA) (Figure 1a). To add a quantitative interpretation to these observations, we explored many possibilities and identified a simple computational model that matches all data. The optimal model that fits all data, but which avoided overfitting, consists of five basic rate parameters that describe four reactions: (1) the recruitment of RNAP2 in geometrically distributed bursts of average size (β) and frequency (ω), (2) the departure of unsuccessful or lost RNAP2 (kab), (3) promoter escape of RNAP2 (kesc), and (4) a combined rate of transcription completion and RNAP2 release (kc). Our simple mechanistic mathematical model allows us to estimate each of the above rates with excellent precision, as well as to predict the number of unphosphorylated and/or phosphorylated RNAP2 at each state throughout the transcription cycle at the HIV-1 reporter gene, and to simulate additional experimental features, such as RNAP2 positional densities or response to different transcriptional inhibition mechanisms.
Our integrated technique possesses several advantages: (1) Fab binds endogenous RNAP2, so all RNAP2 present in the cell at a given time has a high probability to be labeled; (2) The fluorescence of the Fabs is naturally amplified by the 52 heptad repeats contained in the CTD of RNAP2; (3) Fab continually binds and unbinds RNAP2, reducing the loss of fluorescence due to photobleaching; (4) Our technology can be employed to measure the RNAP2 dynamics and phosphorylation status at other single-copy genes, provided the location of the gene can be identified without (Gu et al., 2018) or with labeling techniques [e.g., using MS2 or PP7 tags (Larson et al., 2011; Coulon et al., 2014; Tantale et al., 2016; Pichon et al., 2018), or other labeling systems such as ROLEX (Ochiai et al., 2015), ANCHOR (Mariamé et al., 2018), DNA FISH (Takei et al., 2017) or CasFISH (Deng et al., 2015)]; and (5) our modeling approach directly considers the temporal and statistical fluctuations of individual transcription sites, and applies information criteria to identify the simplest model that matches all experimental data.
In this protocol, we describe step-by-step how to fragment and fluorescently label antibodies targeting the CTD of RNAP2, how we put them into human cells using bead-loading (McNeil and Warder, 1987; Hayashi-Takanaka et al., 2009; Stasevich et al., 2014; Cialek et al., 2021), the imaging conditions we employed and how to tune them to get a good signal-to-noise ratio based on the experimental needs, how to quantify signal intensities at the transcription site from 3D imaging movies, and how to infer an appropriate mathematical model to reproduce these data without overfitting.

Figure 1. Schematic of our multicolor system to visualize RNAP2 phosphorylation at the transcription site of a reporter gene. A. The reporter gene contains a 128x MS2 insert (blue) that, when transcribed, produces stem-loops which are then recognized and bound by MCP genetically fused to GFP, thus lighting up the location of the gene within the nucleus, as well as the synthesis of nascent and mature mRNAs. Our Fabs are capable of identifying the CTD of RNAP2, as well as its phosphorylation at serine 5, which were fluorescently labeled with CF640 (red) and Cy3 (green), respectively. By combining these three elements, it is possible to visualize the recruitment (by CTD-RNAP2-CF640), initiation (by Ser5ph-RNAP2-Cy3), and elongation (by MS2-MCP-GFP) steps at the transcription site of a reporter gene. B. Crops from an example cell displaying, from top to bottom, the mRNA, Ser5ph-RNAP2, CTD-RNAP2, and merge signals, at three characteristic time points, in which (left) all three signals are present, (middle) mRNA and CTD-RNAP2 are present, but Ser5ph-RNAP2 is dim or absent, and (right) all signals are absent. These data demonstrate transcription fluctuations and the occurrence of multiple transcription cycles (example cell image adapted from Forero-Quintero et al., 2021).
Materials and Reagents
CTD-RNAP2 & Ser5ph-RNAP2 Fab generation and dye-conjugation
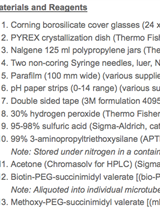
15 mL conical collection tubes (Fisher Scientific, catalog number: 14-959-49D)
500 mL Steritop Threaded Bottle Top Filter, 0.22 µm, Polyethersulfone (PES), Sterile, 33 mm fitting, (Millipore Sigma, catalog number: SCGPS05RE)
Amicon Ultracel-4 (10 kDa-cutoff) centrifugal filter unit with cellulose membrane, 4 mL sample volume (Millipore Sigma, catalog number: UFC801024)
Amicon Ultracel-10 (10 kDa-cutoff) 0.5 centrifugal filter unit (Fisher Scientific, catalog number: UFC501024)
0.6 mL and 1.7 mL low retention microcentrifuge tubes (Thomas Scientific, catalog numbers: 1149J99 and 1149K01, respectively)
PD-mini G-25 desalting column (VWR, GE Healthcare, catalog number: 95055-984)
Rack/stand for filtering using 15 mL conical tubes (we use the rack provided with the NucleoBond Xtra Midi Kit, from Macherey-Nagel, catalog number: 740420.50)
Pierce Mouse IgG1 Fab and F(ab’)2 Preparation Kit (Thermo Fisher Scientific, catalog number: PI44980), store at 4 °C
Anti-CTD-RNAP2 and anti-Ser5ph-RNAP2 monoclonal antibodies used were kindly provided by Dr. Hiroshi Kimura, but now they are commercially available (Cosmo Bio USA, catalog numbers: MABI 0601 and MABI 0603, respectively), store at 4 °C
Sodium Azide (Millipore Sigma, catalog Number: 71289-5G), store at RT
Phosphate-buffered saline (10× PBS) (Fisher Scientific, catalog number: BP661-10), store at RT
Sodium Bicarbonate (NaHCO3) (Millipore Sigma, catalog number: S5761-500G), store at RT, and 4 °C when in solution
Dimethyl sulfoxide (DMSO) (Millipore Sigma, catalog number: D8418), stored at RT
Cy3 N-hydroxysuccinimide ester mono-reactive dye pack (VWR, catalog number: 95017-373), store at -20 °C
CF640R Succinimidyl Ester (Biotium, catalog number: 92108), store at -20 °C
Sodium Bicarbonate (NaHCO3) (Millipore Sigma, catalog number: S5761-500G), store at RT, and 4 °C when in solution
1× PBS (see Recipes)
H-128 cell culture
100 mm tissue culture dishes (VWR, CELLSTAR, catalog number: 82050-546)
Serological pipettes Polystyrene 10 mL (VWR, catalog number: 82050-482 (CS))
1 L glass graduated cylinder (Chemistry stock room CSU)
HeLa Flp-in H9 cells (H-128) (Kindly provided by Dr. Edouard Bertrand (Tantale et al., 2016), store at -80 °C, and maintain at 37 °C in culture)
Dulbecco’s modified Eagle medium (DMEM), high glucose, no glutamine (Thermo Fisher Scientific, catalog number: 11960-044), store at 4 °C
L-glutamine (L-glut) (200 mM)-100× (Thermo Fisher Scientific, catalog number: 25030081), store at -20 °C
Penicillin Streptomycin (P/S) (10,000 U/mL) (Thermo Fisher Scientific, catalog number: 15140122), store at -20 °C
Fetal Bovine Serum (FBS), 100% US Origin (Atlas Biologicals, catalog number: F-0050-A), store at -20 °C
Hygromycin B (Gold Biotechnology, catalog number: H-270-1), store at -20 °C
Trypsin-EDTA (0.05%), phenol red (Thermo Fisher Scientific, catalog number: 25300062, store at -20 °C for long term, and at 4 °C when in regular use)
DMEM to maintain H-128 cells (see Recipes)
DMEM to image H-128 cells (see Recipes)
Transcription Inhibitors recipes (see Recipes)
Loading CTD-RNAP2-CF640 & Ser5ph-RNAP2-Cy3 Fabs into living H-128 cells
Glass bottom dishes (35 mm, 14 mm glass) (MatTek Corporation, catalog number: P35G-1.5-14-C).
Dye-conjugated Fabs “CTD-RNAP2-CF640 & Ser5ph-RNAP2-Cy3” (see details in Materials & Procedure sections A), store at 4 °C
Custom-made bead-loader with 106 μm glass beads [see details in our bead-loading protocol (Cialek et al., 2021)].
DMEM medium-high glucose, no glutamine, phenol red-free (Thermo Fisher Scientific, catalog number: 31053-028), store at 4 °C
Imaging
Triptolide, Tripterygium wilfordii (Millipore Sigma, catalog number: 645900), store at -20 °C
Flavopiridol, Alvocidib (Selleck Chemicals, catalog number: S1230), store at -20 °C
THZ1 2HCl, CDK7 Inhibitor (Selleck Chemicals, catalog number: S7549), store at -20 °C
Note: The inhibitors above were reconstituted in DMSO before storage.
Equipment
Rocker/rotator (Thermo Fisher Scientific, model: HulaMixer PRS-5/12, catalog number: 15920D)
Arduino Uno-R3 (SparkFun Electronics, catalog number: DEV-11021), and mini rotor (SparkFun Electronics, Servo-Generic Sub-Micro Size, catalog number: ROB-09065)
Tissue culture CO2 Incubator for cells (Heraeus, model: Heracell 150)
Tabletop centrifuge (Beckman Coulter, model: Microfuge 20)
Tabletop centrifuge capable of cooling (Thermo Fisher Scientific, model: Accusping Micro 17R, and/or Sorvall Legend XFR with F14 6x250LE)
UV-vis Spectrophotometer (Thermo Fisher Scientific, model: NanoDrop OneC, Catalog number: ND-ONE-W)
Biological safety cabinet (Nuaire, model: Class II type A/B3, NU-425-400)
TC20 Automated Cell Counter (Bio-Rad, catalog number: 145-0102)
Pure water filtration (Thermo Fisher Scientific, model: Barnstead NANOpure II)
Digital water bath (Fisher Scientific, model: ISOTEMP 210)
Fluorescence microscope with highly inclined illumination and a stage top incubator [we employed our custom-made microscope (Forero-Quintero et al., 2021)]
Laptop or desktop computer with Mathworks Matlab
Software
Preprocess the images with Fiji ImageJ (Schindelin et al., 2012) (https://fiji.sc/)
Analyze the preprocessed images using custom-made code written in Wolfram Mathematica 11.1.1 (https://www.wolfram.com/mathematica/), and available at https://github.com/MunskyGroup/Forero_2020/tree/master/Bioprotocol_Codes.
Model identification scripts and model-exploration Graphical User Interface (GUI) were created using MATLAB R2019b (https://www.mathworks.com/products/matlab.html), and are available at https://github.com/MunskyGroup/Forero_2020/tree/master/Bioprotocol_Codes.
Procedure
文章信息
版权信息
© 2022 The Authors; exclusive licensee Bio-protocol LLC.
如何引用
Forero-Quintero, L. S., Raymond, W., Munsky, B. and Stasevich, T. J. (2022). Visualization, Quantification, and Modeling of Endogenous RNA Polymerase II Phosphorylation at a Single-copy Gene in Living Cells. Bio-protocol 12(15): e4482. DOI: 10.21769/BioProtoc.4482.
分类
生物物理学 > 显微技术
生物信息学与计算生物学
生物化学 > RNA > 单分子活性 > 成像
您对这篇实验方法有问题吗?
在此处发布您的问题,我们将邀请本文作者来回答。同时,我们会将您的问题发布到Bio-protocol Exchange,以便寻求社区成员的帮助。