

TRACES: a Freely Accessible, Semi-automated Pipeline for Detection, Tracking, and Quantification of Fluorescently Labeled Cellular Structures
TRACES:用于检测、跟踪和量化荧光标记细胞结构的可自由访问的半自动化管道
发布: 2022年08月05日第12卷第15期 DOI: 10.21769/BioProtoc.4479 浏览次数: 2274
评审: Giusy TornilloVinay PanwarAnonymous reviewer(s)
参见作者原研究论文
The authors used this protocol in:

Jul 2021
Advertisement


Abstract
Subcellular structures exhibit diverse behaviors in different cellular processes, including changes in morphology, abundance, and relative spatial distribution. Faithfully tracking and quantifying these changes are essential to understand their functions. However, most freely accessible methods lack integrated features for tracking multiple objects in different spectral channels simultaneously. To overcome these limitations, we have developed TRACES (Tracking of Active Cellular Structures), a customizable and open-source pipeline capable of detecting, tracking, and quantifying fluorescently labeled cellular structures in up to three spectral channels simultaneously at single-cell level. Here, we detail step-by-step instructions for performing the TRACES pipeline, including image acquisition and segmentation, object identification and tracking, and data quantification and visualization. We believe that TRACES will be a valuable tool for cell biologists, enabling them to track and measure the spatiotemporal dynamics of subcellular structures in a robust and semi-automated manner.
Keywords: Particle tracking (粒子追踪)Background
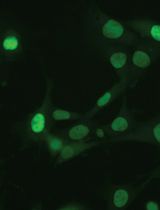
Deciphering how subcellular structures change in space and time is often key to understanding biological functions (Kholodenko et al., 2010). Thus, developing approaches to visualize, track, and measure these spatiotemporal changes has been a critical area of research in cell biology. In the past decades, advances in fluorescent protein engineering (Lippincott-Schwartz and Patterson, 2003; Giepmans et al., 2006) and optical microscopy (Tanaami et al., 2002; Stephens and Allan, 2003; Hell, 2007; Chen et al., 2014; Oreopoulos et al., 2014) have allowed scientists to observe subcellular structures with unprecedented spatiotemporal resolution. Post-imaging processing and analysis are then applied to quantify and interpret the data. For example, a popular Fiji plugin, TrackMate, can be used to visualize and analyze the motion of objects (Tinevez et al., 2017; Ershov et al., 2021), including the tracking of hundreds of centrosomes in the same spectral channel simultaneously (Aydogan et al., 2018, 2020, 2022; Alvarez-Rodrigo et al., 2019). CellProfiler (Lamprecht et al., 2007; Stirling et al., 2021), another open-source software tool, can be used to quantify data from biological images, particularly in a modular and high-throughput manner. However, TrackMate cannot track on multiple spectral channels simultaneously and is not optimal for tracking objects that are not perfectly circular. CellProfiler, while versatile and packed with extensive features, is not usually used for analyzing subcellular structures. Imaris (Bitplane, Belfast, UK) is a popular software capable of tracking objects in three dimensions with a user-friendly interface, but this and other commercially available image processing software (e.g., NIS Elements by Nikon, Tokyo, Japan) are not free to users, especially for the advanced features such as particle tracking. To overcome these limitations, we have developed TRACES (Tracking of Active Cellular Structures), a customizable and semi-automated quantification pipeline capable of simultaneously detecting, tracking, and quantifying up to three fluorescently labeled object types at single-cell resolution. TRACES is built on open-source platforms and freely accessible to users. The use of intensity- and size-based thresholding to segment objects in TRACES also makes it possible to identify and track objects that are not circular (an advantage over TrackMate). In addition, as the tracking and quantification algorithm of TRACES is written in Python and implemented using Jupyter Notebook, it can be easily modified or improved to fit users’ needs. While several available tools are optimized for tracking entire cells, TRACES is developed specifically for tracking subcellular structures at single-cell resolution, including tracking micron-sized objects, such as the centrosome. In this protocol, we use the analysis of condensation of pericentrin (PCNT) proteins and the movement of the resulting “condensates” toward the centrosome (Jiang et al., 2021) as an example, hereby demonstrating the TRACES workflow. This workflow involves image acquisition and segmentation, object identification and tracking, and data quantification and visualization.
One limitation of TRACES is its inability to track dividing cells, as the current tracking algorithm assumes one nucleus object per cell. We hope to implement object tracking features for dividing cells in the future. Moreover, while the Python algorithm is capable of tracking on multiple spectral channels simultaneously, the objects of interest in each channel need to be identified manually in the initial image segmentation step in Fiji. We hope to integrate an automated workflow of image segmentation into our future pipeline.
In sum, our TRACES method is a free and semi-automated pipeline for detecting, tracking, and measuring multiple fluorescently labeled cellular structures in up to three spectral channels simultaneously at single-cell level. If these cellular objects can be segmented and distinguished from one another, their relationships and properties (e.g., distance, size) can then be quantified using the TRACES method. Therefore, we envision that TRACES is not limited to analyzing centrosomes, their related structures, and nuclei, the three objects exemplified in this protocol. TRACES can be applied to analyzing any distinct fluorescent objects in up to three spectral channels in the cell, and will thus be a useful tool for the cell biology community, facilitating quantitative image analysis in other biological contexts.
Materials and Reagents
4-chamber 35-mm glass bottom dishes with 20-mm microwell, #1.5 cover glass (Cellvis, catalog number: D35C4-20-1.5-N)
hTERT immortalized retinal pigment epithelial (RPE-1) cells (A gift from Irina Kaverina, Vanderbilt University, Nashville, TN, catalog number: CRL-4000, RRID: CVCL_4388)
RPE-1 cells constitutively expressing mScarlet-i-H2A and miRFP670-CETN2 with stably integrated GFP-PCNT (854-1960) constructs under the control of a Doxycycline-inducible promoter (Jiang et al., 2021)
Doxycycline hyclate (MilliporeSigma, catalog number: D9891)
Dulbecco’s modified Eagle’s medium/Hams F-12 50/50 Mix (DMEM/F-12) (Corning, catalog number: 10-092-CV)
Penicillin-Streptomycin solution, 100× (Corning, catalog number: 30-002-CI)
Tetracycline negative fetal bovine serum (tet-negative FBS) (Gemini Bio, catalog number: 100-800)
Equipment
Spinning disk confocal microscope system (Dragonfly, Andor Technology, Belfast, UK)
The spinning disk confocal module is the Dragonfly 503 multimodal imaging system (Andor) with dual color TIRF, two camera ports, and 25 µm and 40 µm pinholes. It has four lines of laser launches (405 nm/100 mW, 488 nm/50 mW, 561 nm/50 mW, and 643 nm/100 mW). The base of the system is a Leica DMi8 inverted microscope (Leica, Wetzlar, Germany) with objectives spanning the range from 10× to 100× [10×/0.40 (magnification/numerical aperture) air HCX PL APO, 25×/0.95 water HC PL FLUOTAR, 40×/1.10 water HC PL APO, 63×/1.40 oil HC PL APO, 100×/1.40 oil HC PL APO, and 100×/1.47 oil HC PL APO CORR TIRF]. The images shown in this protocol were all acquired by the 63×/1.40 oil HC PL APO objective. The laser lines used in this study are 488 nm, 561 nm, and 643 nm, with the corresponding bandpass emission filters of 525–550 nm, 600–650 nm, and 725–740 nm, respectively.
iXon Ultra 888 EMCCD camera (Andor Technology)
Environmental incubator (Okolab, Pozzuoli, Italy)
Software
Anaconda (Anaconda, Inc., New York, NY)
Fiji (ImageJ) (Johannes Schindelin, Albert Cardona, Pavel Tomancak, RRID: SCR_002285)
Jupyter Notebook (Project Jupyter, RRID:SCR_018315)
Python Programming Language (Python Software Foundation, RRID: SCR_008394)
Procedure
文章信息
版权信息
© 2022 The Authors; exclusive licensee Bio-protocol LLC.
如何引用
Jiang, X., Jiang, L. and Jao, L. E. (2022). TRACES: a Freely Accessible, Semi-automated Pipeline for Detection, Tracking, and Quantification of Fluorescently Labeled Cellular Structures. Bio-protocol 12(15): e4479. DOI: 10.21769/BioProtoc.4479.
分类
生物信息学与计算生物学
细胞生物学 > 细胞成像 > 共聚焦显微镜
细胞生物学 > 细胞成像 > 活细胞成像
您对这篇实验方法有问题吗?
在此处发布您的问题,我们将邀请本文作者来回答。同时,我们会将您的问题发布到Bio-protocol Exchange,以便寻求社区成员的帮助。