

The Peak Interval Procedure in Rodents: A Tool for Studying the Neurobiological Basis of Interval Timing and Its Alterations in Models of Human Disease
啮齿类动物的峰值间隔程序:研究人类疾病模型中间隔时间及其变化的神经生物学基础的工具

发布: 2020年09月05日第10卷第17期 DOI: 10.21769/BioProtoc.3735 浏览次数: 4120
评审: Dhruv Rajanikant PatelAnonymous reviewer(s)
参见作者原研究论文
The authors used this protocol in:

Dec 2017
Advertisement


Abstract
Animals keep track of time intervals in the seconds to minutes range with, on average, high accuracy but substantial trial-to-trial variability. The ability to detect the statistical signatures of such timing behavior is an indispensable feature of a good and theoretically-tractable testing procedure. A widely used interval timing procedure is the peak interval (PI) procedure, where animals learn to anticipate rewards that become available after a fixed delay. After learning, they cluster their responses around that reward-availability time. The in-depth analysis of such timed anticipatory responses leads to the understanding of an internal timing mechanism, that is, the processing dynamics and systematic biases of the brain’s clock. This protocol explains in detail how the PI procedure can be implemented in rodents, from training through testing to analysis. We showcase both trial-by-trial and trial-averaged analytical methods as a window into these internal processes. This protocol has the advantages of capturing timing behavior in its full-complexity in a fashion that allows for a theoretical treatment of the data.
Keywords: Interval Timing (间隔时间)Background
Organisms perceive time as if it were a sensation. It follows the same psychophysical rules as other sensations. Yet there is no sensory system that transduces physical time into a neural code. Interval timing seems to be a cognitive ability that acts a bit like a stopwatch, but the neurobiological mechanisms are largely unknown (see Balcı and Simen, 2016). How animals time intervals is one of a handful of crucial contemporary research questions studied by many research groups across the world. Our main tool for investigating time perception has consistently and for decades been the core statistical features of timed animal behavior–statistical features shared across the animal kingdom (Malapani and Fairhust, 2002; Buhusi and Meck, 2005).
Standing tall among these statistical features, scalar variability suggests that, as the time interval increases, so too does the animal’s variability in their representation of it. It’s Weber’s Law applied to time (Gibbon, 1977) explained by the fact that the standard deviation of an animal’s timed responses scales linearly with their mean (Buhusi and Meck, 2005; Buhusi et al., 2009). Historically, these sorts of psychophysical and statistical regularities formed the foundation of the search for and description of an internal clock (e.g., Matell and Meck, 2004; Oprisan and Buhusi, 2014; Balcı and Simen, 2016).
Consequently, the ability to detect these statistical signatures in humans and other animals is an indispensable feature of a good testing procedure for timing. Arguably, one of the most widely utilized interval timing procedures is the Peak Interval procedure that originated in animal research (Catania, 1970; Roberts, 1981) and then later adapted for human testing (Rakitin et al., 1998). In the Peak Interval (PI) procedure, a reward, usually a food pellet, is available after a fixed delay after some event, usually a stimulus. To collect the reward, the animal must make an experimenter defined response. On some trials, the reward is never delivered, regardless of when the animal responds. In this way, the procedure is rooted in Skinner’s classical fixed interval (FI) schedule of reinforcement (Ferster and Skinner, 1957), except with probe trials.
When the animal’s response rate is averaged over many FI trials the response curve increases smoothly (like a shallow S) over the course of the trial. On peak trials there is also a smooth decrease in the response rate after the expected reinforcement fails to occur, as if two S’s lined up back to back to resemble a bell-curve.
While the standard Fixed Interval task still plays a critical role in studying the timing mechanism, its major flaw is that it only conveys half the story. The single S-curve growing toward the target time conveys the animal’s growing expectation for reward. But it cannot convey exactly when the animal expects the reward. In effect, reward delivery serves as a procedural censor; it contaminates the anticipatory responding guided solely by elapsed time. Peak interval trials show the animal’s expectation function that grows before the target time and shrinks after.
These peak interval (probe) trials, randomly inter-mixed with the FI trials, last much longer than the FI trials (minimum 3*FI) and reward is never delivered. Over trials, the peak of the bell-shaped response curve reflects the animal’s highest expectation, an index of accuracy. The width of the response curve measures response variability, which in part reflects the animal’s internal representation of the interval, elapsed time, and probably many other factors. A subject with a faulty timing mechanism but intact associative memory (i.e., CS-US association) would show a flat but high response rate throughout the trial (e.g., see Figure 3-top panel of Meck, 2006).
The bell-curve response gradient results from averaging the animal’s responses over single trials, but does not fully represent the pattern of responding in individual trials, a difference which may be theoretically meaningful. In individual PI trials, anticipatory responding seems to reflect two different internal states. When the trial starts, subjects respond infrequently, at a low rate, called a break period. Then, usually about two-thirds of the way to the expected reward, they abruptly begin responding at a high rate --a run of responses-- presumably in anticipation of the upcoming reward. On peak interval trials, when reward is withheld, the subject abruptly transitions back to a break some time after the reward availability time. The time the run starts is called the start time and the time it ends is called the stop time. These two events capture in its most granular form the moment the animal transitions to a different internal state, guided by its internal clock(s).
The average of these two times, the middle time, is a proxy for temporal accuracy on a single trial. The difference between the start and stop times is the spread, which serves as a proxy for temporal precision on a single trial. The start and stop times vary from one trial to the next and these two values are positively correlated (Gibbon and Church, 1990). The analysis of single trial responding and correlations between the within-trial events (i.e., start time, stop time, middle time, spread) has been crucial toward understanding temporal information processing and its translation into timed behavior (Gibbon and Church, 1990).
Studying the PI procedure will be helpful in understanding the brain’s clock based on the meaningful psychological parameters that can be estimated from the PI data. For instance, in Scalar Timing Theory (Gibbon et al., 1984), animals have a clock, a memory, and a threshold that determines when elapsed time from the clock is close enough to the stored memory of the interval. How each of the three work, and the precise relationships among them, are written as mathematical equations that can be rigorously tested and revised through experiments. The end result may be a model that closely fits the data, and explains why changes in the input affect behavior. For example, a drug that abruptly adjusts the start time without altering the stop times suggests a change to the threshold because a change in the speed of the clock or what’s stored in memory would affect both the start and stop times in a predictable way. Furthermore, based on the pattern of correlations between start times, stop times, middle times, and spread one can make inferences regarding the relative contributions of different sources of noise in the operation of the internal clock. For instance, the start and stop times would be positively correlated if the variability in timing behavior originates primarily from trial-to-trial variability in clock speed and/or memory representation whereas these two measures would be negatively correlated if the variability in timing behavior originates primarily from trial-to-trial variability in response thresholds. Such models, coupled with the phenotyping of disease models, could inform us about the neural and cognitive deficits that characterize different conditions associated with disrupted time perception.
Below, we summarize how the PI procedure can be used to study both the neurobiological basis of interval timing and the psychological implications for motivation and cognition. The studies summarized below are by no means exhaustive. Their aim is to demonstrate to readers the utility of the PI procedure in different contexts.
Lesion Studies
Lesion studies have primarily focused on the striatum, prefrontal cortex, hippocampus, and midbrain dopamine neurons. From these studies, Meck (2006) showed that lesioning the dorsal striatum and substantia nigra pars compacta led to flat, not bell-shaped, response distributions which were rescued by Levodopa after SNc, but not dorsal striatal lesions. Lesioning the nucleus accumbens did not significantly change the average response gradient. Interestingly, however, subjects with nucleus accumbens lesions were not sensitive to the reward rates (1/FI). This shows up as changes in the peak response rate, which is usually proportional to the reward rate.
Hippocampal lesions shift the peak earlier (see Meck et al., 1984 and 2013; Balcı et al., 2009b), which is sometimes attributed to forming, retrieving, or mediating temporal memories. Other studies showed that although dorsal hippocampal lesions caused earlier peak times (Yin and Meck, 2014; Tam et al., 2015), ventral hippocampal lesions caused later ones (Yin and Meck, 2014). These peak shifts are only visible on average (there is no peak in a break-run-break pattern). On individual trials, shifts in the peak time could show up as changes in the start time, the stop time, or both. In this case, the earlier shift caused by dorsal lesions seems primarily due to earlier start times; and the later shift seems primarily due to later stop times (Yin and Meck, 2014).
Finally, several studies investigated the effect of lesioning frontal cortex on PI performance. Olton (1989) and Olton et al. (1988) observed a later peak. More recently, Elcoro et al. (2014) showed that 6-Hydroxydopamine lesions of medial prefrontal cortex led to flatter response distributions, suggesting lower precision.
Pharmacological Studies
A number of studies have shown that acute administration of dopamine agonists such as methamphetamine and cocaine resulted in dose-dependent earlier peaks (Maricq et al., 1981; Meck, 1983; Abner et al., 2001; Çevik, 2003; Matell et al., 2006) and the acute administration of dopamine antagonists such as haloperidol resulted in later peaks (Meck, 1983 and 1996; Drew et al., 2003). Because these shifts are proportional to the Peak Interval, they are sometimes interpreted as mediating the speed of an internal stopwatch, speeding it up and slowing it down, respectively (Meck, 1983 and 1996). After chronic treatment with the same agents, these shifts normalize (looks more like baseline performance). Stopping the treatment shifts the peak time in the opposite direction compared to the normalized performance (e.g., a rightward shift after the termination of chronic treatments with dopamine agonists; Meck, 1983 and 1996).
A number of studies have shown that, at the single trial level, these peak shifts were actually shifts in the start times; the stop times were not affected by dopamine (e.g., Taylor et al., 2007; for review see Balcı, 2014), which may suggest that dopamine changes decision thresholds (possibly by altering motivational state of the subjects) rather than the clock speed. Another set of studies has shown that the effects of dopamine agonists is only observed early in training (less than 20-30 sessions), yet the same dose leads to flatter response gradients after extensive training (more than 70-180 sessions - Balcı et al., 2008; Cheng et al., 2007).
Fewer studies have investigated the effect of noradrenergic, serotonergic, and acetylcholinergic drugs. In one of these studies, atomoxetine,a norepinephrine reuptake inhibitor, led to more precise (narrower) response gradients (Balcı et al., 2008). 5-HT1A receptor agonist 8-OH-DPAT results in earlier peaks, which was abolished by an antagonist of the same receptor (WAY-100635), even though that same antagonist did not affect peak responding on its own (Asgari et al., 2006). Scopolamine, a cholinergic antagonist was found to flatten the response gradient (Abner et al., 2001; Balcı et al., 2008), which was rescued by physostigmine, a cholinergic agonist (Abner et al., 2001). When physostigmine given by itself, it reduced the trial-to-trial variability in stop times, but not start times (Abner et al., 2001; Balcı et al., 2008). Chlordiazepoxide, a GABAa receptor agonist, also disrupted temporal control over responding, too (Balcı et al., 2008). This set of results shows that drugs can profoundly affect the timing mechanism in all sorts of ways, perhaps promising to help uncover the neurobiological underpinnings of time perception and timed behavior.
Other Manipulations and Models
The response gradient also changes as a function of purely psychological factors. For instance, Roberts (1981) showed that feeding the animal right before testing (prefeeding) resulted in later peaks but this effect disappeared with further training. What held throughout training was that the response rate at its peak–the peak amplitude–decreased with prefeeding. In single trial analysis, motivational manipulations usually affect the start times without modulating stop times (even with prefeeding; see Figure 2b in Plowright et al., 2000). Similarly, start times shift earlier when brain stimulation is used as the reward (Ludvig et al., 2007), when different amounts of reward are used (Galtress et al., 2012a and 2012b), and after satiation (Balcı et al., 2010b).
The Peak Interval procedure has also been used to study aging, how age affects time perception and behavior (Lejeune et al., 1998; Church et al., 2014; Gür et al., 2019a and 2020), and as a screening tool for genetically modified animals that model human central nervous system disorders. These studies provide scientists both with information constraining our search for the timing mechanism and with new information about the disorder (e.g., Balcı et al., 2009a and 2010; Cordes and Gallistel, 2008; Garces et al., 2018; Ward et al., 2009 and 2011; Gür et al., 2019b and 2019c).
The peak interval procedure also has a number of limitations. For instance, peak responding tends to become habitual with extended training, which changes how different manipulations would affect the timing behavior (Cheng et al., 2007) and the typical training protocol (as presented here) has many different steps and requires training the animal over many sessions. Thus, it is important that the data of individual animals are studied on a daily basis to detect steady-state performance soon after it is established. Another possible solution is to delay habit formation by training animals on a dual peak interval procedure, where one response option (e.g., left lever) is associated with one interval and another response option (e.g., right lever) is associated with another interval (Balcı et al., 2010a). The active response option can be presented randomly in different trials or different blocks. This also allows the researchers to assess whether the scalar property is violated in their sample or a result of an experimental manipulation. The problem of sessions-long training is exacerbated by the fact that animals need to be food- or water-deprived for the test period, which requires paying extra attention to monitoring the weight and health of the animal and taking into consideration the developmental factors if the animals start being tested young. Depending on the total duration of testing, animals can be occasionally put on one- or two-day long adlib feeding. Furthermore, it might be difficult to estimate the timing performance parameters particularly with the single-trial analysis when the response rate is very low. This constitutes an analytical constraint when the experimental manipulation results in significant reductions in response rate or when the animal is not sufficiently motivated to respond. Often, trials that have less than a predetermined number of responses are excluded from the data analysis.
Materials and Reagents
- Subjects
Inbred strains of mice or rats can be used as subjects to minimize the variation within the test group. Whatever the species or strain, experimenters should confirm that the animal can identify the discriminative stimulus. For instance, because older C57Bl/6 mice have age-related auditory impairments (Idrizbegovic et al., 2003); use a visual one instead If they are used in the context of aging. - Reinforcement
Either liquid reinforcement such as condensed milk (e.g., Nestle Carnation® condensed milk; IsosourceStandard, Nestle Health Science), a sucrose solution, or dry pellets (e.g., BioServ Dustless Precision Pellets F0023) can be used as reinforcement during testing. Reinforcements should be kept in cool storage. Condensed milk should be used on the day the can is opened –spoiled reinforcement is not reinforcing. - Animal Feed
In the case of food restriction, subjects will usually require sufficient supplemental standard feeding after the test session (e.g., Bio-Serv, Rodent Diet). An industry standard is to keep their weights around 85% of the ad libitum weight. Growth charts can be obtained from the vendor, or from an in-house pilot study. With water restriction, the subjects will usually require sufficient supplemental water, too.
Equipment
- Operant Boxes
The Peak interval (PI) procedure is implemented in operant boxes (e.g., ENV-307W, Med Associates) with stainless steel grid floor (e.g., ENV-307W-GFW, Med Associates). Figure 1 illustrates one possible configuration of the operant box with two levers (e.g., ENV-312-2W, Med Associates), four receptacles that can be lit by LEDs for local stimuli (e.g., ENV-302RW, Med Associates). The head-entries to the receptacles can be detected by infrared detectors (e.g., ENV-313W, Med Associates). A speaker (ENV-324W, Med Associates) and a house light (e.g., ENV-315W, Med Associates) that can be used to generate global discriminative stimulus. For reinforcement, dry pellets can be delivered via pellet dispensers (e.g., ENV-203-20, Med Associates), liquid reinforcers can be delivered via dippers (e.g., ENV-302W-S, Med Associates).
Note: There are other manufacturers of modular operant boxes, which can also be used to run this protocol (e.g., Harvard Apparatus, Modular Operant/Behavior Box (Panlab); Lafayette Instruments; Mouse Modular Test Chamber, Model 80015NS).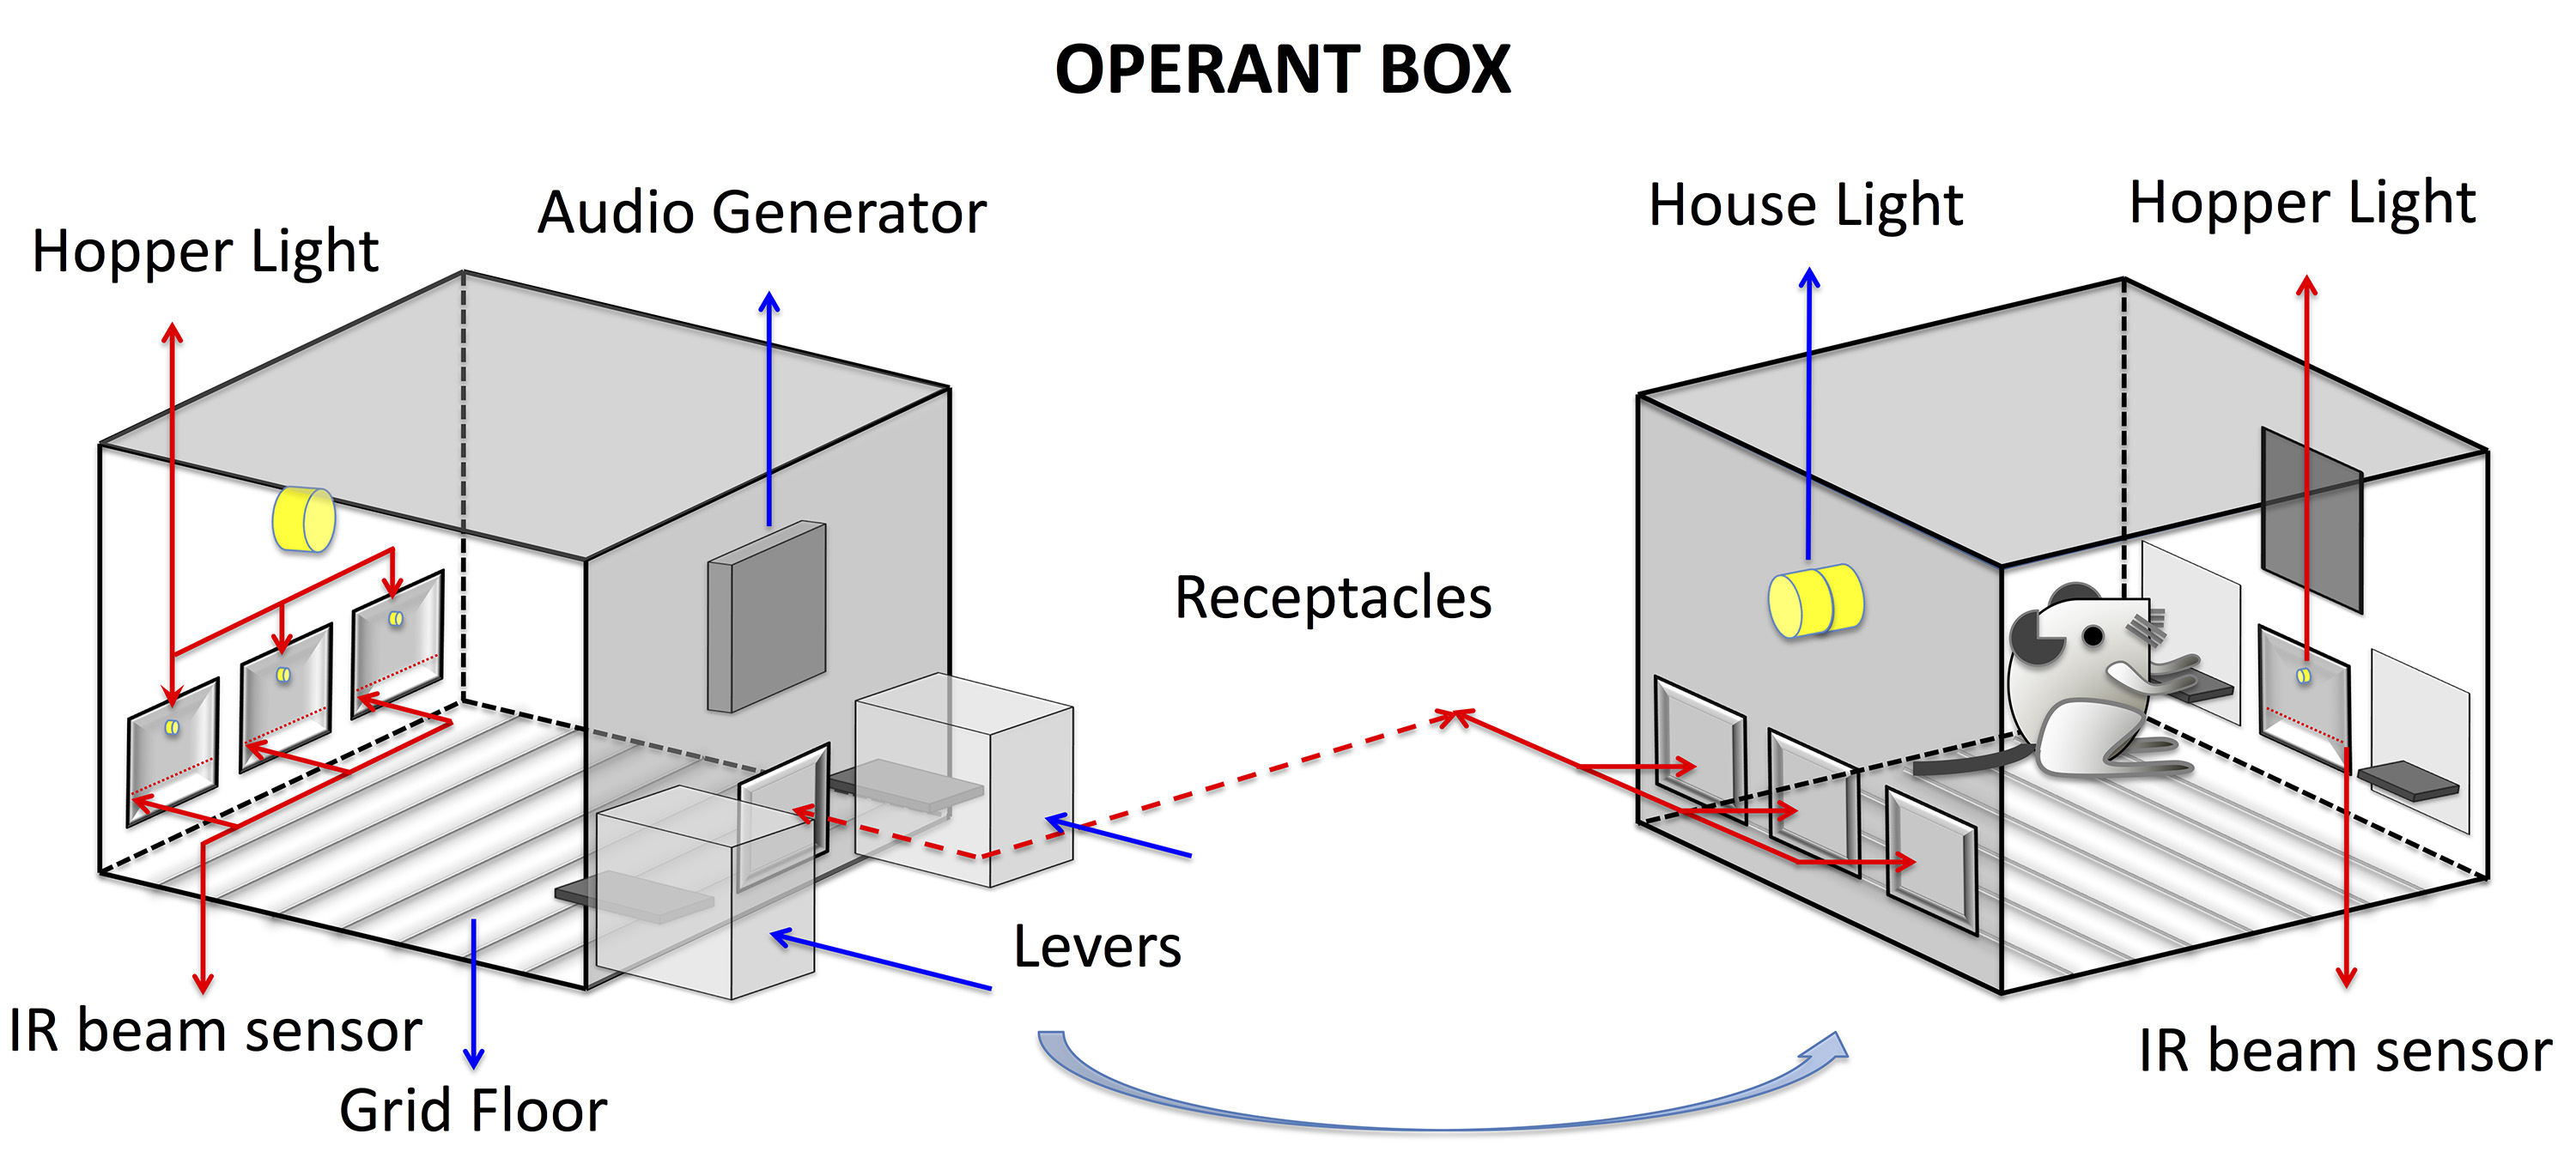
Figure 1. Illustration of a possible configuration of an operant box from two different angles - Sound Attenuating Cubicles
Ideally, operant boxes should be housed in sound attenuating cubicles (e.g., ENV-020M, Med Associates) to minimize the subject’s distraction by outside sources during testing (e.g., from other operant boxes, experimenter, etc.). Fans (e.g., ENV-375-F, Med Associates) in each cubicle can also help. They ventilate the cubicle, and their constant whirl and humming helps muffle outside noise. - Housing Cages
Animals can be kept in standard shoebox cages (e.g., conventional polypropylene cages). If animals are individually housed, supplemental food and water can be given directly in the housing cage. If animals are group-housed, supplements can be given to the subjects prior to group-housing to prevent possible aggression between animals (although sometimes, animals will not fight).
Software
- Operant boxes will be controlled either by commercially available software from the vendors of the operant boxes themselves (e.g., MedPC for Med-Associates or GraphicState for Coulbourne) or custom-built generic control software (e.g., Biopsychology Toolbox in Matlab Rose et al., 2008).
- Data Analysis can be easily conducted either with custom code or the freely available TSLib (for Matlab: https://github.com/CRGallistel/Contingency; for R: https://github.com/freestone-lab/TSLibrary), and can find guidance in Freestone and Balcı (2018, https://github.com/freestone-lab/timing_tasks.git).
Procedure
文章信息
版权信息
© 2020 The Authors; exclusive licensee Bio-protocol LLC.
如何引用
Balcı, F. and Freestone, D. (2020). The Peak Interval Procedure in Rodents: A Tool for Studying the Neurobiological Basis of Interval Timing and Its Alterations in Models of Human Disease. Bio-protocol 10(17): e3735. DOI: 10.21769/BioProtoc.3735.
分类
神经科学 > 行为神经科学 > 认知
神经科学 > 行为神经科学 > 实验动物模型
您对这篇实验方法有问题吗?
在此处发布您的问题,我们将邀请本文作者来回答。同时,我们会将您的问题发布到Bio-protocol Exchange,以便寻求社区成员的帮助。