

Measuring Cell Growth and Junction Development in Epithelial Cells Using Electric Cell-Substrate Impedance Sensing (ECIS)
使用电子细胞基质阻抗传感(ECIS)测量上皮细胞生长和连接发育
发布: 2020年08月20日第10卷第16期 DOI: 10.21769/BioProtoc.3729 浏览次数: 5536
评审: Yosuke SenjuAnonymous reviewer(s)
参见作者原研究论文
The authors used this protocol in:

Oct 2019
Advertisement


Abstract
Electric Cell-substrate Impedance Sensing (ECIS) is an automated method that can be used to quantify processes such as cell attachment, growth, migration and barrier functions (i.e., the properties of tight junctions). The method provides simultaneous information on cell number and tight junction function by detecting electric parameters of cells grown on electrodes. Samples are probed with small alternating current (AC) over a range of frequencies, and changes in capacitance and impedance are measured over time. Capacitance reflects the degree of electrode coverage by cells, that correlates with cell number, and can be used to assess cell proliferation or migration. Impedance values inform about barrier function. Obtaining real-time simultaneous information on these parameters is unique to this system and is of great value for addressing fundamental questions such as the role of tight junction proteins in cell growth and migration. This protocol describes the use of ECIS to follow cell growth and tight junction-dependent barrier generation in tubular epithelial cells. We used this method to explore how depleting claudin-2, a tight junction protein affects tubular cell growth and barrier function. During the process, cells are transfected with control or claudin-2-specific siRNA, and 24h later plated on electrodes. ECIS automatically collects information on cell growth and barrier as the monolayer develops. The data are initially analyzed using the ECIS software and exported into a graph software for further processing.
Keywords: Impedance sensing (阻抗传感)Background
Epithelial cells generate monolayers characterized by well-developed intercellular junctions. Input from the junctions determines cell behavior, including proliferation and migration. As junctions develop, cell proliferation and migration slows and then halts due to contact inhibition (McClatchey and Yap, 2012). Although the past decades rapidly augmented our understanding of the molecular mechanisms of proliferation and migration, many aspects of these processes, and the exact nature of contact inhibition remain incompletely defined. As cells establish a confluent layer, intercellular junctions, including tight junctions develop and mature, ensuring well-controlled paracellular permeability (barrier functions) (Zihni et al., 2016). Paracellular seal and permeability pathways are established by the claudin family of tight junction proteins (Tsukita et al., 2019). Interestingly, accumulating evidence suggests that in addition to their role as permeability regulators, many claudins also modulate proliferation and migration (Hagen, 2017; Venugopal et al., 2019). These roles, however, remain incompletely understood. Methods that follow barrier function and cell growth or migration simultaneously over time are crucial for obtaining new insights. Electric Cell-substrate Impedance Sensing (ECIS), that was developed by Applied BioPhysics offers this possibility. ECIS is an impedance-based, automated method that allows the quantification of various aspects of cell behavior through detection of electric properties (Wegener et al., 2000). The cells are grown in chambers containing small gold electrodes (referred to as arrays), and the system continuously probes the electrodes using small, biologically inert alternating current. A range of AC frequencies from 62.5-64,000 Hz is used to measure impedance and capacitance across the electrodes over time. The basis of the measurement is that the current can flow through the cells or under and between them, and the magnitude of resistance of these compartments depends on the frequency of the AC current applied. Thus, specific frequencies can be used to probe different parameters, and this can be utilized to follow various aspects of cell behavior in the same sample (Stolwijk et al., 2015; Wegener et al., 2000). During measurment the system measures capacitance and impedance at the full frequency range, and the user can select the required parameters during analysis. Capacitance detected using high AC frequency reflects coverage of the electrode, with little influence from other parameters. Capacitance data collected in a typical experiment are shown in Figure 1A (top graph). This demonstrates that following seeding cells generate an insulating layer on the electrodes that is reflected by a drop in capacitance. Capacitance reaches its minimum and stabilizes when a fully confluent layer is generated. The initial rate of drop reflects cell attachment, that is completed by 3h. After this time, the rate of drop reflects cell growth. Figure 1A bottom graph shows the parallel changes in impedance (Z) values measured at low AC frequencies. In epithelial cells with well-developed tight junctions, impedance measured at 500 Hz or lower frequencies reflects predominantly the properties of the paracellular space. Impedance increases as cells reach confluence and tight junctions develop. Many epithelial cells show an increase in the Z value, followed by a decrease as junctions mature (Amoozadeh et al., 2017). Interestingly, simultaneous measurement of capacitance and impedance reveals that tight junction development and maturation does not stop as confluence is reached (Amoozadeh et al., 2018). More detailed analysis to separate different components of impedance can be performed using mathematical modelling, built into the software, which can be advantageous in cells with weaker paracellular resistance (e.g., endothelial cells) (Wegener et al., 2000; Stolwijk et al., 2015; García et al., 2019). Although the theory of mathematical modelling in ECIS is complex, the measurement itself is relatively straight forward, and simple analysis can provide valuable information. ECIS is also equipped with an elevated field module for wounding of the layer, and capacitance values can be used for an automated cell migration assay (not discussed in this protocol) (Szaszi et al., 2012).
The advantages of ECIS are as follows. It is an automated, continuous, real-time, label-free detection method. Since the arrays are housed in a tissue culture incubator, the environment is controlled and any measurement artifacts stemming from changes in temperature and CO2 levels are eliminated. In comparison with other methods that follow cell growth or migration, the key benefit of ECIS is the ability to simultaneously detect transepithelial resistance (TER), i.e., barrier function and cell growth or migration (Kakiashvili et al., 2011; Amoozadeh et al., 2015 and 2017; Stolwijk et al., 2015; Láng et al., 2017) (Figure 1). This can be valuable for correlating effects of various treatments on these highly interdependent parameters, thereby providing new insights into fundamental cell biological questions.
This protocol describes the use of ECIS to follow tubular epithelial cell growth, and the development of barrier via formation of the tight junctions. We used this protocol to assess the development of cell confluence (Amoozadeh et al., 2018) and to follow effects of silencing of a tight junction protein, claudin-2 rate on proliferation rate and barrier function (Dan et al., 2019). Silencing claudin-2 alters both barrier function (resulting in elevated resistance) (Amoozadeh et al., 2018) and cell growth (reducing proliferation) (Dan et al., 2019). Simultaneous detection of these parameters reveals both effects. We found that claudin-2 silencing slows the development of confluency, but does not prevent it, and claudin-2 depleted cells generate a barrier which is tighter that the control due to absence of the channel forming claudin-2. Adaptation of the method for other cell types and proteins requires optimization of the seeding conditions, electrode coating and transfection parameters. We provide notes on these issues to direct the reader.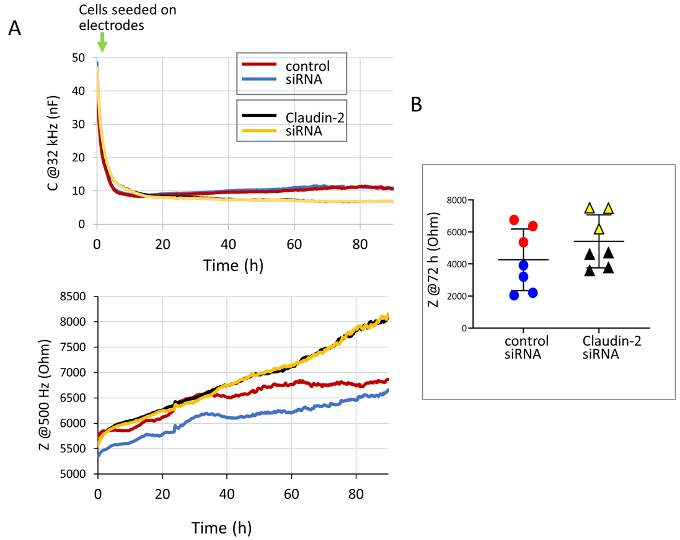
Figure 1. Capacitance and impedance measurements of LLC-PK1 cells with or without claudin-2 silencing. A. Exported graphs showing simultanously detected changes in capacitance at 32 kHz (reflecting cell growth) and impedance (z) at 500 kHz (reflectig barrier). LLC-PK1 cells were transfected using control or claudin-2-specific siRNA and electrical properties were measured using ECIS, as described in the protocol. B. Impedance (z) was determied at 72 h after seeding of cells in two different experiments. The data from the same experiment are indicated by black and red for experiment #1 and blue and green for experiment #2 (control and claudin-2 siRNA, respectively).
Materials and Reagents
- Clear tissue culture-treated 6-well microplates (Corning Costar®, Millipore-Sigma, catalog number: CLS3513 )
- Microcentrifuge tubes (1.5 ml) (Fisherbrand, catalog number: 2043-05408129 )
- CountessTM Cell Counting Chamber Slides (Thermo Fisher, Invitrogen, catalog number: C10228 )
- Cell line: LLC-PK1 kidney tubule epithelial cell line (European Collection of Authenticated Cell Cultures, catalog number: 86121112 )
- Cell culture media and reagents:
Dulbecco's Modified Eagle Medium (D-MEM), low glucose, with L-glutamine and 110 mg/L sodium pyruvate (Gibco, Thermo Fisher, catalog number: 11885084 )
Fetal Bovine Serum (Gibco, Thermo Fisher, catalog number: 12483-020 )
Penicillin-Streptomycin, 100x, sterile-filtered, cell culture tested (Sigma-Aldrich, catalog number: P-4333. 25300062 )
Trypsin-EDTA (0.05% Trypsin with EDTA 4Na) (Thermo Fisher, Gibco, catalog number 25300062 )
Opti-MEMTM I Reduced Serum Medium for transfection (Thermo Fisher, Gibco, catalog number: 31985088 ) - Trypan Blue Stain (0.4%) (Gibco, catalog number: 15250061 ) for use with the CountessTM Automated Cell Counter (Invitrogen, Thermo Fisher, catalog number T10282)
- LipofectamineTM RNAiMAX Transfection Reagent (Invitrogen, Thermo Fisher, catalog number 13778150)
- Two custom-designed siRNAs targeting porcine claudin-2 (Thermo Fisher/Dharmacon) (sequence #1, CCAGAACTCTCGCGCCAAA, and #2 CCCTGATAGCTGGGATCAT)
- SilencerTM Negative Control No. 1 siRNA (non-related (NR)) siRNA (Applied Biosystems/Ambion, Thermo Fisher, catalog number: AM4611 )
- ECIS electrode array, type: 8W10E or 8W10E+ PET (Applied Biophysics, catalog number: 8W10E or 8W10E+ )
- L-cysteine (Millipore-Sigma-Aldrich catalog number: C7352 )
- 10 mM L-cysteine solution for electrode stabilization (see Recipes)
Equipment
- ECIS® Z-Theta instrument with 16-well array module housed in incubator (Applied Biophysics)
- CountessTM Automated Cell Counter (Thermo Fisher, Invitrogen, catalog number C10228 )
- Tissue culture equipment (sterile hood, incubator, centrifuge)
Software
- ECIS Zθ software
- Graph software (e.g., Excel or GraphPad)
Procedure
文章信息
版权信息
© 2020 The Authors; exclusive licensee Bio-protocol LLC.
如何引用
Readers should cite both the Bio-protocol article and the original research article where this protocol was used:
- Anwer, S. and Szászi, K. (2020). Measuring Cell Growth and Junction Development in Epithelial Cells Using Electric Cell-Substrate Impedance Sensing (ECIS). Bio-protocol 10(16): e3729. DOI: 10.21769/BioProtoc.3729.
- Dan, Q., Shi, Y., Rabani, R., Venugopal, S., Xiao, J., Anwer, S., Ding, M., Speight, P., Pan, W., Alexander, R. T., Kapus, A. and Szászi, K. (2019). Claudin-2 suppresses GEF-H1, RHOA, and MRTF, thereby impacting proliferation and profibrotic phenotype of tubular cells. J Biol Chem 294(42): 15446-15465.
分类
癌症生物学 > 增殖信号转导 > 细胞生物学试验
细胞生物学 > 细胞分离和培养 > 单层培养
您对这篇实验方法有问题吗?
在此处发布您的问题,我们将邀请本文作者来回答。同时,我们会将您的问题发布到Bio-protocol Exchange,以便寻求社区成员的帮助。