

Characterizing the Two-photon Absorption Properties of Fluorescent Molecules in the 680-1300 nm Spectral Range
680-1300 nm波段荧光分子双光子吸收特性的表征
发布: 2020年01月20日第10卷第2期 DOI: 10.21769/BioProtoc.3498 浏览次数: 5040
评审: Anonymous reviewer(s)
参见作者原研究论文
The authors used this protocol in:

May 2019
Advertisement


Abstract
Two-photon laser scanning microscopy (2PLSM) is a state-of-the-art technique used for non-invasive imaging deep inside the tissue, with high 3D resolution, minimal out-of-focus photodamage, and minimal autofluorescence background. For optimal application of fluorescent probes in 2PLSM, their two-photon absorption (2PA) spectra, expressed in absolute cross sections must be characterized. Excitation at optimum wavelength will make it possible to reduce the laser power and therefore minimize photodamage. Obtaining 2PA spectra and cross sections requires correcting the two-photon excited fluorescence signals for a combination of laser properties, including the beam spatial profile, pulse duration, and absolute power, at each wavelength of the tuning range. To avoid such tedious day-to-day laser characterization required in the absolute measurement method, a relative method based on independently characterized 2PA reference standards is often used. By carefully analyzing the available literature data, we selected the most reliable standards for both the 2PA spectral shape and cross section measurements. Here we describe a protocol for measuring the 2PA spectral shapes and cross sections of fluorescent proteins and other fluorophores with the relative fluorescence method using these reference standards. Our protocol first describes how to build an optical system and then how to perform the measurements. In our protocol, we use Coumarin 540A in dimethyl sulfoxide and LDS 798 in chloroform for the spectral shape measurements to cover the range from 680 to 1300 nm, and Rhodamine 590 in methanol and Fluorescein in alkaline water (pH 11) for the absolute two-photon cross section measurements.
Keywords: Two-photon absorption (双光子吸收)Background
Two-photon laser scanning microscopy (2PLSM) is an advanced imaging technique used in neuroscience, cancer biology, immunology, and other areas of biosciences (Denk et al., 1990; Xu et al., 1996; Zipfel et al., 2003; Helmchen and Denk, 2005). Compared to fluorescence confocal microscopy, which is based on one-photon excitation, 2PLSM provides deeper interrogation of tissues with less out-of-focus photodamage and less autofluorescence background. For optimal application of 2PLSM, information about the brightness of fluorescent probes upon two-photon excitation at different laser wavelengths (i.e., two-photon absorption and excitation spectra) is necessary. That information helps researchers choose the right probe(s) for a particular application (e.g., the brightest probe excitable with optimum wavelength within the near-infrared tissue transparency window, or a combination of probes for multicolor imaging). There are several methods to measure the two-photon absorption spectra and absolute cross section values (Rumi and Perry, 2010), including a direct one, based on nonlinear transmission (z-scan), and indirect ones, such as two-photon excited fluorescence (2PEF). Here we choose the 2PEF approach because it is much more sensitive, requiring much lower concentration of fluorophores, and all the probes used in 2PLSM are intrinsically fluorescent. In contrast to one-photon (1P) excitation, two-photon (2P) excitation efficiency strongly depends on the laser beam spatial and (pulse) temporal profiles. Since these characteristics usually vary from wavelength to wavelength across the laser tuning range, careful corrections for these variations are necessary for extracting pure molecular two-photon absorption (2PA) spectral shape and absolute cross section values (σ2). To obtain these properties one can use either an absolute or a relative method. In the absolute measurement method, the laser properties such as power, pulse duration and shape, and spatial beam profile (i.e., intensity dependence on x, y, and z coordinates inside the sample solution) must be characterized at each wavelength. Then, a function representing a combination of these parameters at each laser wavelength should be constructed and applied for correction of raw data. The spectra obtained using this absolute method (Xu and Webb, 1996; Albota et al., 1998; Makarov et al., 2008; Makarov et al., 2011; de Reguardati et al., 2016) can be considered as reference standards for application in relative method.
To avoid tedious characterization of laser properties on a day-to-day basis (necessary in absolute method of measurement), we use in our protocol a relative method based on previously characterized reference standards. In this method, the raw 2PA spectra are collected for the sample, F2,S(λ), and for the reference, F2,R(λ), (indices S and R are used for sample and reference, respectively, here and throughout) in the same conditions of excitation, and then the correction function fc(λ) is calculated using the known 2PA spectrum of the reference A2PA,R(λ) and its raw spectrum F2,R(λ):![]()
This correction function is then applied to the raw spectrum of the sample to get its corrected, “true” spectrum (Makarov et al., 2008), eq. (1):![]()
A similar approach is used for evaluating the two-photon cross section values. In this case, the raw fluorescence signal of the sample, measured at a particular excitation wavelength λex is corrected for a combination of laser properties by using a 2PA cross section reference standard measured at the same excitation and fluorescence registration conditions.
Suppose F2,S(λex, λreg) and F2,R(λex, λreg) are the two-photon fluorescence signals recorded in a narrow spectral range around registration wavelength, λreg, with the same excitation conditions for the sample and the reference. To calculate the 2PA cross section, one needs to normalize these signals to the fluorescence quantum efficiencies and concentrations of signal and reference, respectively. Let φS(λreg) and φR(λreg) be the differential quantum efficiencies measured at the same wavelength with the same spectral bandwidth as F2 signals, but with one-photon excitation. Using a narrow spectral range in fluorescence collection avoids corrections to the spectral sensitivity of the detection system. CS and CR are the corresponding concentrations, used in the two-photon experiment, and calculated using Beer’s law: C = ODmax/εmax where ODmax is the peak optical density and εmax is the peak extinction coefficient. Then the two-photon cross section of the sample reads (Makarov et al., 2008), eq. (2):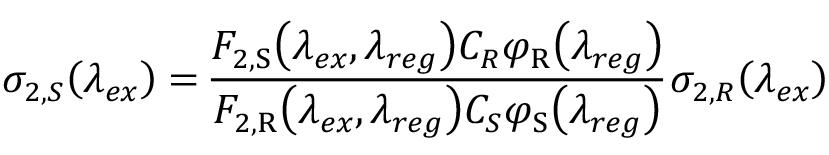
where σ2,R (λex ) is the cross section of the reference.
Although the literature data accumulated over the last few decades for the reference standards start to converge for some of them, significant deviations are still present for the others. The relative method of 2PA characterization was used previously, but the detailed descriptions of the measurement details were often missing and selection of standards was arbitrary, resulting in large variations in the results between different labs. By carefully analyzing the available literature data, we selected the most reliable standards for both the 2PA spectral shape and cross section measurements (see Notes). In our protocol, we use Coumarin 540A in DMSO (de Reguardati et al., 2016) and LDS 798 in chloroform (Makarov et al., 2011) for the spectral shape measurements to cover the range from 680 to 1300 nm. We use Fluorescein in alkaline water (pH 11) (Xu et al., 1995; Xu and Webb, 1996; Makarov et al., 2008; de Reguardati et al., 2016) and Rhodamine 6G in methanol (Hermann and Ducuing, 1972; Bradley et al., 1972; Penzkofer and Leupacher, 1987; Albota et al., 1998; Makarov et al., 2008; de Reguardati et al., 2016) for the absolute σ2 measurements at selected wavelengths. The standards for the shape were selected because their reported 2PA and 1PA spectra closely overlap, signifying that the reported 2P spectral shapes measurements were reliable. Also, the spectra are very broad and structureless, thus introducing fewer potential errors due to a finite laser spectral shape and small shifts in central wavelength. The standards for the σ2 were selected based on a close match between two to five independent measurements at a selected wavelength. Using this protocol will make it possible for researchers to characterize the absolute 2PA spectra of new fluorescent probes and sensors in a standardized way and with high reproducibility.
Our optical setup (Figure 1) consists of an automatically tunable (with custom LabView program) femtosecond laser (InSight DeepSee, Spectra Physics) coupled with a photon counting spectrofluorimeter (PC1, ISS). The laser output beam (100-120 fs pulse duration, 680-1,300 nm tuning range, 80 MHz repetition rate, 0.6-1.3 W average power, horizontal polarization) was first attenuated to 100-200 mW and made vertically polarized with a system of a half-wave plate and a Glan-laser polarizer. It then was filtered (with a 645 long pass filter) to remove all residual visible light and was directed with 4 mirrors (M1-M4) to the entrance aperture of the spectrofluorimeter. We use a continuous variable neutral density filter wheel between mirrors M3 and M4 to further attenuate the power to a particular value needed in the experiment. A flip mirror (FM) is used to send an attenuated beam to a power meter (Melles Griot) for monitoring laser power before the sample.
A few re-arrangements were made to the spectrofluorimeter optics to adjust it for the 2PEF measurements. The excitation lamp source (not shown), excitation monochromator (not shown), optional beamsplitter, and two collimating lenses were removed from the excitation path. The neutral density motorized filter wheel with 4 slots (ISS) was added and connected to the step motor of the filter wheel of the left fluorescence registration channel. A NIR achromatic lens, f = 45 mm (Edmund Optics) was inserted into an optical tube (ISS) at the end of excitation path. This lens focuses the laser beam onto the sample, held in a 3 x 3 mm optical cuvette (Starna Cells). To avoid absorption of the laser by the solvent, fluorescence is collected from the first 0.7 mm layer of solution (Figure 1B). To minimize thermal lensing effects, all dye solutions are stirred during the measurement (Figure 1B). The left fluorescence detection channel (without monochromator) is used for measurements relative two-photon excitation spectra, because in this case only integrated fluorescence signal is required, and the right fluorescence channel (with monochromator) is used for measuring the two-photon cross sections.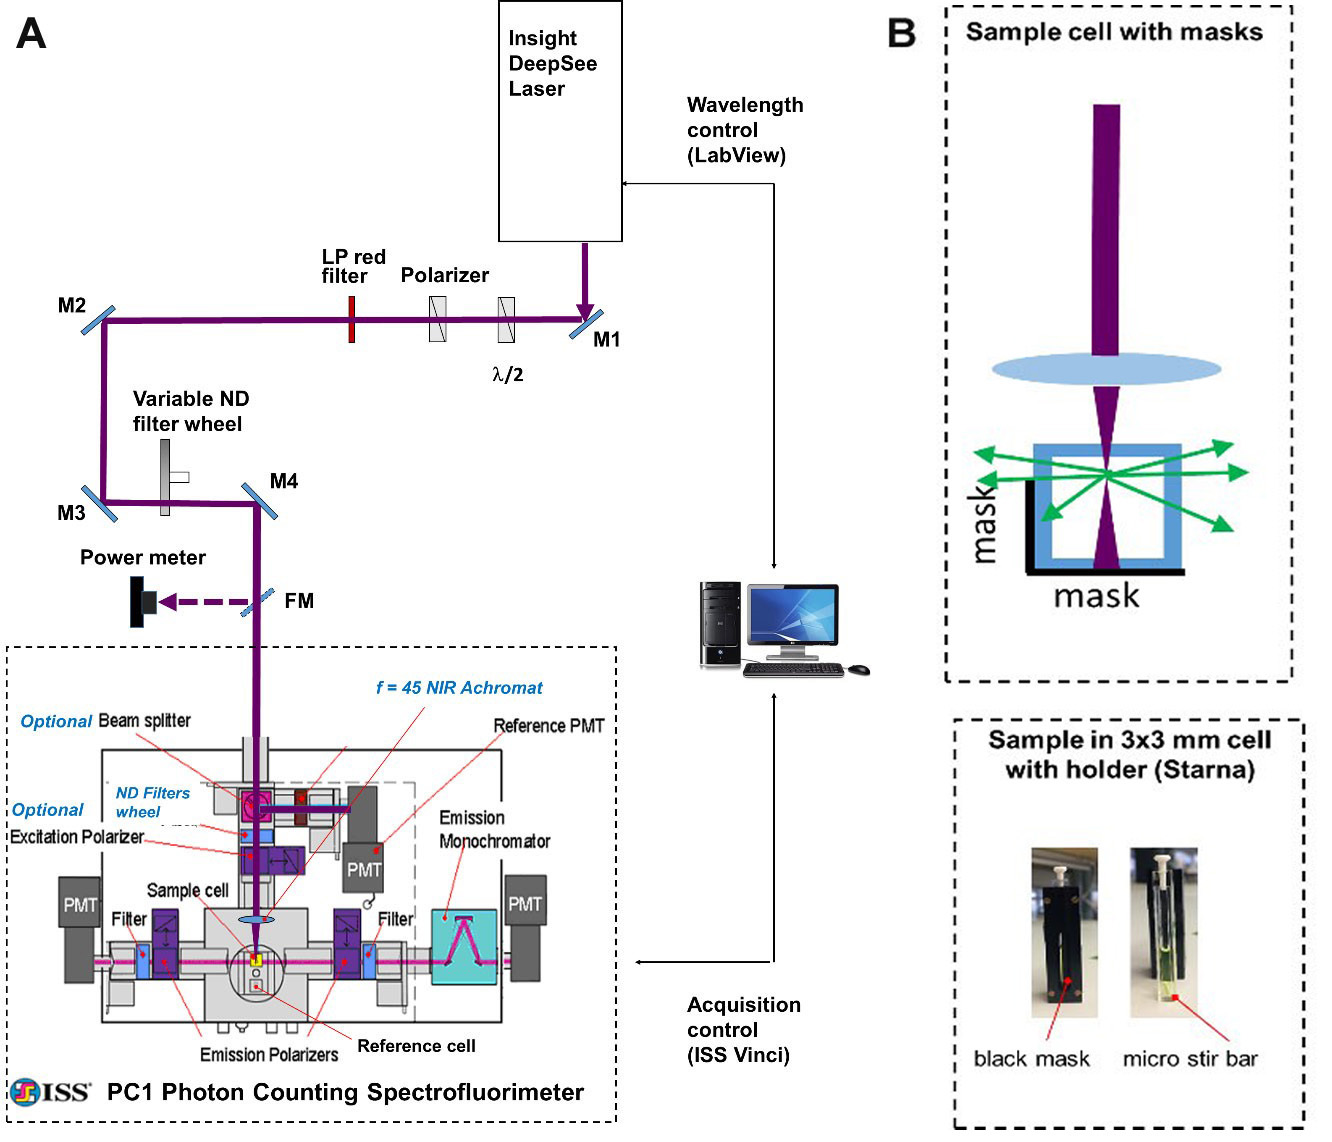
Figure 1. Schematic of experimental setup. A. General layout. A femtosecond InSight DeepSee (SpectraPhysics) laser beam is steered with a system of mirrors (M1-M4) to the entrance aperture of a photon counting spectrofluorimeter PC1 (ISS). Automatic wavelength-to-wavelength tuning of the laser is controlled with a custom LabView program and the fluorescence signal acquisition is accomplished with the ISS Vinci software. B. Top: Schematic of the geometrical arrangement of the 3 x 3 mm cuvette with the sample solution (top view). The laser beam (dark red) is focused with an f = 45 mm lens into a frontal part of the solution. The fluorescence is collected through a side, directed to the left emission channel through a mask. The mask is a narrow rectangle of black paper fixed inside the cuvette holder that allows only the fluorescence from the front 0.7 mm of solution to get out. Bottom: A cuvette with a sample solution inside the holder is shown from the side of the holder having a mask (left image); the same cuvette taken out of holder having a micro stir bar on its bottom (right image).
Materials and Reagents
- 15 ml screw cap glass vials (Kesell, catalog number: BLP025, package of 8)
- 200 µl gel pipette tips (Fisher Scientific, BasixTM, catalog number: 13-611-116)
- Thick black construction paper
- Coumarin 540A dye (Exciton, catalog number: 05450)
- LDS 798 dye (Exciton, catalog number: 07980)
- Rhodamine 590 dye (Exciton, catalog number: 05901)
- Fluorescein sodium salt, analytical standard (Sigma-Aldrich, catalog number: 30181-100MG)
- Chloroform, CHCl3 (Fisher Scientific, HPLC grade, catalog number: C607-1)
- Deuterated chloroform, CDCl3 (Sigma-Aldrich, catalog number: 151858-10x0.75ML)
- Dimethyl sulfoxide, C2H6OS (Fisher Chemical, Certified ACS grade, catalog number: 151874-10x0.75)
- Methanol, CH3OH (Fisher Chemical, HPLC grade, catalog number: A452-4)
- LDS 798 dye solution in CHCl3:CDCl3 (1:2) mixture (see Recipes)
- Coumarin 540A dye solution in DMSO (see Recipes)
- Rhodamine 590 dye solution in methanol (see Recipes)
Equipment
- Optical Table: Sealed Hole Table Top with Tuned Damping (Newport, model: RS 2000TM), set on High Performance Laminar Flow Isolators (4 pieces) (Newport, model: S 2000)
- Femtosecond pulsed laser (InSight DeepSee Dual, Newport Spectra-Physics)
- Photon Counting Spectrofluorimeter (ISS, model: PC1TM)
- Silver coated mirrors (Newport, model: New Focus 5103 (5 pcs.))
- Stainless steel optical posts (Thorlabs, catalog numbers: TR3 (4pcs.) and TR4 (7 pcs.))
- Standard ½” diameter, 3” long postholders (Thorlabs, catalog number: PH3 (11 pcs.))
- Standard ½” diameter 1” long postholder (Thorlabs, catalog number: PH1 (1pc.))
- Post holder bases (Thorlabs, catalog numbers: BA1 (11 pcs.) and BA1S (1pc.))
- Bolts and nuts. ¼”–20 Hardware Kit (Thorlabs, catalog number: HW-KIT2)
- New Focus mirror mount (Newport, catalog number: 9773 (5 pcs.))
- Flipper Optic Mount (Newport, model: New Focus 9891)
- Mounted achromatic half wave plate (690-1,200 nm) (Thorlabs, catalog number: AHWP10M-980)
- Rotation Mount for Ø1" Optics (Thorlabs, catalog number: RSP1 (2 pcs.))
- Unmounted Glan-Laser Polarizer, Ø10 mm CA, Uncoated (Thorlabs, catalog number: GL10P)
- SM1 Lens Tube Mount for 8 mm and 10 mm Mounted Polarizing Prisms (Thorlabs, catalog number: SM1PM10)
- Mounted Continuously Variable ND Filter, Ø50 mm, OD: 0.04-4.0, ARC: 650-1,050 nm (Thorlabs, catalog number: MDC-50C-4M-B)
- Broadband Energy/Power Meter (Melles-Griot, Model 13PEM001)
- 25 mm Dia. x 45 mm FL, NIR II Coated, Achromatic Lens (Edmund Optics, model: ACH-NIR 25 x 45 NIR-II, Stock: 45-802)
- 22 mm-to-25 mm inner diameter lens tube adaptors, ISS Accessory, 2 pieces
- ND New Focus reflective filters (Newport, catalog numbers: 5240 (OD 1), 5235 (OD 0.5), and 5233 (OD 0.3))
- 4-slot filter wheel with a stepper motor, ISS Accessory
- Short pass filters, 633/SP (Semrock, catalog number: BSP01-633R-25), 680/SP (Semrock, catalog number: FF01-680/SP-25), 694/SP (Semrock, catalog number: FF02-694/SP-25), 745/SP (Semrock, catalog number: FF01-745/SP-25), 770/SP (Semrock, catalog number: FF01-770/SP-25)
- Long pass filter 645/LP (Thorlabs, catalog number: FGL 645)
- RS 232 Serial cable (15 ft)
- Micro, square, stopper top special optical glass cuvettes, 3 x 3 mm (Starna Cells, catalog number: 23-3.45-SOG-3, quantity 6)
- 3-mm SOG cuvette adaptor holder (Starna Cells, catalog number: FCA3, quantity 4)
- 1 cm standard glass fluorometer rectangular cells (Starna Cells, catalog number: 23-G-10, quantity 4)
- Micro spinbar magnetic stir bar, 5 x 1 mm (Thomas Scientific, catalog number: 1207Q08, quantity 6)
- UV/Vis spectrophotometer (PerkinElmer, LAMBDA 950)
- Luminescence Spectrometer (PerkinElmer, LS55)
- 200 µl pipette (Gilson, model: Pipetman Classic P200, catalog number: F123601)
Software
- OriginPro 2017 (OriginLab, https://www.originlab.com)
- Vinci 3 (ISS, http://www.iss.com/)
- LabView2018 (National Instruments, https://www.ni.com)
Custom Labview program for scanning the laser wavelength could be obtained by sending an e-mail request to mikhail.drobijev@montana.edu
Procedure
文章信息
版权信息
© 2020 The Authors; exclusive licensee Bio-protocol LLC.
如何引用
Drobizhev, M., Molina, R. S. and Hughes, T. E. (2020). Characterizing the Two-photon Absorption Properties of Fluorescent Molecules in the 680-1300 nm Spectral Range. Bio-protocol 10(2): e3498. DOI: 10.21769/BioProtoc.3498.
分类
生物物理学 > 显微技术 > 双光子激光扫描显微镜
您对这篇实验方法有问题吗?
在此处发布您的问题,我们将邀请本文作者来回答。同时,我们会将您的问题发布到Bio-protocol Exchange,以便寻求社区成员的帮助。