

Immunofluorescence-based Determination of Centrosome Number in Tissue Samples
基于免疫荧光法的组织样本中心体数目确定

发布: 2019年10月20日第9卷第20期 DOI: 10.21769/BioProtoc.3396 浏览次数: 4809
评审: Samantha E. R. DundonSander FrankManasa Chanduri
参见作者原研究论文
The authors used this protocol in:
Mar 2019
Advertisement


Abstract
Centrosome numerical abnormalities have been reported in a variety of tumors. Centrosome numbers in cancer cells display both inter-tumor and intra-tumor heterogeneity. The over production of centrosomes (centrosome amplification) is unique in cancer cells and is a promising target for therapy. Thus, a method to quantify centrosome numbers on a single cell level is needed. Here, we describe a protocol to quantify centrosome numbers in formalin fixed paraffin embedded (FFPE) tissue samples by multiplexing antibodies to define bona fide centrosomes and cell borders. Centrosomes in single cells are identified using high resolution immunofluorescent microscopy with Z-sectioning. This protocol is easy to perform and has been used to quantify centrosome numbers on a single cell level in a variety of human tissue samples.
Keywords: Centrosome (中心体)Background
The centrosome is the major microtubule-organizing center in cells and is crucial in defining mitotic spindle poles and forming cilia (Conduit et al., 2015). A centrosome consists of a pair of centrioles that serve as the duplicating elements of the centrosome and organize surrounding layers of pericentriolar material (PCM), a protein matrix with microtubule-nucleating activity (Bettencourt-Dias and Glover, 2007; Lawo et al., 2012). Centrosome numerical abnormalities, especially centrosome amplification, have been reported to be commonly present in a variety of human tumors and are correlated with advanced tumor grade, metastasis, recurrence, and poor survival (Bettencourt-Dias et al., 2011; Chan, 2011; Godinho and Pellman, 2014; Gonczy, 2015). Furthermore, centrosome numbers display both inter-tumor and intra-tumor heterogeneity in a broad range of tumors (Chan, 2011). Thus, a method to accurately quantify centrosome numbers on a single cell level in human tissue sample is useful to identify cancer cells with centrosome amplification, to study tumor heterogeneity, and to identify patients that might benefit from therapies that target cells with centrosome amplification.
Human centrioles are approximately 450-500 nm in length with a diameter of 200-250 nm (Gonczy, 2012; Greenan et al., 2018). Currently, centrosome quantification mainly relies on microscopy. Electron microscopy has been used as an accurate method to quantify centrosome numbers (Lingle et al., 1998). Super-resolution microscopy is another powerful way to study human centrosome structures (Sonnen et al., 2012). However, both electron microscopy and super-resolution microscopy require careful sample preparation and can be too laborious for quantifying centrosomes in a large number of cells and clinical tissue samples. Thus, most studies use high resolution microscopy like confocal and deconvolution microscopy. Further, the selection of centrosome markers is critical for accurate quantification. Most previous studies rely on PCM proteins like γ-Tubulin and pericentrin as centrosome markers, and centrosome numbers were quantified by counting PCM foci. However, PCM proteins are highly dynamic during centrosome assembly and can form assemblies or fragmentation without centrioles; they are not representative as bona fide centrosomes (Woodruff et al., 2014). Therefore, quantifying accentriolar PCM foci can lead to false positive results as centrosome amplification. On the other hand, cancer cells with centrosome amplification often undergo centrosome clustering during mitosis (Ganem et al., 2009; Silkworth et al., 2009). This leads multiple centrosomes in close proximity to each other and to appear as single PCM foci, which can result in false negative detection of centrosome numbers.
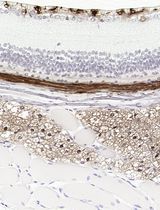
We have established a method using both centriolar protein CEP135 and PCM protein γ-Tubulin together as centrosome markers. We multiplexed centrosome markers with cell-cell junction markers to quantify centrosomes on a single cell level by high resolution microscopy (Wang et al., 2019a). We have tested different centriolar and cell-cell junction markers. Cell-cell junction proteins like E-Cadherin and α6 integrin are used to distinguish single cells from the neighbor cells and to identify the whole cell volume (Figure 1A). Foci with both centriolar proteins and PCM proteins are considered as centrosomes. Using this method, we have successfully performed centrosome quantification on a variety of normal and cancer tissues (Wang et al., 2019a; Wang et al., 2019b). Further, this method can be used to detect cells with centrosome amplification in both interphase and mitotic cells (Figure 1B). Here, we describe a detailed protocol to perform this method.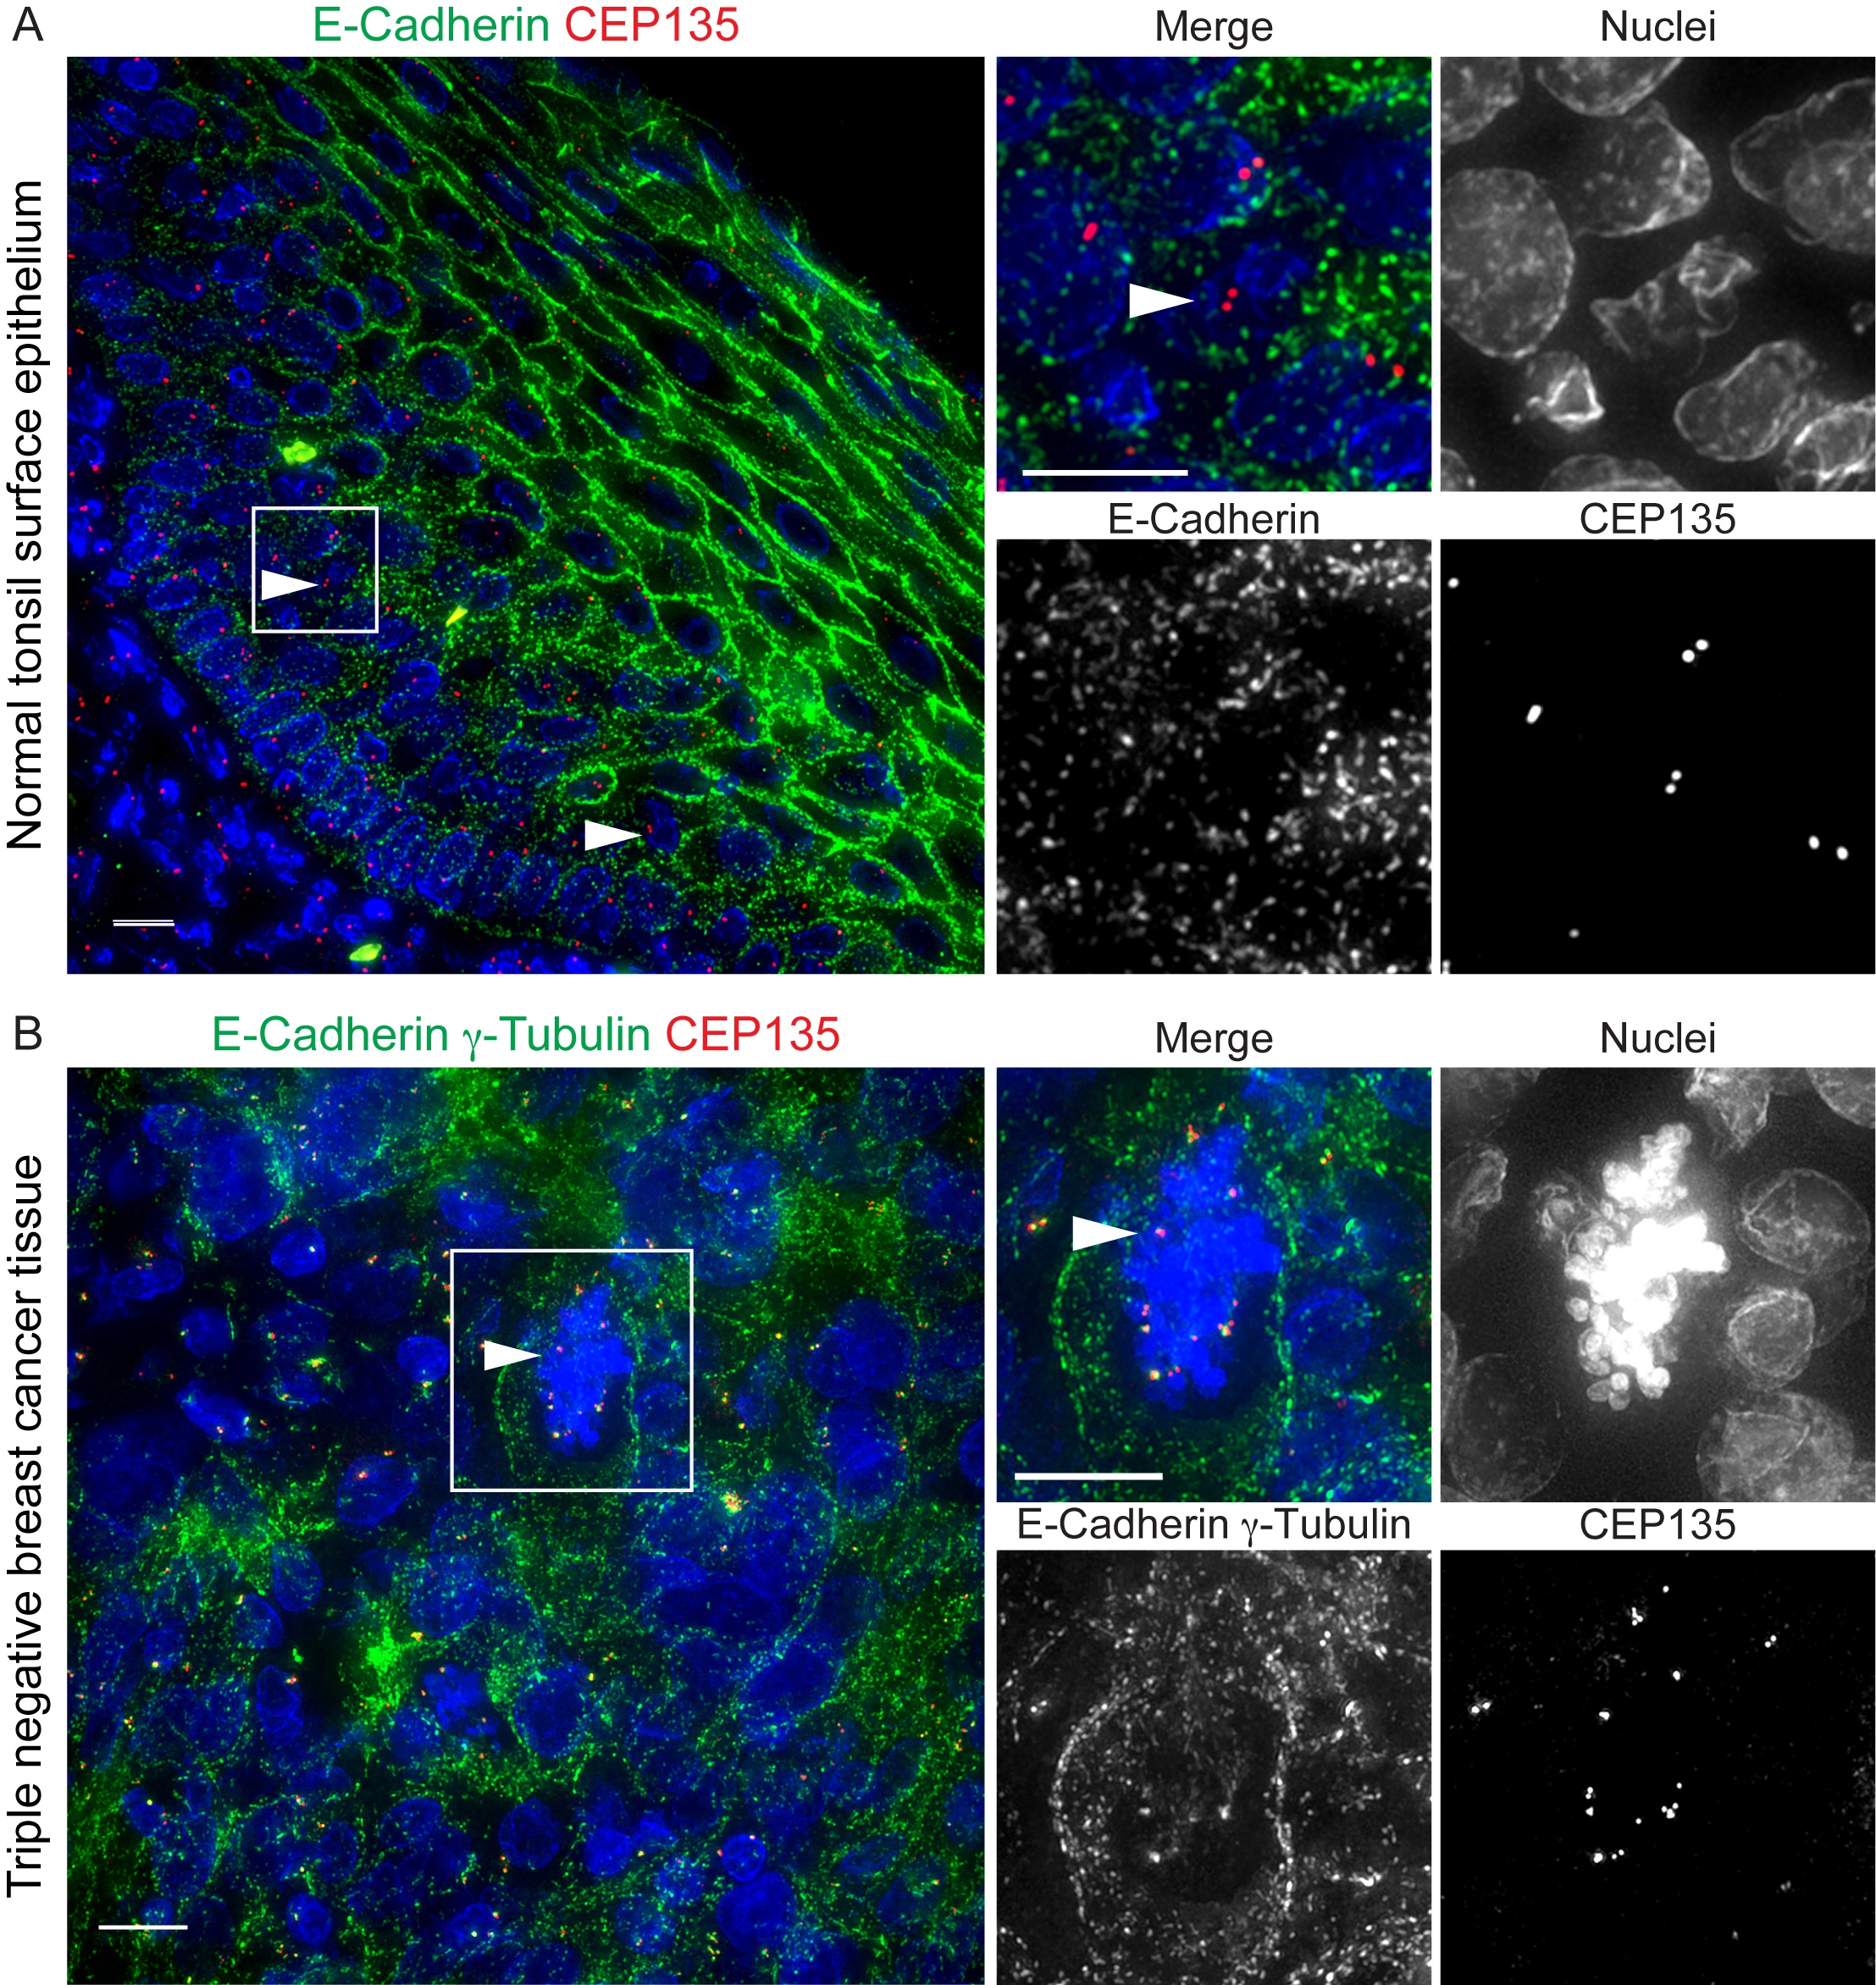
Figure 1. Centrosomes in human normal and cancer tissue. A. A human normal tonsil FFPE tissue sample stained with CEP135 (red) and E-Cadherin (green). Nuclei in blue. Scale bars: 10 μm. B. A human triple-negative breast cancer FFPE tissue sample stained with CEP135 (red), γ-Tubulin (green) and E-Cadherin (green). Nuclei in blue. Scale bars: 10 μm. Arrowheads indicate centrosomes.
Materials and Reagents
- Glass Coverslips 24 x 50 mm, No.1.5 (Globe scientific inc., catalog number: 1415-15)
- Forceps
- Humidified chamber (Biolegend, catalog number: SIG-31031)
- Coplin Jar
- Slide Staining Dish (IHC WORLD, catalog number: IW-2511)
- Slide Staining Rack (IHC WORLD, catalog number: IW-2512)
- Xylene (Fisher Scientific, catalog numbers: HC7001GAL, 22-110-676 and X16-4)
- Isopropanol (Fisher Scientific, catalog number: A416-4)
- EnVision FLEX Target Retrieval Solution, High pH (50x) (Dako Omnis, Code No: GV804)
- Tris-HCl (Sigma-Aldrich, catalog number: T5941)
- NaCl (Sigma-Aldrich, catalog number: S9888)
- Tween 20 (Sigma-Aldrich, catalog number: BP337)
- Triton X-100 (Sigma-Aldrich, catalog number: X100)
- NaN3 (Fisher Scientific, catalog number: S2271-25)
- Normal Goat Serum (Sigma-Aldrich, catalog number: G9023)
- Bovine serum albumin (BSA) (Sigma-Aldrich, catalog number: A7030)
- Tris Base (Fisher Scientific, catalog number: BP152-5)
- Anti- γ-tubulin (1:100, Sigma-Aldrich, catalog number: T5326)
- Anti-Pericentrin (1:200, Abcam, catalog number: 28144)
- Anti-CEP135 (1:50, Abcam, catalog number: ab75005)
- Anti-Centrin-3 (1:100, Abnova, catalog number: H00001070-M01)
- Anti-CP110 (1:100, proteintechTM, catalog number: 12780-I-AP)
- Anti-E-Cadherin (1:100, Abcam, catalog number: ab76055 M168)
- Secondary antibodies, purchased from Jackson Immunoresearch and used at 1:200
- Hoechst 33342 (1:1,000; Invitrogen, catalog number: H3570)
- ProLong® Diamond Antifade Mountant (Thermo Fisher Scientific, catalog number: P36970)
- EDTA (Fisher Scientific, catalog number: BP120-500)
- Washing buffer for FFPE tissue (see Recipes)
- Blocking buffer for FFPE tissue (see Recipes)
- Antigen retrieval buffer (see Recipes)
- Tris-EDTA Buffer for Antigen Retrieval (pH 9.0) (see Recipes)
Equipment
- Hot air oven (Labnet ProBlotTM 6 Hybridization Oven)
- Fume hood
- Decloaking chamber or pressure cooker (Biocare medical, DC0228)
- High-resolution fluorescence microscope (DeltaVision Core system (GE Healthcare Bio-Sciences, Pittsburgh, United States of America) equipped with Olympus IX71 Camera (CoolSNAP HQ2; Photometrics)
Note: Because centrioles are small (0.5 μm in length) and can localize at close proximity depending on cell cycle, high resolution images at a resolution around 200 nm are required to accurately separate each centrosome. High resolution microscopy like confocal and deconvolution microscopy can be used. We have successfully detected individual centrosomes using Deconvolution microscopy (DeltaVision) with a 60x, NA 1.42 objective. Because the positions of centrosomes vary depending on the tissue type, Z-section images through the whole cell volumes are required to detect and measure most centrioles in different z-sections within individual cells.
Software
- Image acquisition software (softWoRx v1.2 software [Applied Science])
- Adobe photoshop (https://www.adobe.com/products/photoshopfamily.html)
- ImageJ or Fiji (Schindelin et al., 2012; Schneider et al., 2012)
Procedure
文章信息
版权信息
© 2019 The Authors; exclusive licensee Bio-protocol LLC.
如何引用
Wang, M., Rogers, G. C. and Cress, A. E. (2019). Immunofluorescence-based Determination of Centrosome Number in Tissue Samples. Bio-protocol 9(20): e3396. DOI: 10.21769/BioProtoc.3396.
分类
癌症生物学 > 通用技术 > 细胞生物学试验
细胞生物学 > 细胞成像 > 固定组织成像
您对这篇实验方法有问题吗?
在此处发布您的问题,我们将邀请本文作者来回答。同时,我们会将您的问题发布到Bio-protocol Exchange,以便寻求社区成员的帮助。