

Three-dimensional Reconstruction and Quantification of Proteins and mRNAs at the Single-cell Level in Cultured Cells
培养细胞中蛋白和mRNA在单细胞水平上的三维重构和量化分析
(*contributed equally to this work) 发布: 2019年08月20日第9卷第16期 DOI: 10.21769/BioProtoc.3330 浏览次数: 10447
评审: Karem A CourtDivya MurthyAnonymous reviewer(s)
参见作者原研究论文
The authors used this protocol in:

Apr 2018
Advertisement


Abstract
Gene expression is often regulated by the abundance, localization, and translation of mRNAs in both space and time. Being able to visualize mRNAs and protein products in single cells is critical to understand this regulatory process. The development of single-molecule RNA fluorescence in situ hybridization (smFISH) allows the detection of individual RNA molecules at the single-molecule and single-cell levels. When combined with immunofluorescence (IF), both mRNAs and proteins in individual cells can be analyzed simultaneously. However, a precise and streamlined quantification method for the smFISH and IF combined dataset is scarce, as existing workflows mostly focus on quantifying the smFISH data alone. Here we detail a method for performing sequential IF and smFISH in cultured cells (as described in Sepulveda et al., 2018) and the subsequent statistical analysis of the smFISH and IF data via three-dimensional (3D) reconstruction in a semi-automatic image processing workflow. Although our method is based on analyzing centrosomally enriched mRNAs and proteins, the workflow can be readily adapted for performing and analyzing smFISH and IF data in other biological contexts.
Keywords: Single-molecule imaging (单分子成像)Background
smFISH is a technique to visualize individual RNA molecules using multiple short fluorescently-labeled DNA oligonucleotides (“probes”) complementary to the target RNA (Femino et al., 1998; Raj et al., 2008). In this technique, when an ensemble of short fluorescent DNA probes is bound at the target RNA, robust signals are produced as opposed to the weak signals produced by a single probe. This feature enhances the signal-to-noise ratio to reveal the location of the target RNAs, even if a single probe may have off-target binding. smFISH provides information about the RNA abundance and subcellular localization of a given RNA at the single-molecule and single-cell levels. Furthermore, combined with IF to visualize proteins, both RNAs and proteins of interest can be analyzed simultaneously in the same cell. However, tools for analyzing both smFISH and IF data are not broadly available. A widely used tool for analyzing smFISH data is FISH-quant (Mueller et al., 2013; Tsanov et al., 2016). It is a freely available software package that greatly streamlines the image analysis and mRNA spot identification. However, most quantification tools (e.g., Mueller et al., 2013; Lee et al., 2016; Tsanov et al., 2016), including FISH-quant, focus on the quantification of the smFISH data and do not intergrade the analysis of the IF data in the pipeline. Here, we detail a streamlined workflow for performing, acquiring, and analyzing sequential IF and smFISH data via 3D reconstruction in Imaris software, followed by quantifications using MATLAB and R scripts. We use co-translational targeting of pericentrin (PCNT) polysomes to the centrosome during mitosis in adherent cultured cells as an example (Sepulveda et al., 2018) to demonstrate how to use Imaris software to reconstruct the PCNT mRNAs and proteins in 3D confocal z-stacks and to apply MATLAB and R scripts to quantify their intensities, volumes, and relations (e.g., spatial distribution of molecules and overlapping between signals) in a semi-automatic manner. Our protocol can be readily applied to other sequential IF and smFISH experiments to precisely quantify RNAs and proteins in 3D space.
Materials and Reagents
- 1-1/2 micro circular glass coverslip–12 mm Diameter (Electron Microscopy Sciences, Hatfield, PA, catalog number: 72230-01)
- Cellstar® 24-well cell culture multiwell plate (Greiner Bio-one North America, Inc., Monroe, NC, catalog number: 662160)
- 15-cm Petri dish (Corning, New York, catalog number: 351058)
- Parafilm (Parafilm M, Bemis, Fisher Scientific, Waltham, MA, catalog number: 13-374-12)
- Paper towel (Fisher Scientific, Waltham, MA, catalog number: 19-040-898)
- HeLa cells (ATCC, CCL-2) (a gift from Susan Wente, Vanderbilt University, Nashville, TN; RRID: CVCL_0030)
- UltraPureTM distilled water (DNase and RNase-Free) (Invitrogen, Carlsbad, CA, catalog number: 10977-015)
- Formaldehyde, Para (PFA) (Fisher Chemical, Waltham, MA, catalog number: O4042-500)
- Phosphate Buffered Saline (PBS), pH 7.4 (Fisher BioReagents, Pittsburgh, PA, catalog number: BP399-1)
- TritonTM X-100 (Fisher BioReagents, Pittsburgh, PA, catalog number: BP151-500)
- Rabbit anti-PCNT antibody (Abcam, Cambridge, MA, catalog number: ab4448)
- Goat anti-Rabbit IgG (H+L) cross-adsorbed secondary antibody, Alexa Fluor 488 (Invitrogen, Carlsbad, CA, catalog number: A-11008
- 37% formaldehyde solution (Fisher BioReagents, Pittsburgh, PA, catalog number: BP531-500)
- Formamide (Sigma-Aldrich, Burlington, MA, catalog number: F9037)
- Prolong Gold antifade mountant (Life Technologies, Carlsbad, CA, catalog number: P36930)
- Stellaris® RNA FISH Hybridization Buffer (Biosearch Technologies, Petaluma, CA, catalog number: SMF-HB1-10)
- Stellaris® RNA FISH Wash Buffer A (Biosearch Technologies, Petaluma, CA, catalog number: SMF-WA1-60)
- Stellaris® RNA FISH Wash Buffer B (Biosearch Technologies, Petaluma, CA, catalog number: SMF-WB1-20)
- Stellaris® RNA FISH probes labeled with Quasar 670 (Biosearch Technologies, Petaluma, CA)
- 4′,6-Diamidino-2-phenylindole dihydrochloride (DAPI) (Sigma-Aldrich, Burlington, MA, catalog number: D9542)
Equipment
- Leica DMi8 with 63x/1.40 or 100x/1.40 HC PL APO objectives equipped with a spinning disk confocal microscope system (Dragonfly, Andor Technology, Belfast, UK)
- iXon Ultra 888 EMCCD camera (Andor Technology, Belfast, UK)
Software
- Fusion Software (Andor Technology, Belfast, UK)
- Imaris 8.3.1 (Bitplane, Belfast, UK; Imaris, RRID: SCR_007370)
- MATLAB (MathWorks, Natick, MA; RRID:SCR_001622)
- Microsoft Excel (Microsoft, Redmond, WA; RRID:SCR_016137)
- R (R Project for Statistical Computing; RRID: SCR_001905)
- ImageJ (Image Processing and Analysis in Java; RRID: SCR_003070)
Procedure
- Sequential immunofluorescence (IF) and single-molecule RNA fluorescence in situ hybridization (smFISH)
Note: We follow the sequential IF and smFISH protocol described by the manufacturer of smFISH probes (Biosearch Technologies, Petaluma, CA) with some modifications detailed below.
IF
Note: Use nuclease-free water for preparing all reagents for the sequential IF and smFISH experiment to limit potential RNA degradation.
- Place a 12-mm circular coverslip to each well of a 24-well plate. Seed about 5 x 10⁴ cells to each well. Allow cells to attach onto the coverslips.
- When the cells reach 75-90% confluency in each well (12-18 h for most human cultured cells), fix cells with 4% paraformaldehyde in phosphate buffered saline (1x PBS) for 10 min at room temperature (RT), followed by two quick washes with 1x PBS.
Note: To perform quick washes, gently transfer 1 ml of PBS to each well and then aspirate the solution immediately. - Permeabilize cells with 0.1% Triton X-100 in 1x PBS for 5 min at RT, followed by one quick wash with 1x PBS.
- Incubate cells (on a 12-mm circular coverslip) with 70 µl of primary antibody solution for 3 h at RT (e.g., 1:1,000 dilution of rabbit anti-PCNT antibody in 1x PBS in our example).
- Perform three 5-min washes with 1x PBS and incubate the cells with 70 µl of secondary antibody solution overnight in the dark at 4 °C (e.g., 1:500 diluted anti-rabbit Alexa Fluor 488).
Note: The dilution factor and incubation time of the primary and secondary antibodies need to be empirically determined; the sample condition described is for detecting PCNT proteins. To perform 5-min washes, gently transfer the coverslip to a well in a 24-well plate containing 1 ml of 1x PBS. Incubate for 5 min at RT without shaking the plate. - Perform three 5-min washes with 1x PBS and post-fix cells with 3.7% formaldehyde in 1x PBS for 10 min at RT.
smFISH- Wash cells with Wash Buffer A for 5 min and incubate with 67 µl of Hybridization Buffer containing 125 nM smFISH DNA probe mix for 6 h at 37 °C in the dark.
Note: We use the online Stellaris Probe Designer from Biosearch Technologies to design the FISH probes. We generally use a set of 48 to 96 20-mer DNA probes for each RNA target. For best results, add 10% formamide into 1x Wash Buffer A and Hybridization Buffer immediately before use. - Incubate cells with Wash Buffer A for 30 min at 37 °C, Wash Buffer A containing 0.05 µg/ml DAPI for 30 min at 37 °C, and Wash Buffer B for 3 min at RT.
- Mount the coverslip with enough Prolong Gold antifade mountant (e.g., 5 µl for a 12-mm circular coverslip). Let the mountant cure overnight in the dark at RT and seal the edge of the coverslip with nail polish before imaging.
Note: For the best results, perform the incubations of antibody and smFISH probes in a humidified container (e.g., a 15-cm Petri dish with a piece of parafilm and wet paper towel inside, wrapped with aluminum foil to block light).
- Image acquisition and deconvolution
Imaging
Note: When using multiple fluorophores, it is important to carefully select the wavelength ranges, emission filters, and dichroic mirrors to avoid signal bleed-through. Use settings to minimize photobleaching but also maximize the signal-to-noise ratio. A camera with high sensitivity is preferred to obtain good smFISH signals (e.g., an electron multiplying CCD camera). We recommend acquiring images sequentially, channel by channel, starting from the longest wavelength. Below are the general IF and smFISH acquisition settings using the Dragonfly spinning confocal system in the Jao lab.- Objective: 100x NA 1.4 (as well as placing a 1.5x or 2x magnification lens before the camera)
- Laser power: between 5-30% of 50-100 mW lasers
- Exposure time: 100-250 ms
- Gain: 200 for iXon Ultra 888 EMCCD camera
- Pinhole: 40 µm
- Z-stack interval: 0.3 µm
- For assessing colocalization between different fluorescent signals, acquire all channels for each z-stack.
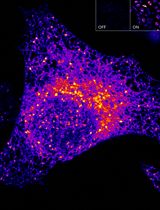
Note: It is important to avoid potential artifacts introduced during the deconvolution process by comparing the pre- and post-deconvolved images. In general, the higher the number of iterations, the more likely image artifacts will be produced. Below are our typical deconvolution settings using the built-in deconvolution algorithm in the Fusion software of the Dragonfly system.- Deconvolution preview mode: ON
- Algorithm: Robust (Iterative)
- Pre-sharpening: OFF
- Edge artifact reduction: none
- Denoising filter size: 0.7
- Denoising frequency: 4
- Number of iterations: 15
- Minimum intensity removal: ON
- Initial denoising: ON
- Normalization: OFF
- Iteration acceleration: OFF
Data analysis
- 3D reconstruction and image rendering in Imaris
- Prior to image processing, in ‘File/Preference/Statistics’, turn on relevant statistical parameters. Below are the parameters we routinely use.
- Surfaces: intensity max, intensity mean, intensity sum; position x, position y, position z; total number of surfaces; volume.
- Spots: intensity max, intensity mean, intensity sum; position x, position y, position z; total number of spots; volume.
- Volume
Note: The term ‘Statistics’ in Imaris refers to different quantitative descriptions associated with each object (e.g., area, volume, intensity, etc.). It does not refer to a statistical analysis of the data.
- Extract and mask a 3D cell outline with the following steps in Imaris:
- Open the deconvolved image.
- Click ‘Edit/Add Channels’: Select the corresponding original image.
- In the menu, select ‘Surpass/Add new surfaces’ (Figure 1A); select ‘Skip automatic creation, edit manually’ (Figure 1B).
- Move to the slice position with the clearest outline.
- Switch pointer to select mode and select ‘Draw’ option to mark the cell outline (Figures 1C and 1D).
Note: The cell outline in our analyses was marked based on the visualization of the background noise by adjusting the channel max intensity under ‘display adjustment’. Users may use other membrane or cytoplasmic markers to visualize the cell boundary. - Copy and paste the contour lines to the first and last image planes (Figure 1D).
- Select manual ‘Resolution’ and adjust it to the largest size (Figure 1D). Click ‘Create Surface’.
- Make cell mask (Figures 1E and 1F): Select ‘Mask All’. The box ‘Duplicate channel before applying mask’ should be selected. Set ‘voxels outside surface’ to ‘0’ and ‘inside surface’ to a high value within the bit depth of your image (e.g., ‘30,000’ in this example). This creates a binary mask of the cell of interest.
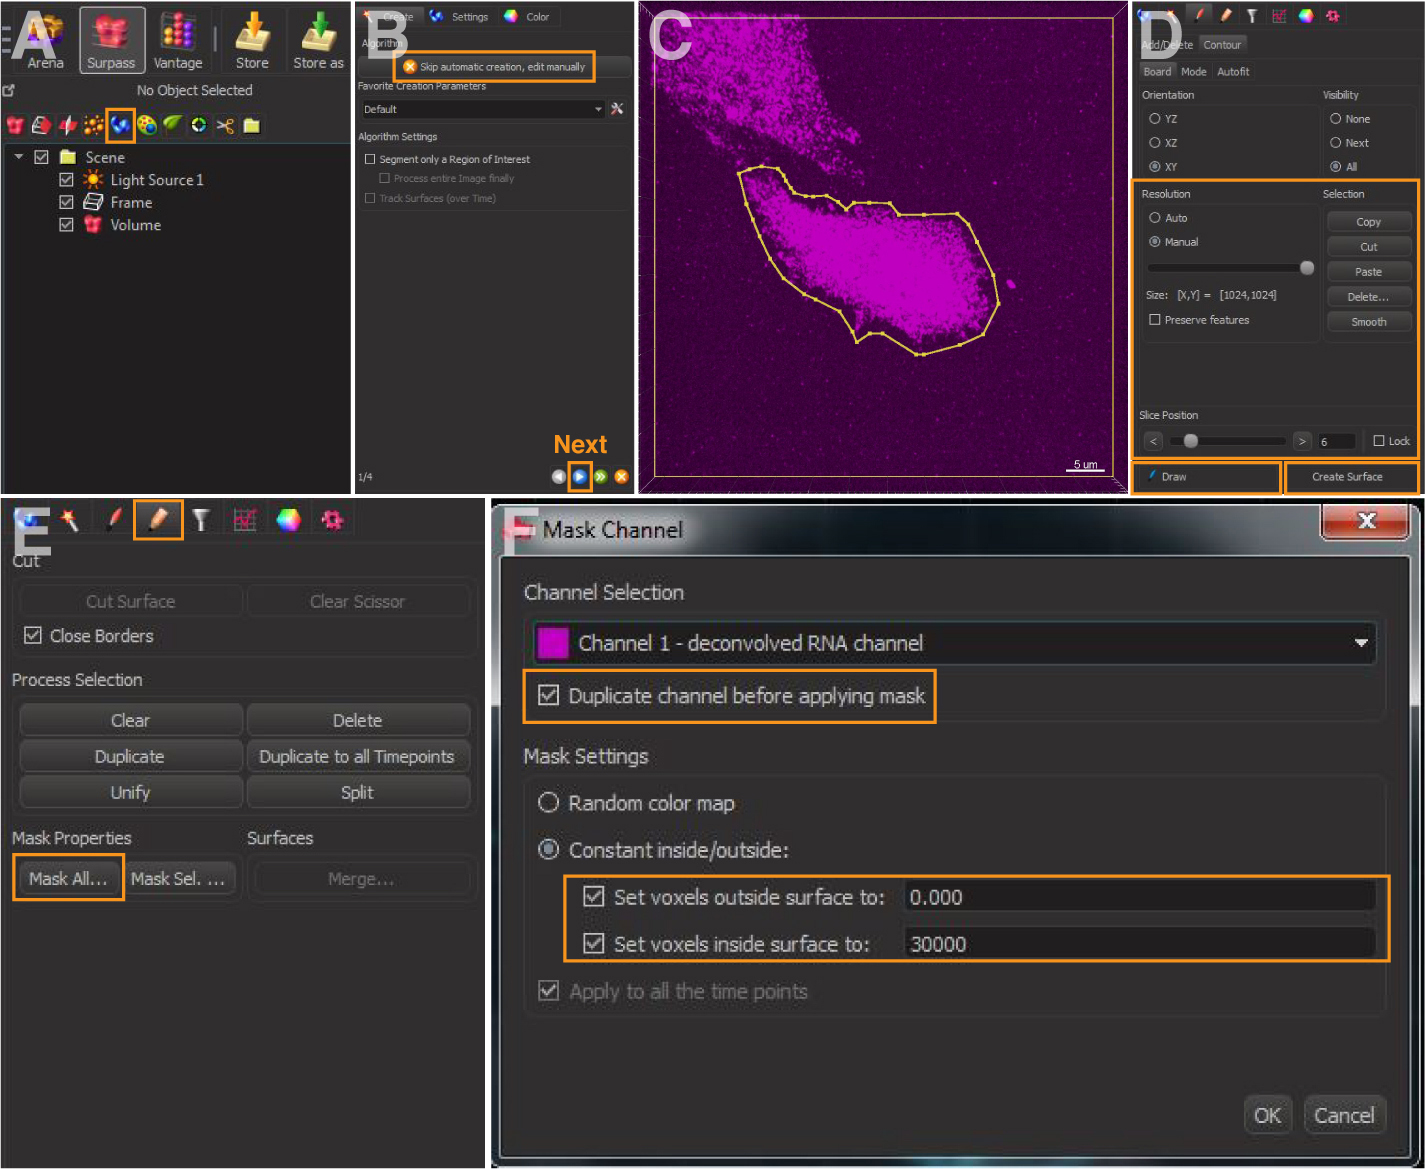
Figure 1. Cell outlining in Imaris. A. Add new surfaces. B. Skip automatic creation and edit manually. C and D. Draw contours lines to mark the cell outline. E and F. Mask channel of the cell outline and set voxels.
- Create 3D Surface object(s) for protein(s) of interest in Imaris:
- Add a new Surface object (Figure 1A). Click the blue arrow to continue to the next page (Figure 2A). For ‘Source Channel’, select the deconvolved channel of protein of interest. Check the box ‘Smooth’, and the value of ‘Surfaces Area Detail Level’ is automatically calculated and kept as the default. Select ‘Absolute Intensity’ for thresholding (Figure 2B).
Note: The ‘Smooth’ command applies a Gaussian filter to the image to facilitate the identification of surface objects for noisy images. It reduces the noise and detail included in the rendered surface. If ‘Smooth’ is selected, the ‘Surface Area Detail Level’ parameter is automatically determined from the image. Users can alter this parameter to remove more or less surface details. The higher this parameter, the less detail this surface rendering will include. - ‘Threshold (Absolute Intensity)’ has an automatic value by Imaris (Figure 2C). Increase or lower this threshold to include only the signal of interest. Use the same value across images to be compared.
- There is an automatic filter based on voxel size. This can be left at the default of 10 or adjusted depending on the size of interest.
- Add Filters: Select ‘Intensity Max of the masked channel number of the cell outline’ generated in step 2. This step restricts the fitting of any protein signals within the outlined cell (Figure 2D).
- Click ‘Finish’ to complete the rendering of protein surface (Figure 2D). Examples are in Figure 4.
Note: If there are multiple proteins of interest per cell, repeat step 3 to generate a surface rendering for each protein.
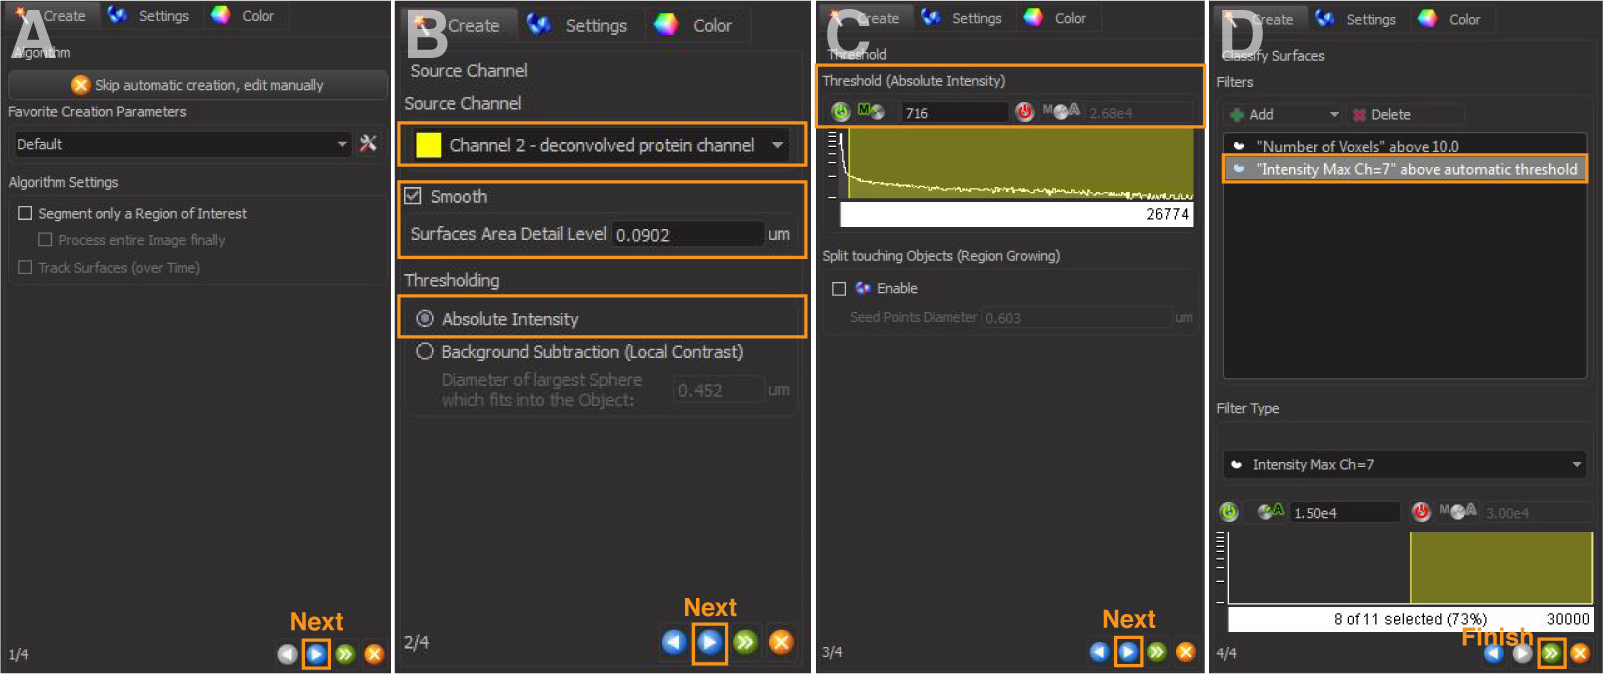
Figure 2. 3D reconstruction of protein surfaces. A and B. Select the source channel and set surface area detail level. C. Adjust absolute intensity threshold to capture all signals. D. Add filters to restrict fitting of protein signals within the outlined cell.
- Add a new Surface object (Figure 1A). Click the blue arrow to continue to the next page (Figure 2A). For ‘Source Channel’, select the deconvolved channel of protein of interest. Check the box ‘Smooth’, and the value of ‘Surfaces Area Detail Level’ is automatically calculated and kept as the default. Select ‘Absolute Intensity’ for thresholding (Figure 2B).
- Create 3D spot object(s) for RNA of interest in Imaris:
- Add a new spot object (Figure 3A).
- Select ‘Different Spot Size (Region Growing)’ (Figure 3B).
- For ‘Source Channel’, select the deconvolved channel of RNA of interest (Figure 3C).
- For ‘Spot Detection’, enter ‘Estimated XY Diameter and Z Diameter’ of RNA of interest (Figure 3C).
Note: Determine the XY diameter by measuring the average size of several RNA smFISH foci in the original confocal image via ImageJ with reference to a scale bar. The Z diameter is set two times of the XY diameter by Imaris as the default. - Imaris calculates a ‘spot quality’ (Figure 3D) based on intensity differences and shapes for spot rendering. This value should be adjusted to include the signal of interest.
Note: We found that the spot quality by the default calculation is often inaccurate in marking the true RNA spots. Users need to manually increase or lower the threshold to ensure that the true RNA spots are marked, but the noises (e.g., small dot-like background signals) are excluded. - Add Filter: Select ‘Intensity Max = masked channel number of the cell outline’ generated in step 2. This step restricts the fitting of any RNA signals within the outlined cell (Figure 3D).
- Select ‘Spot Region from Absolute Intensity’ (Figure 3E).
- Spot Region Threshold is pre-calculated by Imaris (Figure 3F).
Note: Users may need to manually increase or decrease the region threshold to ensure that all the RNA signals are rendered in the final step. - Click ‘Finish’ to complete the rendering of RNA spots (Figure 3F). Examples are in Figure 4.
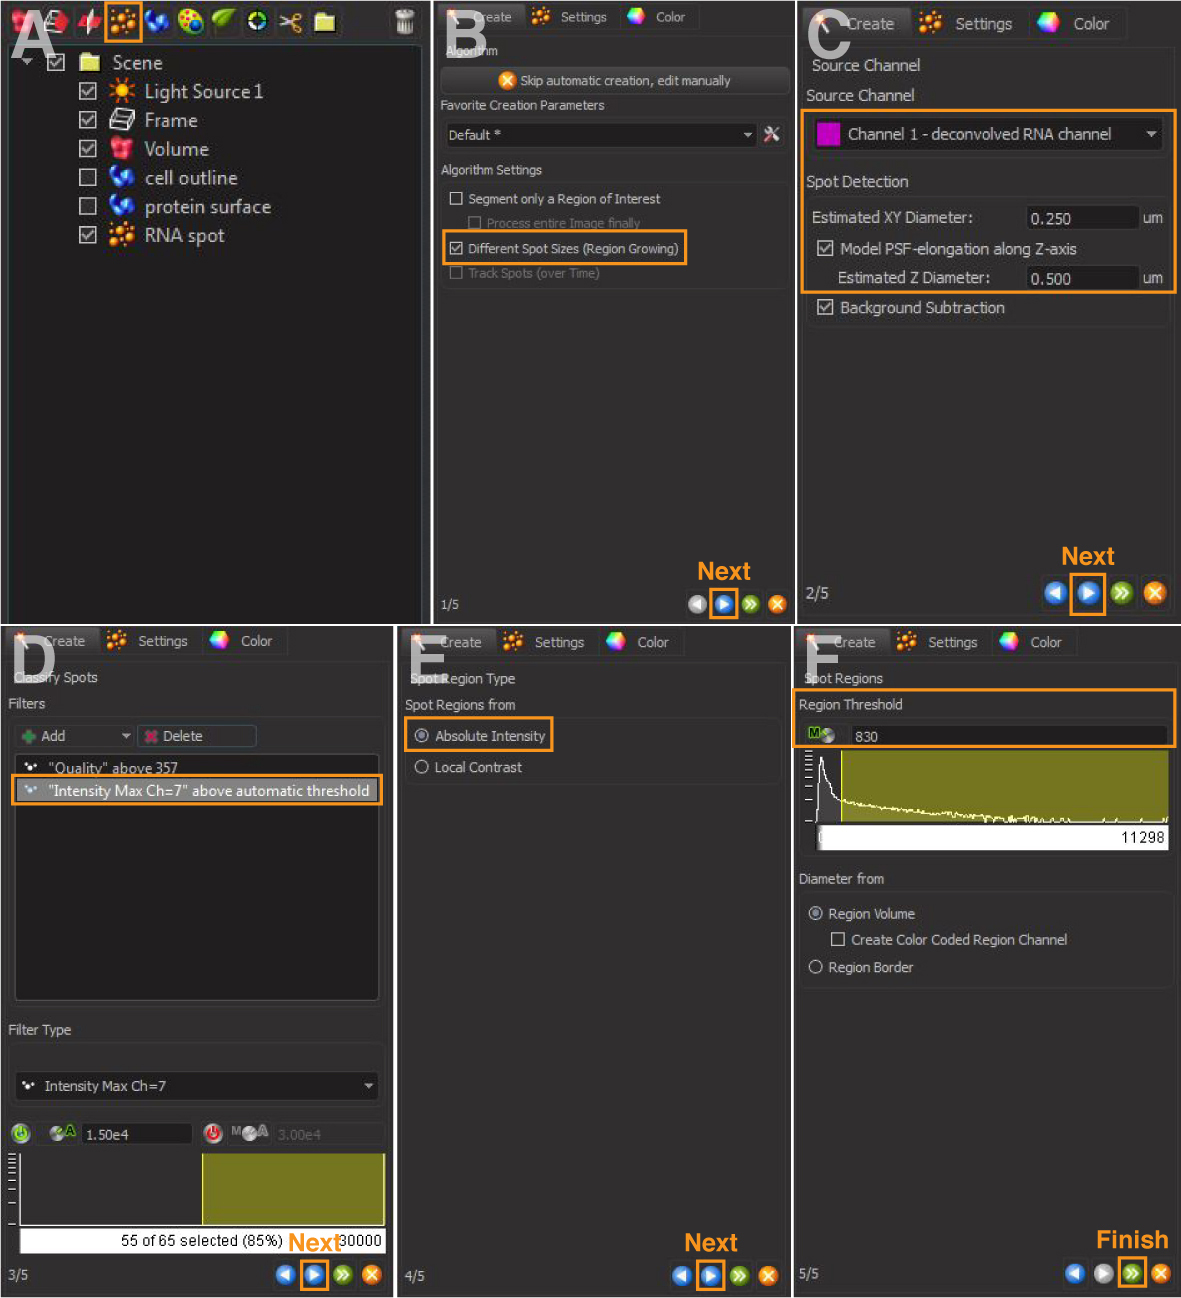
Figure 3. 3D reconstruction of RNA spots. A and B. Create a new spot and select different spot sizes (region growing). C and D. Select source channel and set spot detection. (D) Adjust thresholds and add filters. E and F. Select absolute intensity and adjust region threshold.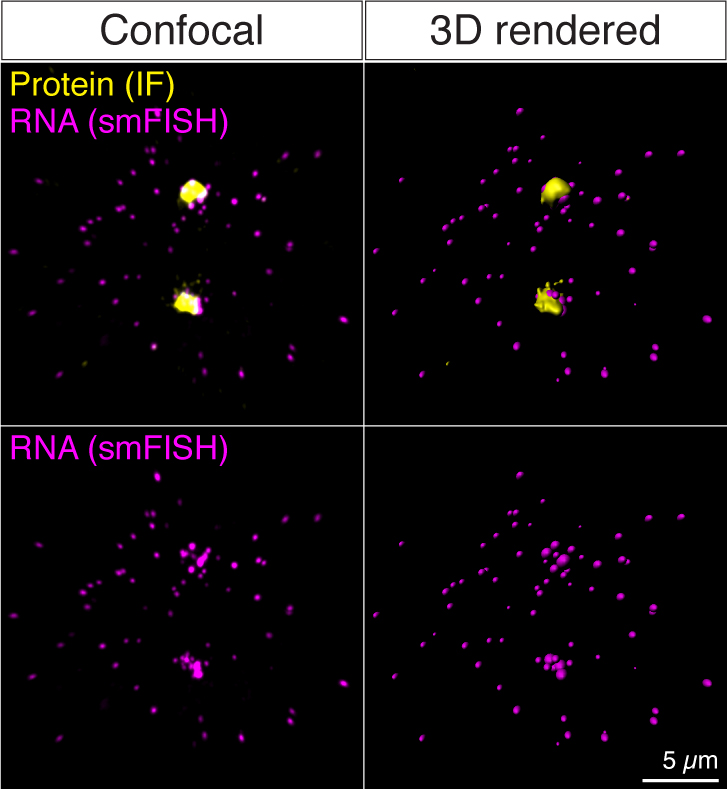
Figure 4. Examples of before (Confocal) and after (3D rendered) 3D reconstruction of the confocal images from a sequential IF and smFISH experiment
- This is an additional process to determine if the 3D reconstructed protein surfaces and RNA spots are overlapped.
- Click the protein surface object generated in step 3 and mask channel of the protein surface (Figures 5A and 5B): Select ‘Mask All’. Choose the deconvolved channel of the protein surface as Source Channel, and check the box ‘Duplicate channel before applying mask’. Set ‘voxels outside surface’ to ‘0’ and inside surface to the highest voxel values of your imaging system (e.g., ‘30000’ in this example). This will generate a masked channel of protein surface (e.g., Channel number 8 in Figure 5F).
- Click the RNA spot object generated in step 4. Add Filter (Figure 5C) and select ‘Intensity Max [channel number] = masked [channel number] of protein surface’ generated in step 5a; this is a binary channel with values either 0 or the high number selected earlier. Apply the upper threshold to select for overlapping RNA spots. Click ‘Duplicate Selection to new Spots’ (Figure 5D).
Note: If one or more pixels of an RNA spot overlaps with the masked protein surface, it is counted as an overlapping spot. - Repeat the process (step 5b) but apply the low threshold (i.e., spots with a value of 0 in the masked channel) to select for non-overlapping RNA spots. Click ‘Duplicate selection to new Spots’ (Figure 5E).
Note: If no pixel of an RNA spot overlaps with the masked protein surface, it is counted as a non-overlapping spot.
- Repeat steps 1 to 5 for each image. Export the processed images to a folder.
Note: During image processing, keep the order consistent for generation of cell outlines, protein surfaces, and RNA spots in Imaris (Figure 5F) so that the corresponding numbers of channels, protein surfaces, and RNA spots are identical for a given set of images. This thus allows a consistent definition of protein(s) or RNA(s) of interest when running the MATLAB scripts.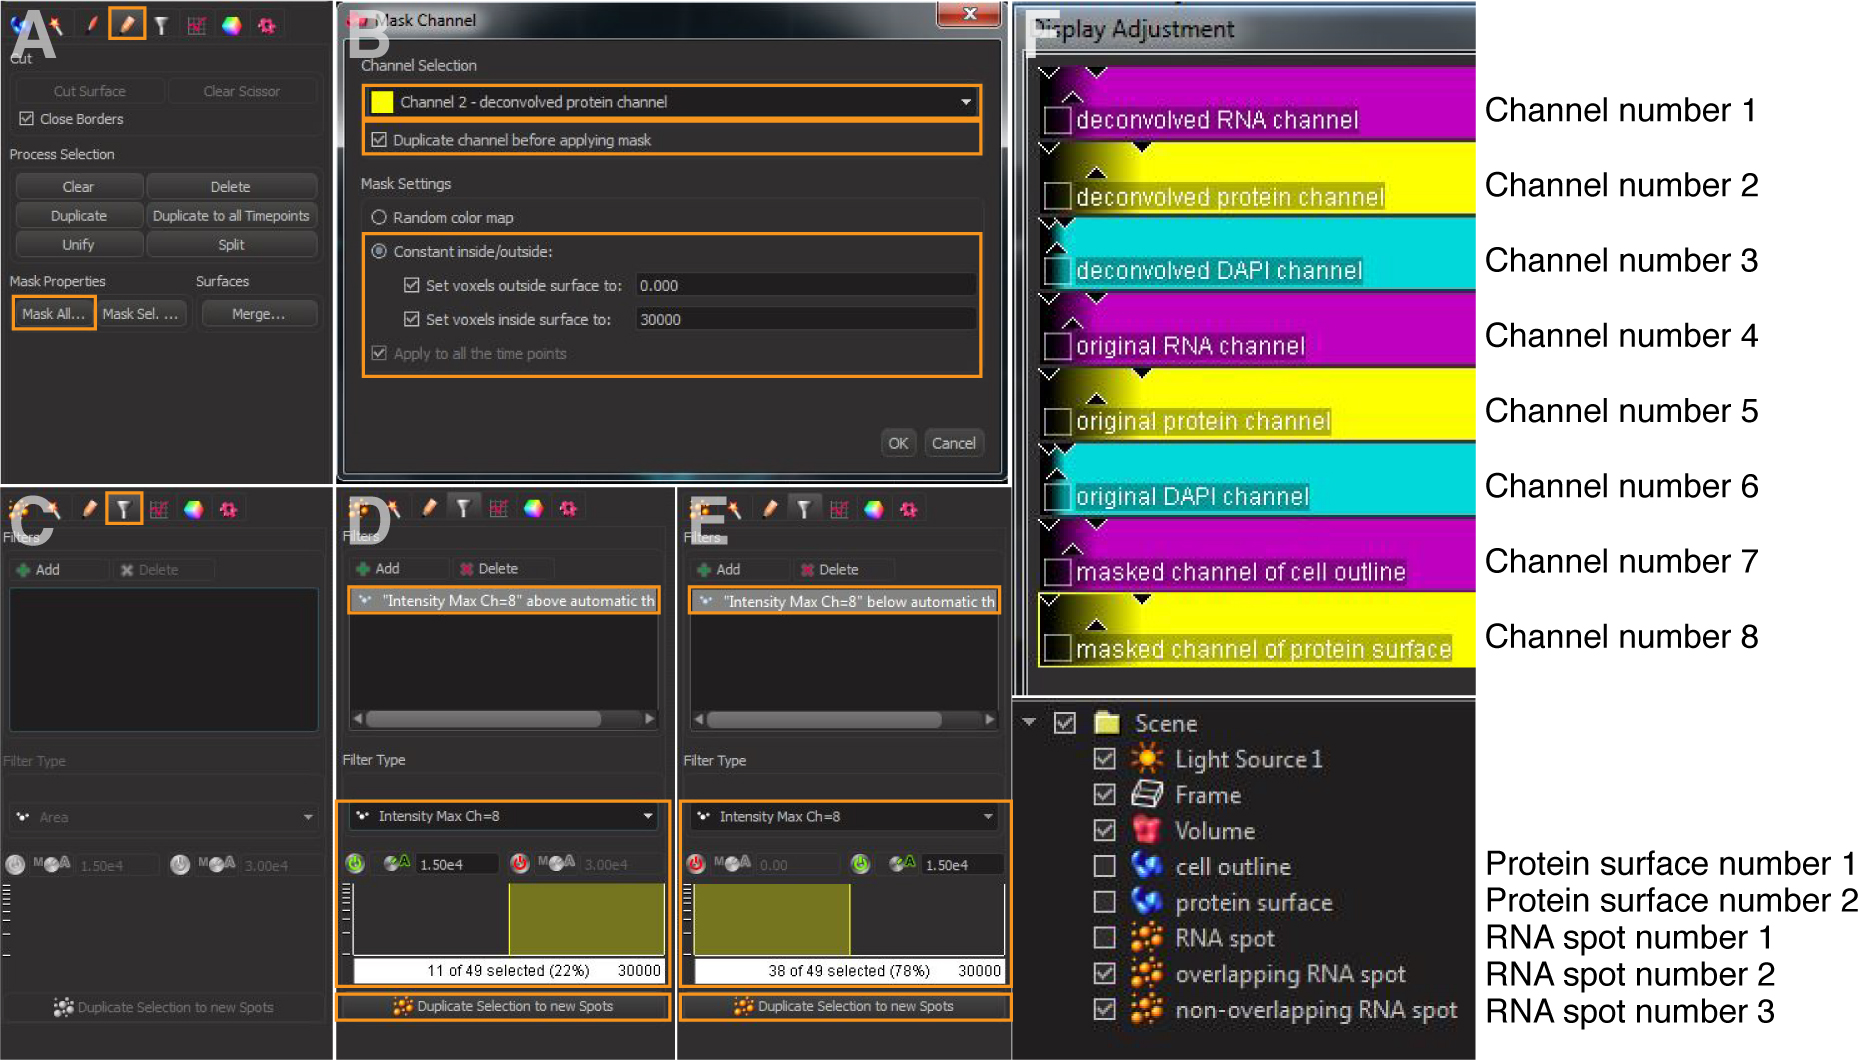
Figure 5. Detection of the RNA spots that overlap with the protein signals. A and B. Mask protein surface of interest. C-E. Filtering overlapping and non-overlapping RNA spots. F. Illustration of channel numbers, protein surface numbers, and RNA spot numbers.
- Prior to image processing, in ‘File/Preference/Statistics’, turn on relevant statistical parameters. Below are the parameters we routinely use.
- Process and export data from Imaris using MATLAB scripts
Note: To set up MATLAB, do the following first:- Open MATLAB software; select ‘HOME/Set Path’: Add MATLAB search path as the location of the image folder
- Prior to using ImarisReader for data analysis in MATLAB, download the ImarisReader .zip from the MATLAB Central File Exchange. Save the files within the MATLAB search path.
Processing note: Below are the examples of using MATLAB and R scripts to quantify the intensities (RNA or protein, total or centrosomal) and RNA distribution relative to the nearest centrosome after rendering of the RNA and centrosomal protein signals in Imaris. See Sepulveda et al., 2018 for examples of the final plots.
- Quantification of total RNA and protein intensities
- Open ‘total_protein_and_RNA_intensity.m’ (Supplementary files) in MATLAB.
- Define ‘fpath’ as the location of the images (e.g., line 14 in Figure 6).
- Define protein and RNA of interest for quantification. These are the ‘protein_surface_number’ in line 18 and ‘spot_number’ in line 19 in Figure 6.
Note: For example, in Figure 5F, ‘Protein surface number 2’ is the Surface object created for the protein of interest. You will thus define ‘protein_surface_number = 2’ in line 18 in Figure 6. ‘RNA spot number 1’ is the Spot object created for the RNA of interest. You will thus define ‘spot_number = 1’ in line 19 in Figure 6. - Define the original channel numbers for protein and RNA of interest. These are ‘ori_protein_channel_number’ in line 23 and ‘ori_RNA_channel_number’ in line 24 in Figure 6.
Note: For example, in Figure 5F, the original channel of protein and RNA of interest are channel 5 and channel 4, respectively. You thus define ‘ori_protein_channel_number = ‘5’’ in line 23 and ‘ori_RNA_channel_number = ‘4’’ in line 24 in Figure 6. - Run the script. The original protein and RNA intensities within the rendered protein surface and RNA spots will be exported into a .csv file in the image folder, which can be opened by Microsoft Excel.
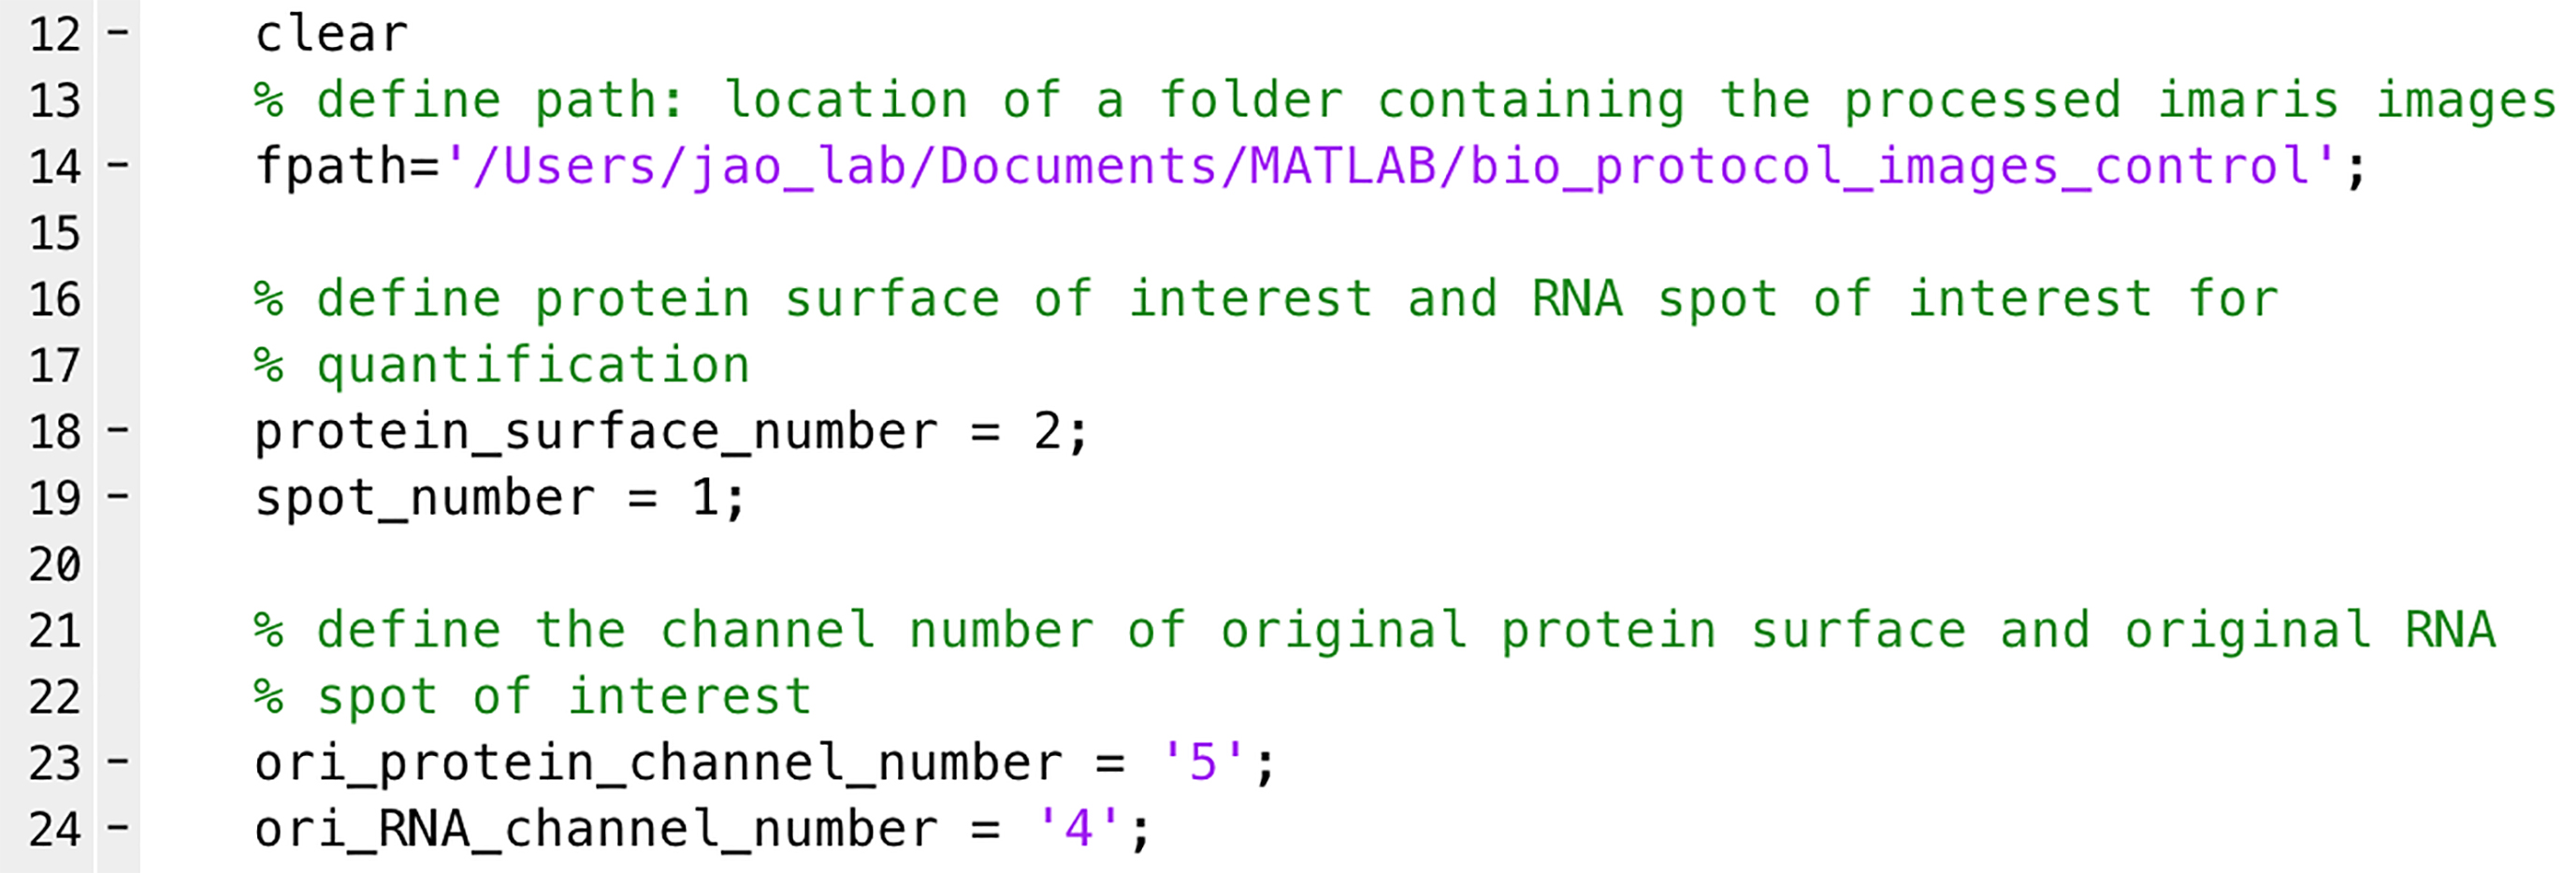
Figure 6. Quantification of total protein and mRNA intensities from the original (pre-deconvolved) confocal images. A highlight of the MATLAB script lines. See Supplementary files for the complete script.
- Quantification of protein intensity at the centrosomes
Note: This is an example of quantifying protein intensity in a subcellular area of interest. Here we quantify the protein intensity from the two centrosomes during mitosis. The script isolates the two centrosomes from the rest of the cell by defining them as the first and second largest protein surface volumes of the anti-PCNT signals.- Open ‘centrosomal_protein_intensity.m’ (Supplementary files) in MATLAB.
- Define ‘fpath’ as the location of the images (e.g., line 14 in Figure 7).
- Define the surface number for protein of interest for quantification (e.g., line 17 in Figure 7).
- Define the original and deconvolved channel numbers for protein of interest (e.g., in lines 21 and 22, respectively, in Figure 7).
- Run the script to obtain a .csv file in the image folder.
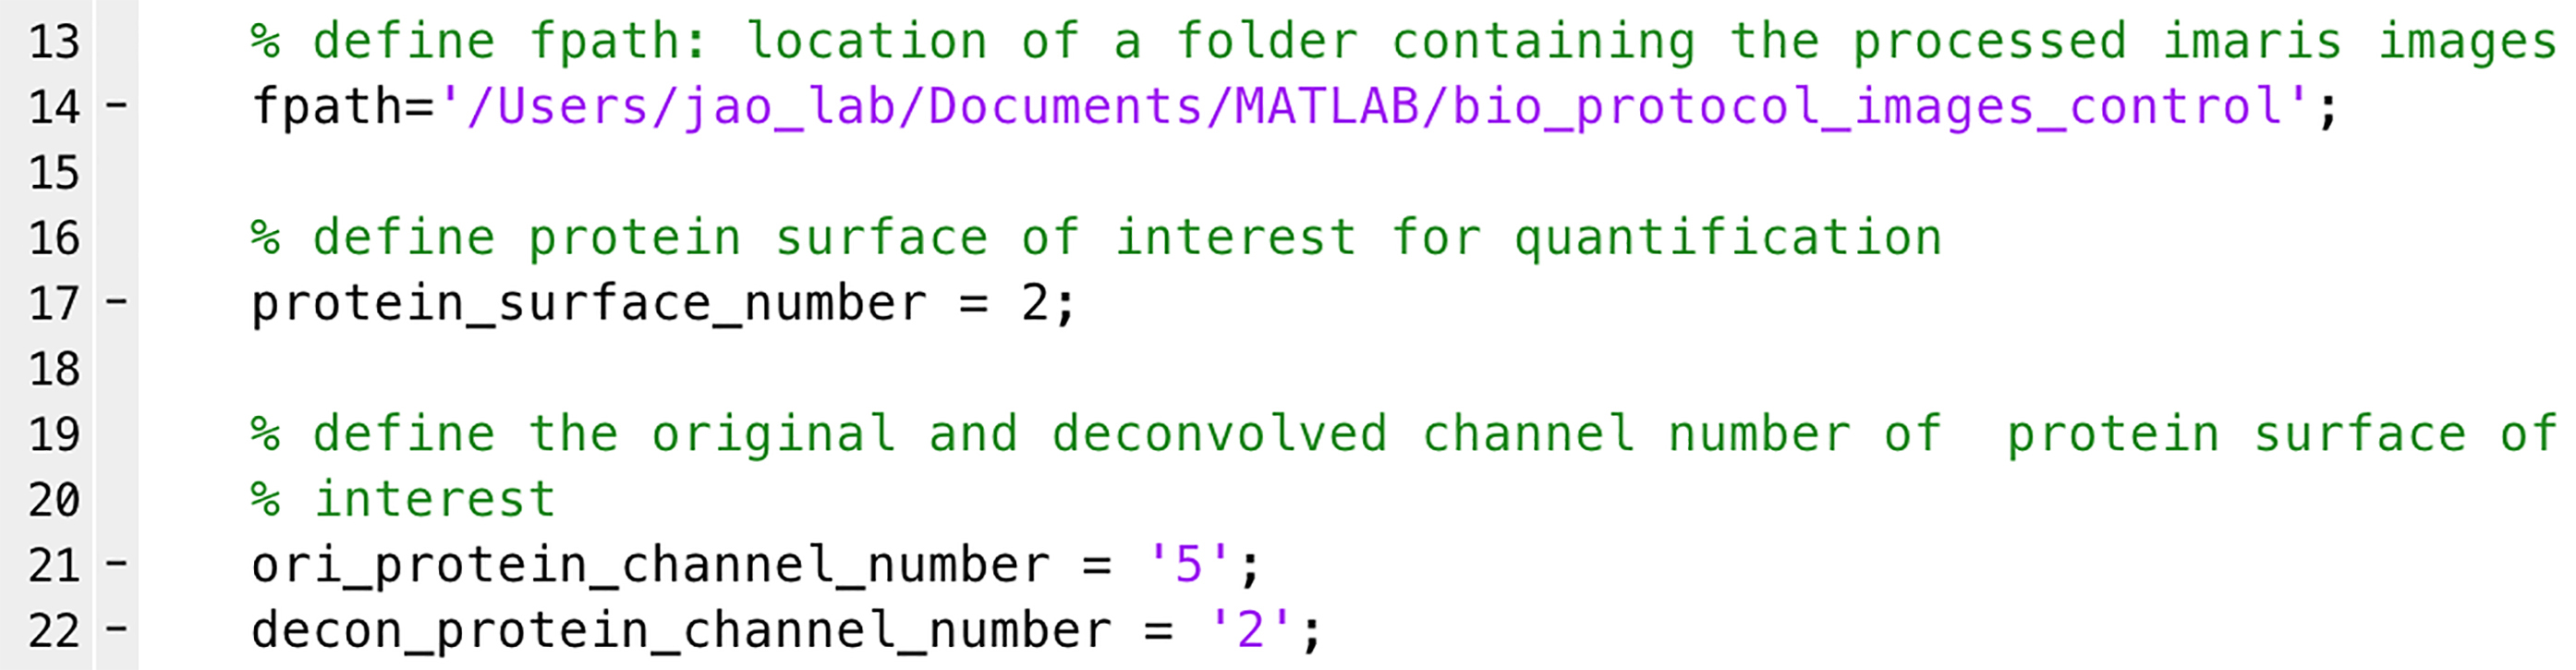
Figure 7. Quantification of the protein intensity at the centrosomes from the original (pre-deconvolved) confocal images. A highlight of the MATLAB script lines. See Supplementary files for the complete script.
- Quantification of mRNA distribution relative to the centrosome
Note: This is an example of quantifying the distribution of mRNA molecules to the centrosome as a function of distance. The intensity of the mRNA signal in each spot is assumed to be proportional to the amount of mRNA in each spot and is used in lieu of mRNA units. The distance from each mRNA spot to each centrosome’s center of mass is calculated, and the mRNA signal is assigned to the closest centrosome. The mRNA spots were binned in 0.5 µm intervals to the centrosome, and the spot intensities in each bin were added as a measure of the amount of mRNA at that distance. This is calculated for each cell and then averaged over all the cells of a given condition and graphed as average mRNA intensity as a function of distance to the closest centrosome within the cell in 3D voxels.- Open ‘mRNA_distribution.m’ (Supplementary files) in MATLAB.
- Define ‘fpath’ as the location of the images (e.g., line 14 in Figure 8).
- Define the surface numbers for protein and mRNA for quantification (e.g., line 18 for protein surface and line 19 for RNA spots in Figure 8).
- Define the deconvolved channel number of RNA (e.g., line 22 in Figure 8).
Note: We use RNA intensities from the deconvolved channel to eliminate the noise or background signals.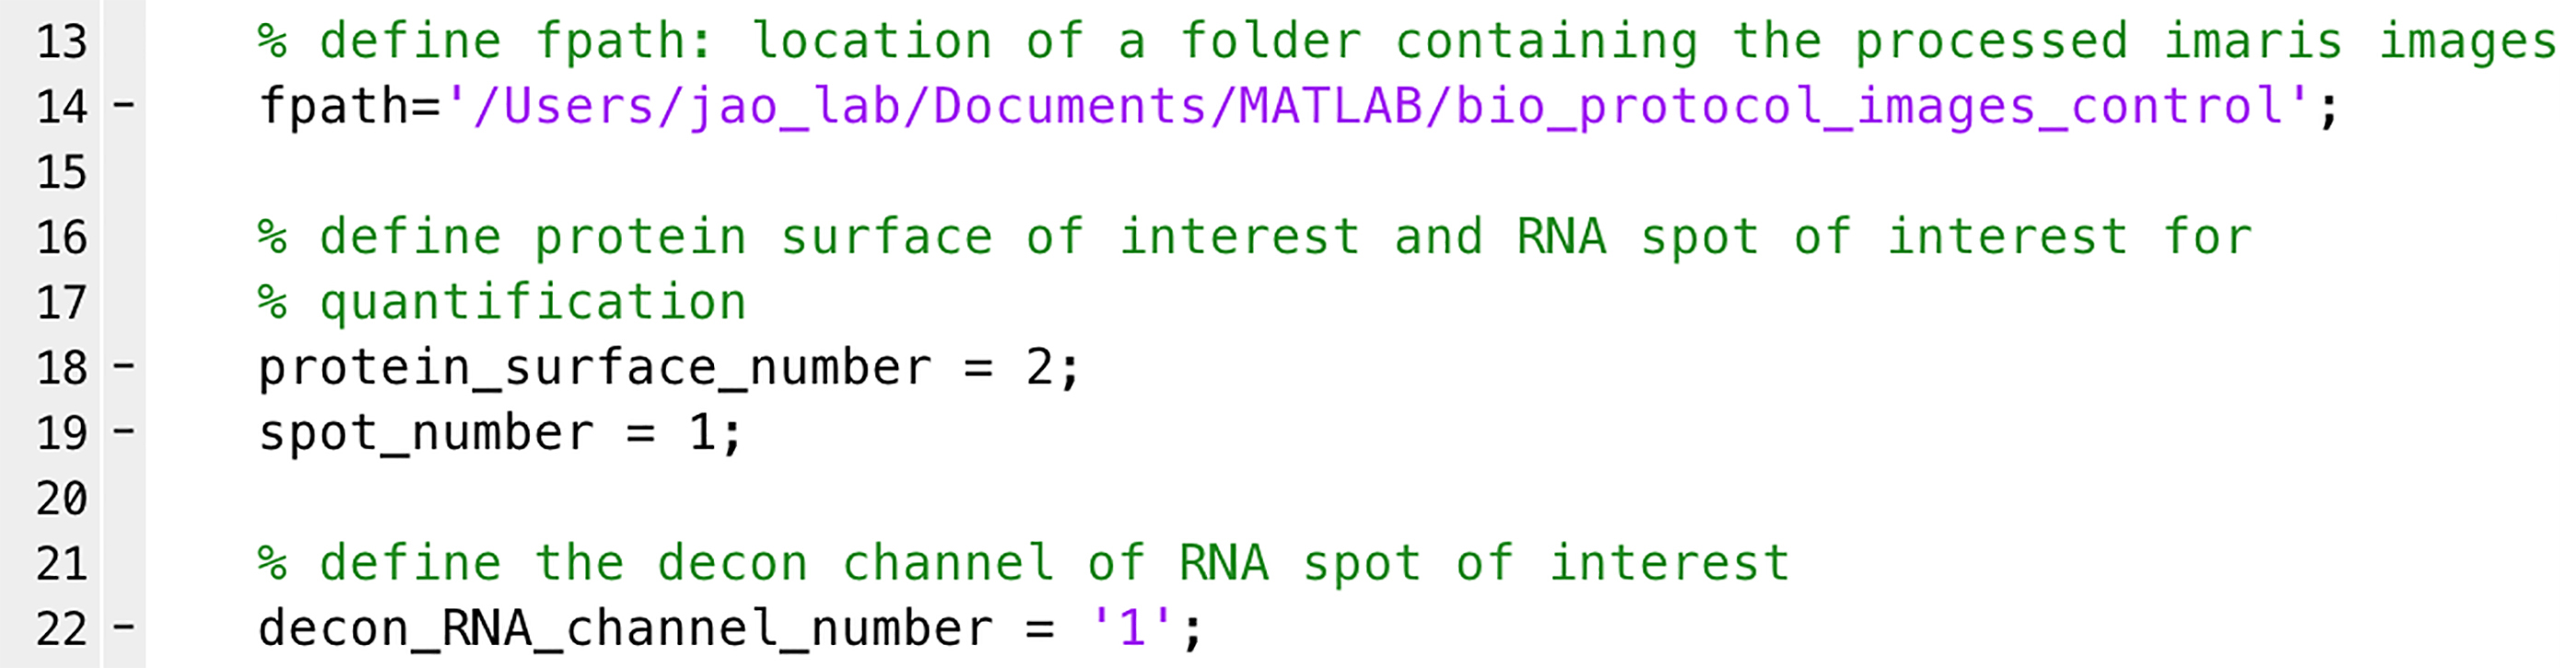
Figure 8. Quantification of mRNA distribution relative to the centrosome. A highlight of the MATLAB script lines. See Supplementary files for the complete script. - Run the script to obtain .csv files in the image folder. In each .csv file, each row represents the distance relative to the centrosome, from 0 µm (first row) to 20 µm (last row) with 0.5 µm intervals (Figure 9). Each column represents the amount of mRNA at each distance relative to the nearest centrosome (Figure 9).
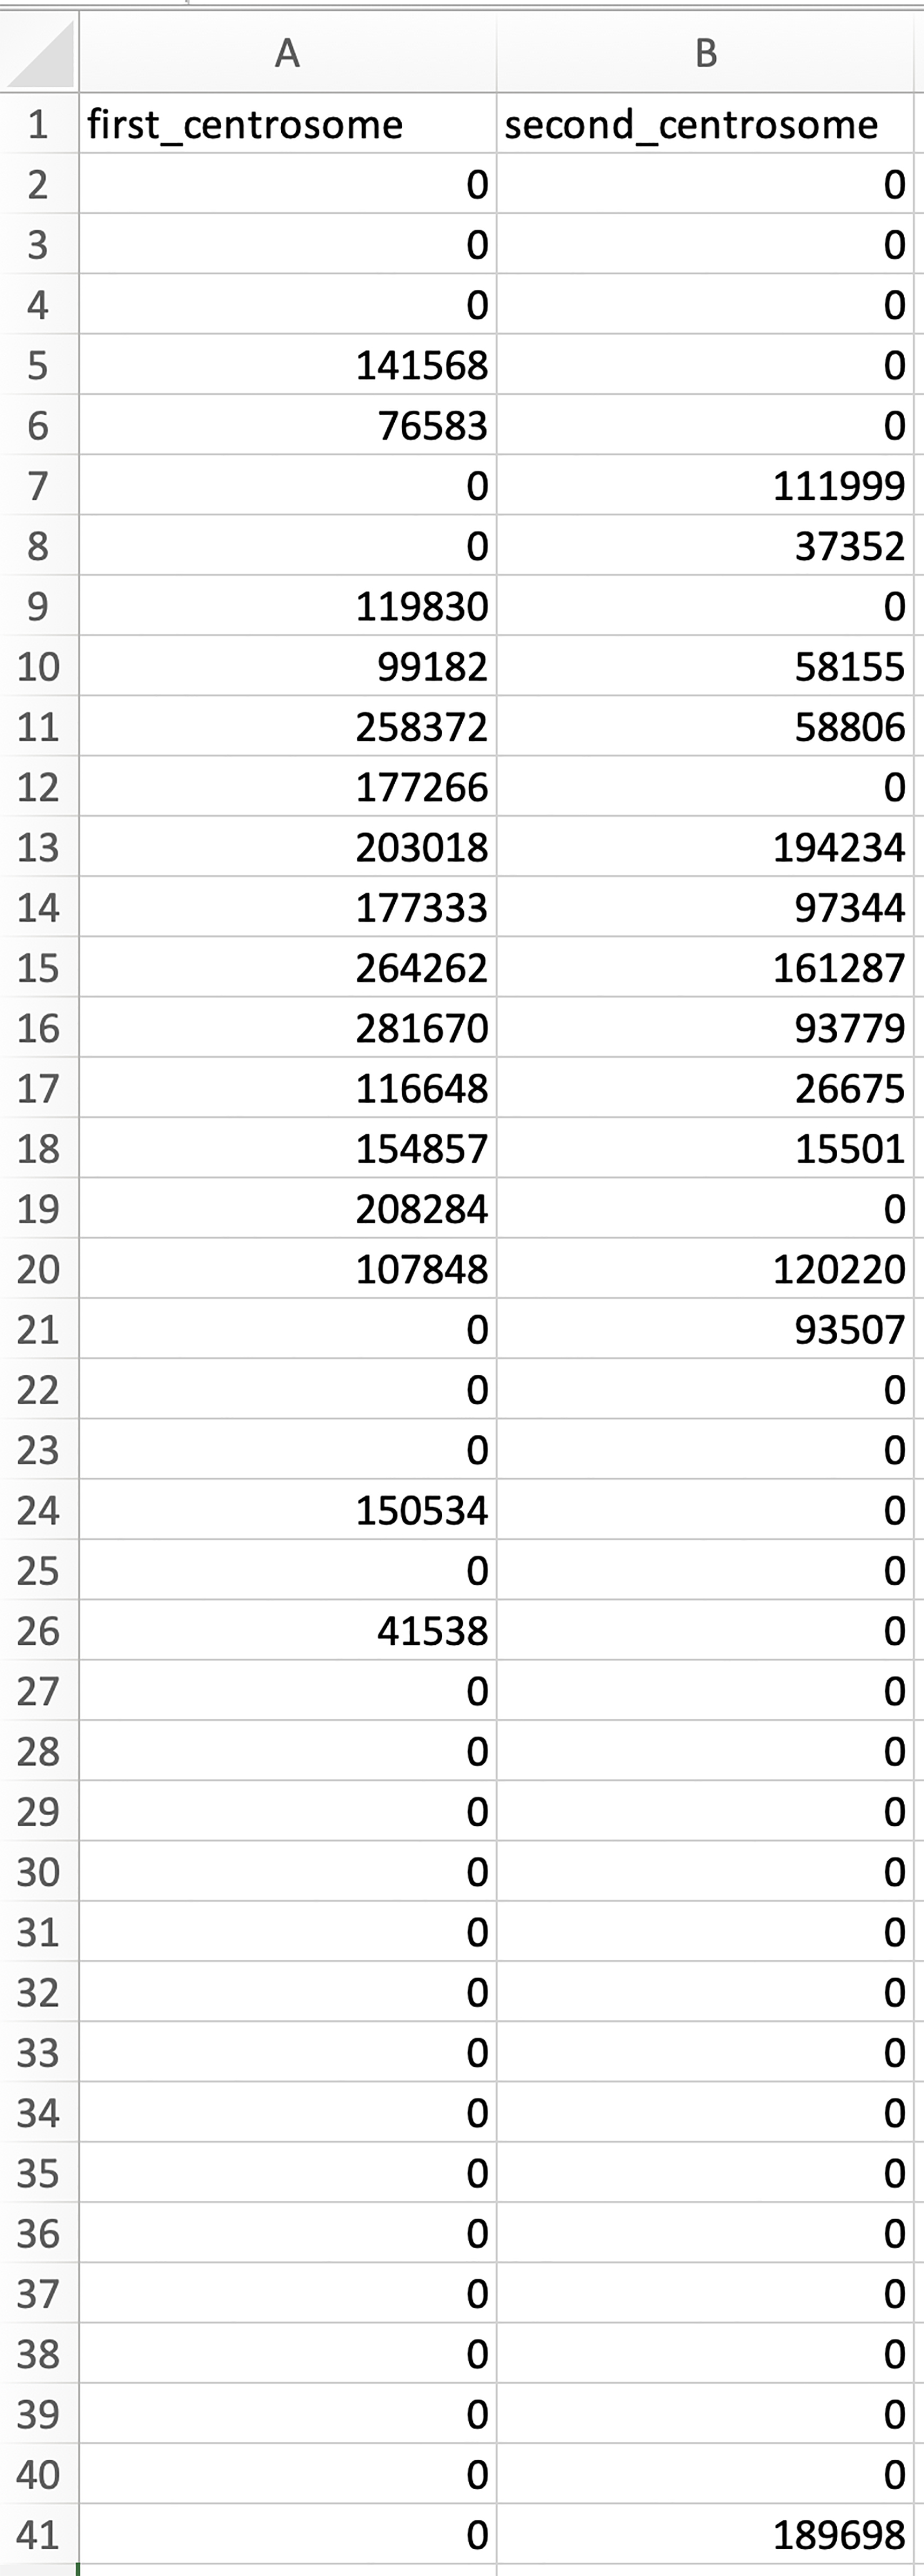
Figure 9. An example of the data in the columns and rows of a .csv file generated by the ‘mRNA_distribution.m’ script
Note: Below are the steps to use an R script to combine all .csv files from multiple cells into a single spreadsheet for further quantification (e.g., calculation of the normalized intensity as the ratio of each data point over the total intensity in each column). - Group all .csv files into a new folder.
- Open ‘column_combination_and_normlization’ (Supplementary files) in R.
- Specify the working directory and the location of the .csv files (e.g., in lines 11 and 12, respectively, in Figure 10).
- Run the R script to obtain two .csv files within the new folder: (1) combined original dataset; (2) combined normalized dataset.
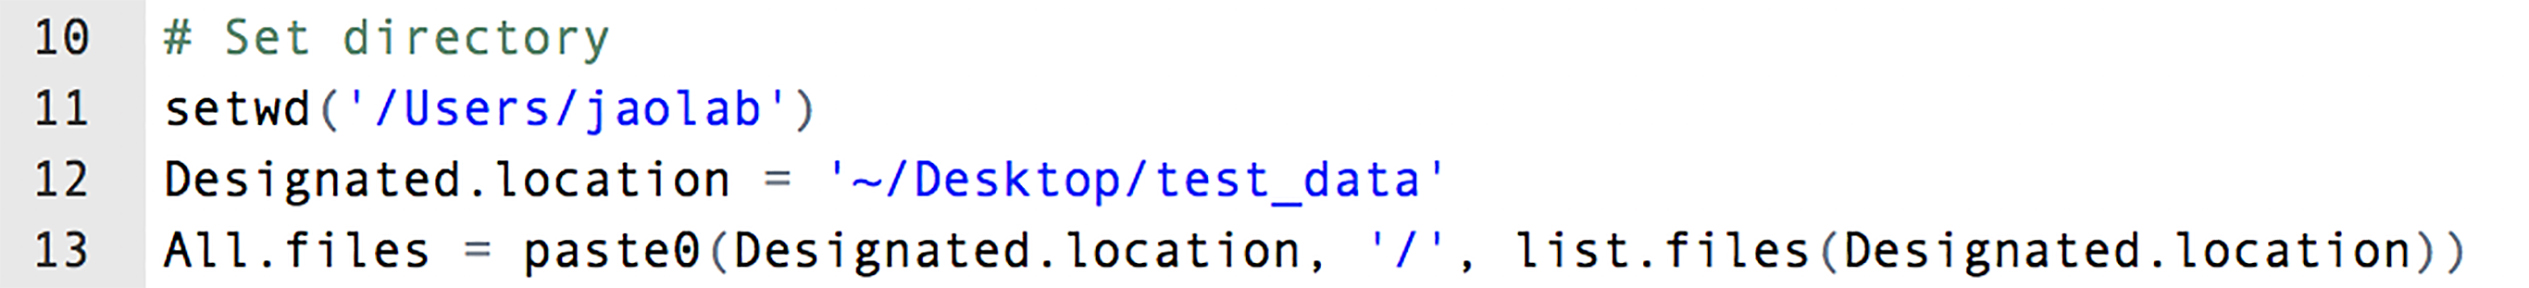
Figure 10. Using an R script to combine and normalize the data in multiple .csv files. A highlight of the R script lines. See Supplementary files for the complete script.
- Quantification of the RNA signals that overlap with the protein signals within a defined distance to the centrosome.
Note: This is an example of quantifying how much of the PCNT mRNA overlaps with the anti-PCNT N-terminus protein signals within a defined distance from the centrosome; the overlap of these two signals outside of the centrosome suggests that these mRNAs are undergoing active translation. The distance from each overlapping or non-overlapping mRNA spot (separated in Imaris as explained above) to each centrosome’s center of mass is calculated, and the mRNA signal is assigned to the closest centrosome. The mRNA spots were binned in 0.5 µm intervals from the centrosome, and the intensities of the overlapping or non-overlapping spots in each bin were added as a measure of the amount of mRNA at that distance. Percentage of overlapping mRNA spots with protein signals was calculated in each distance per cell. This was then averaged over all the cells of a given condition and graphed as the overlapping mRNA percentage as a function of distance to the closest centrosome within the cell in 3D voxels.
- Open ‘overlapping_mRNA_percentage.m’ (Supplementary files) in MATLAB.
- Define ‘fpath’ as the location of the images (e.g., line 14 in Figure 11).
- Define centrosome protein surface number, overlapping RNA spot number, and non-overlapping RNA spot number (e.g., in lines 18, 19, and 20, respectively, in Figure 11).
Note: In Figure 5F, RNA spot number 2 and 3 are the Spot objects created for overlapping and non-overlapping RNA spots, respectively. You will thus define ‘overlapping_RNA_spot_number = 2’ in line 19 and ‘nonoverlapping_RNA_spot_number = 3’ in line 20 in Figure 11.
- Define the deconvolved channel number for RNA (e.g., line 23 in Figure 11)
- Run the script to obtain .csv files in the image folder. The first column represents the distance relative to the centrosome, from 0 µm (first row) to 20 µm (last row) with 0.5 µm intervals. The second column represents the percentage of RNA signals that overlaps with the protein surfaces within a given distance to the centrosome.
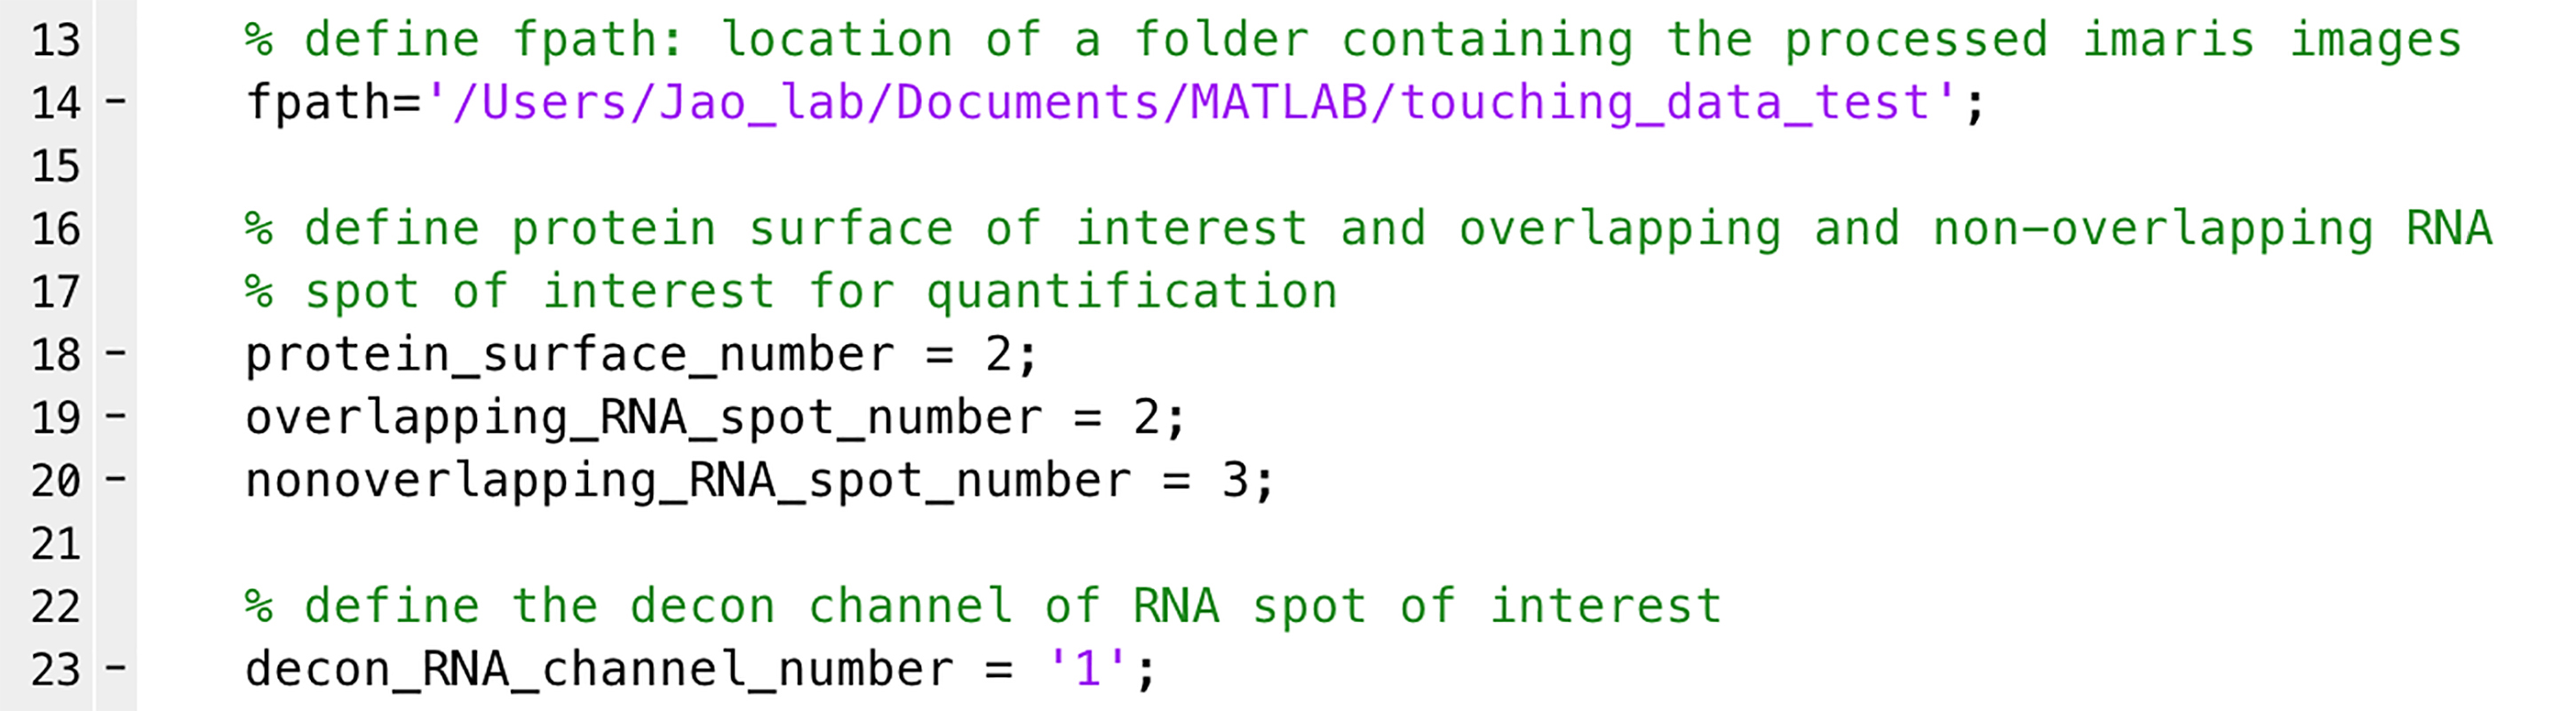
Figure 11. Quantification of the RNA signals that overlap with the protein signals. A highlight of the MATLAB script lines. See Supplementary files for the complete script.
- Use the same parameters or thresholds for each image during Imaris processing if users aim to compare the absolute intensity or distribution of proteins or RNAs between different experimental conditions.
- If MATLAB indicates errors about ImarisReader, run the script of ‘CellsReader.m’ to make sure that ImarisReader is functional before performing data analyses.
- Femino, A. M., Fay, F. S., Fogarty, K. and Singer, R. H. (1998). Visualization of single RNA transcripts in situ. Science 280(5363): 585-590.
- Lee, C., Roberts, S. E. and Gladfelter, A. S. (2016). Quantitative spatial analysis of transcripts in multinucleate cells using single-molecule FISH. Methods 98: 124-133.
- Mueller, F., Senecal, A., Tantale, K., Marie-Nelly, H., Ly, N., Collin, O., Basyuk, E., Bertrand, E., Darzacq, X. and Zimmer, C. (2013). FISH-quant: automatic counting of transcripts in 3D FISH images. Nat Methods 10(4): 277-278.
- Raj, A., van den Bogaard, P., Rifkin, S. A., van Oudenaarden, A. and Tyagi, S. (2008). Imaging individual mRNA molecules using multiple singly labeled probes. Nat Methods 5(10): 877-879.
- Sepulveda, G., Antkowiak, M., Brust-Mascher, I., Mahe, K., Ou, T., Castro, N. M., Christensen, L. N., Cheung, L., Jiang, X., Yoon, D., Huang, B. and Jao, L. E. (2018). Co-translational protein targeting facilitates centrosomal recruitment of PCNT during centrosome maturation in vertebrates. Elife 7: e34959.
- Tsanov, N., Samacoits, A., Chouaib, R., Traboulsi, A. M., Gostan, T., Weber, C., Zimmer, C., Zibara, K., Walter, T., Peter, M., Bertrand, E. and Mueller, F. (2016). smiFISH and FISH-quant - a flexible single RNA detection approach with super-resolution capability. Nucleic Acids Res 44(22): e165.
Notes
Acknowledgments
We thank the Jao lab members for discussions and support. This protocol was adapted from the previous work (Sepulveda et al., 2018). Experiments and analyses were performed in part through the use of UC Davis Health Sciences District Advanced Imaging Facility. The work was supported by the New Faculty Startup Funds from University of California, Davis (to L.J).
Competing interests
The authors declare no conflicts of interest.
References
文章信息
版权信息
![]() Jiang et al. This article is distributed under the terms of the Creative Commons Attribution License (CC BY 4.0).
Jiang et al. This article is distributed under the terms of the Creative Commons Attribution License (CC BY 4.0).
如何引用
Readers should cite both the Bio-protocol article and the original research article where this protocol was used:
- Jiang, X., Brust-Mascher, I. and Jao, L. E. (2019). Three-dimensional Reconstruction and Quantification of Proteins and mRNAs at the Single-cell Level in Cultured Cells. Bio-protocol 9(16): e3330. DOI: 10.21769/BioProtoc.3330.
- Sepulveda, G., Antkowiak, M., Brust-Mascher, I., Mahe, K., Ou, T., Castro, N. M., Christensen, L. N., Cheung, L., Jiang, X., Yoon, D., Huang, B. and Jao, L. E. (2018). Co-translational protein targeting facilitates centrosomal recruitment of PCNT during centrosome maturation in vertebrates. Elife 7: e34959.
分类
癌症生物学 > 通用技术 > 分子生物学技术
分子生物学 > RNA > RNA 检测
分子生物学 > 蛋白质 > 检测
您对这篇实验方法有问题吗?
在此处发布您的问题,我们将邀请本文作者来回答。同时,我们会将您的问题发布到Bio-protocol Exchange,以便寻求社区成员的帮助。