

A High-throughput qPCR-based Method to Genotype the SOD1G93A Mouse Model for Relative Copy Number
一种基于qPCR 的高通量研究 SOD1G93A小鼠模型中相对拷贝数的基因分型方法

发布: 2019年06月20日第9卷第12期 DOI: 10.21769/BioProtoc.3276 浏览次数: 7527
评审: Gal HaimovichKanika GeraAnonymous reviewer(s)
参见作者原研究论文
The authors used this protocol in:
Dec 2018
Advertisement


Abstract
The most commonly used mouse model in ALS preclinical research expresses multiple copies of the human SOD1 (G93A) transgene. During the course of breeding, successive generations of mice can lose copies of the transgene. Because shorter lifespan of these mice is dependent on transgene copy number, it is essential to ensure that no low-copy, and therefore longer-lived, mice are included in preclinical studies. Existing techniques for SOD1G93A mouse genotyping are broadly based on creating a standard curve using a reference gene and deducing the relative amount of SOD1 by comparison with the standard curve. This type of technique is used in Alexander et al. (2004), Vieira et al. (2017) and Maier et al. (2018). However, it is not described in detail (see Note 1). This paper provides a detailed protocol for determining the relative copy number of the human SOD1 transgene. Briefly, the protocol involves first the extraction of high-quality genomic DNA from mouse ear tissue, creation of a genomic DNA concentration-based standard curve, and qPCR analysis of up to 88 samples at once alongside the standard curve with Gapdh as a reference gene. Analysis involves the normalization of each unknown sample using the standard curve followed by determination of the copy number of the sample relative to the cohort median. This protocol has been optimized to produce high-quality genomic DNA and consistent results, and the relative copy number cutoffs have been optimized and validated empirically by comparison of relative copy number and mouse lifespan.
Keywords: ALS mouse model (ALS小鼠模型)Background
The SOD1G93A mouse model (B6SJL-Tg(SOD1*G93A)1Gur/J) is currently the most commonly used mouse model for preclinical testing of therapies for amyotrophic lateral sclerosis (ALS), a progressive neurodegenerative disease with most patients living between two and five years after diagnosis (Morrice et al., 2018). The human SOD1 transgene is present in multiple copies and mouse lifespan inversely correlates with copy number. Alexander et al. (2004) found that mice with 24 copies of the SOD1(G93A) gene lived to approximately 129 days, whereas mice with 34 copies lived to 99 days and mice with 20 copies lived to 150 days (Alexander et al., 2004). Additionally, 3.6% of high-copy transgenic male breeders had offspring with low copy numbers over the course of four years, signifying that it is not enough to only test stud males for copy number (Alexander et al., 2004). Although higher copy does correlate with shorter lifespan, spontaneous recombination tends toward dropped copies rather than increased copy number (Alexander et al., 2004; Zwiegers et al., 2014). Therefore, we focused our assay on identifying low-copy mice only.
In order to be sure that any measurable effects in a preclinical drug study are attributable to the treatment and not to an inherent difference in transgene copy, it is absolutely essential that no low-copy mice are included. While there are no SOD1 (G93A) genotyping methods published in a dedicated method or protocol journal, there are papers which briefly describe genotyping in the methods section. For example, Alexander et al. (2004) describe a qPCR-based method that uses change in cycle threshold (∆Ct) of SOD1 (G93A) and a reference gene to quantify copy number difference (Alexander et al., 2004).
In our hands, we found that published genotyping methods prior to 2016 were not sensitive enough to exclude all low-copy animals. Figure 1 shows the age at death of all mice included in a non-treatment group of survival studies from August 2015 to January 2019. The x-axis is the start date of each study, and the data set for each start date is the death ages of the mice included in the untreated group of that study. The finalized genotyping protocol detailed in this paper was instated on May 9, 2016, and the first mouse genotyped with this protocol was included in the study with the start date of June 7, 2016. The graph was analyzed in GraphPad Prism using a Box-and-Whiskers Tukey Test, which highlights any value that is either greater than the 75th percentile plus 1.5 times the interquartile range (IQR) or less than the 25th percentile minus 1.5 times the IQR. These outliers are shown as large blue dots. Since the genotyping protocol was instated, the number of outliers and their distance away from the median tend to decrease.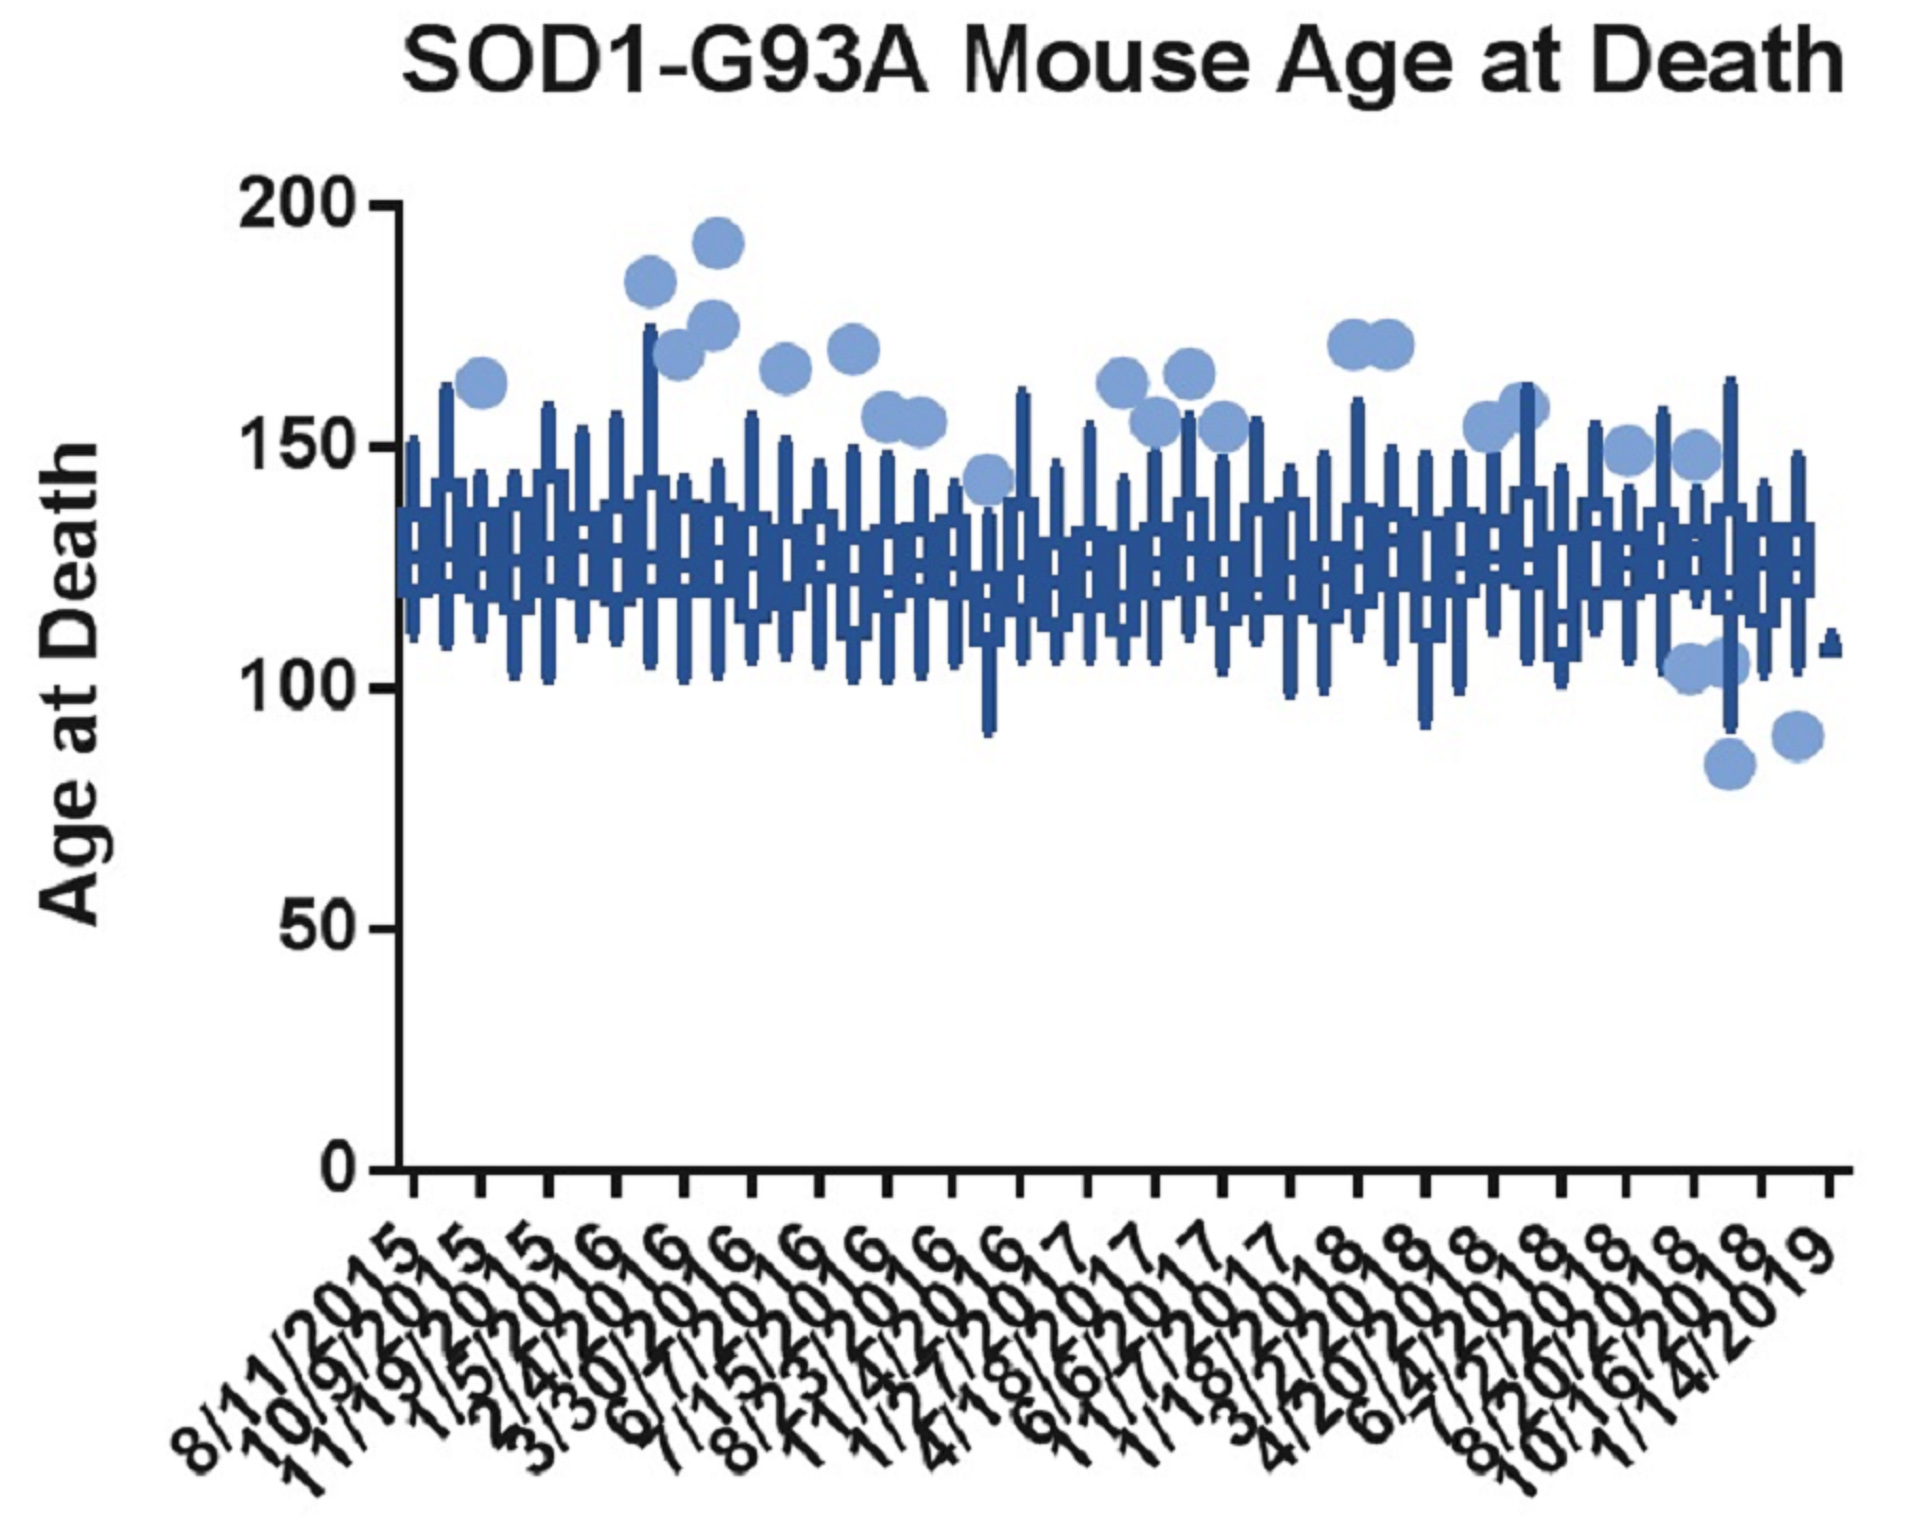
Figure 1. GraphPad Prism analysis of mouse death ages from August 2015 to January 2019. These mice were in untreated groups of survival studies. The dates shown on the x-axis indicate the start date of each study, and the data set associated with each date represents death ages of the mice in the untreated group of each study. Tukey’s Test on box-and-whisker plots has been applied, with the blue dots showing which data points are outside the 75th percentile plus 1.5 times the interquartile range (IQR) or the 25th percentile minus 1.5 times the IQR.
This genotyping protocol has been used in several published studies since 2016, including Vieira et al. (2017), and provides a qPCR-based method to ascertain relative copy number in a cohort of up to 88 mouse ear tissue samples without the need to determine absolute gene copy. The protocol relies on a concentration-based Gapdh standard curve to normalize the samples. After normalization, relative copy numbers are assigned based on log difference between each sample and the cohort median. Along with developing a reliable method to screen for low-copy mice, we optimized tissue collection to avoid cross-contamination and optimized genomic DNA extraction for consistent yield and high quality (see Note 2). Additionally, we also performed a dilution qPCR of potential reference gene primer and probe sets to determine which correlated best with the custom SOD1 target primer/probe set, and to determine the concentration range of our standard curve (Figure 2). As shown with the green triangles, the copy-number Gapdh primer/probe set from Thermo Fisher had the most comparable slope and Ct values to the SOD1 primer/probe sets, and both performed best between 2.5 and 0.07 ng/μl genomic DNA. To determine the safest relative copy number cutoff, we performed a survival study correlating copy number with lifespan. Mice with 16 or more copies showed typical lifespans for this mouse model, while mice with 15 or fewer copies were long-lived (Figure 3). Using this information we determined the safest cutoff to be 15 copies and fewer.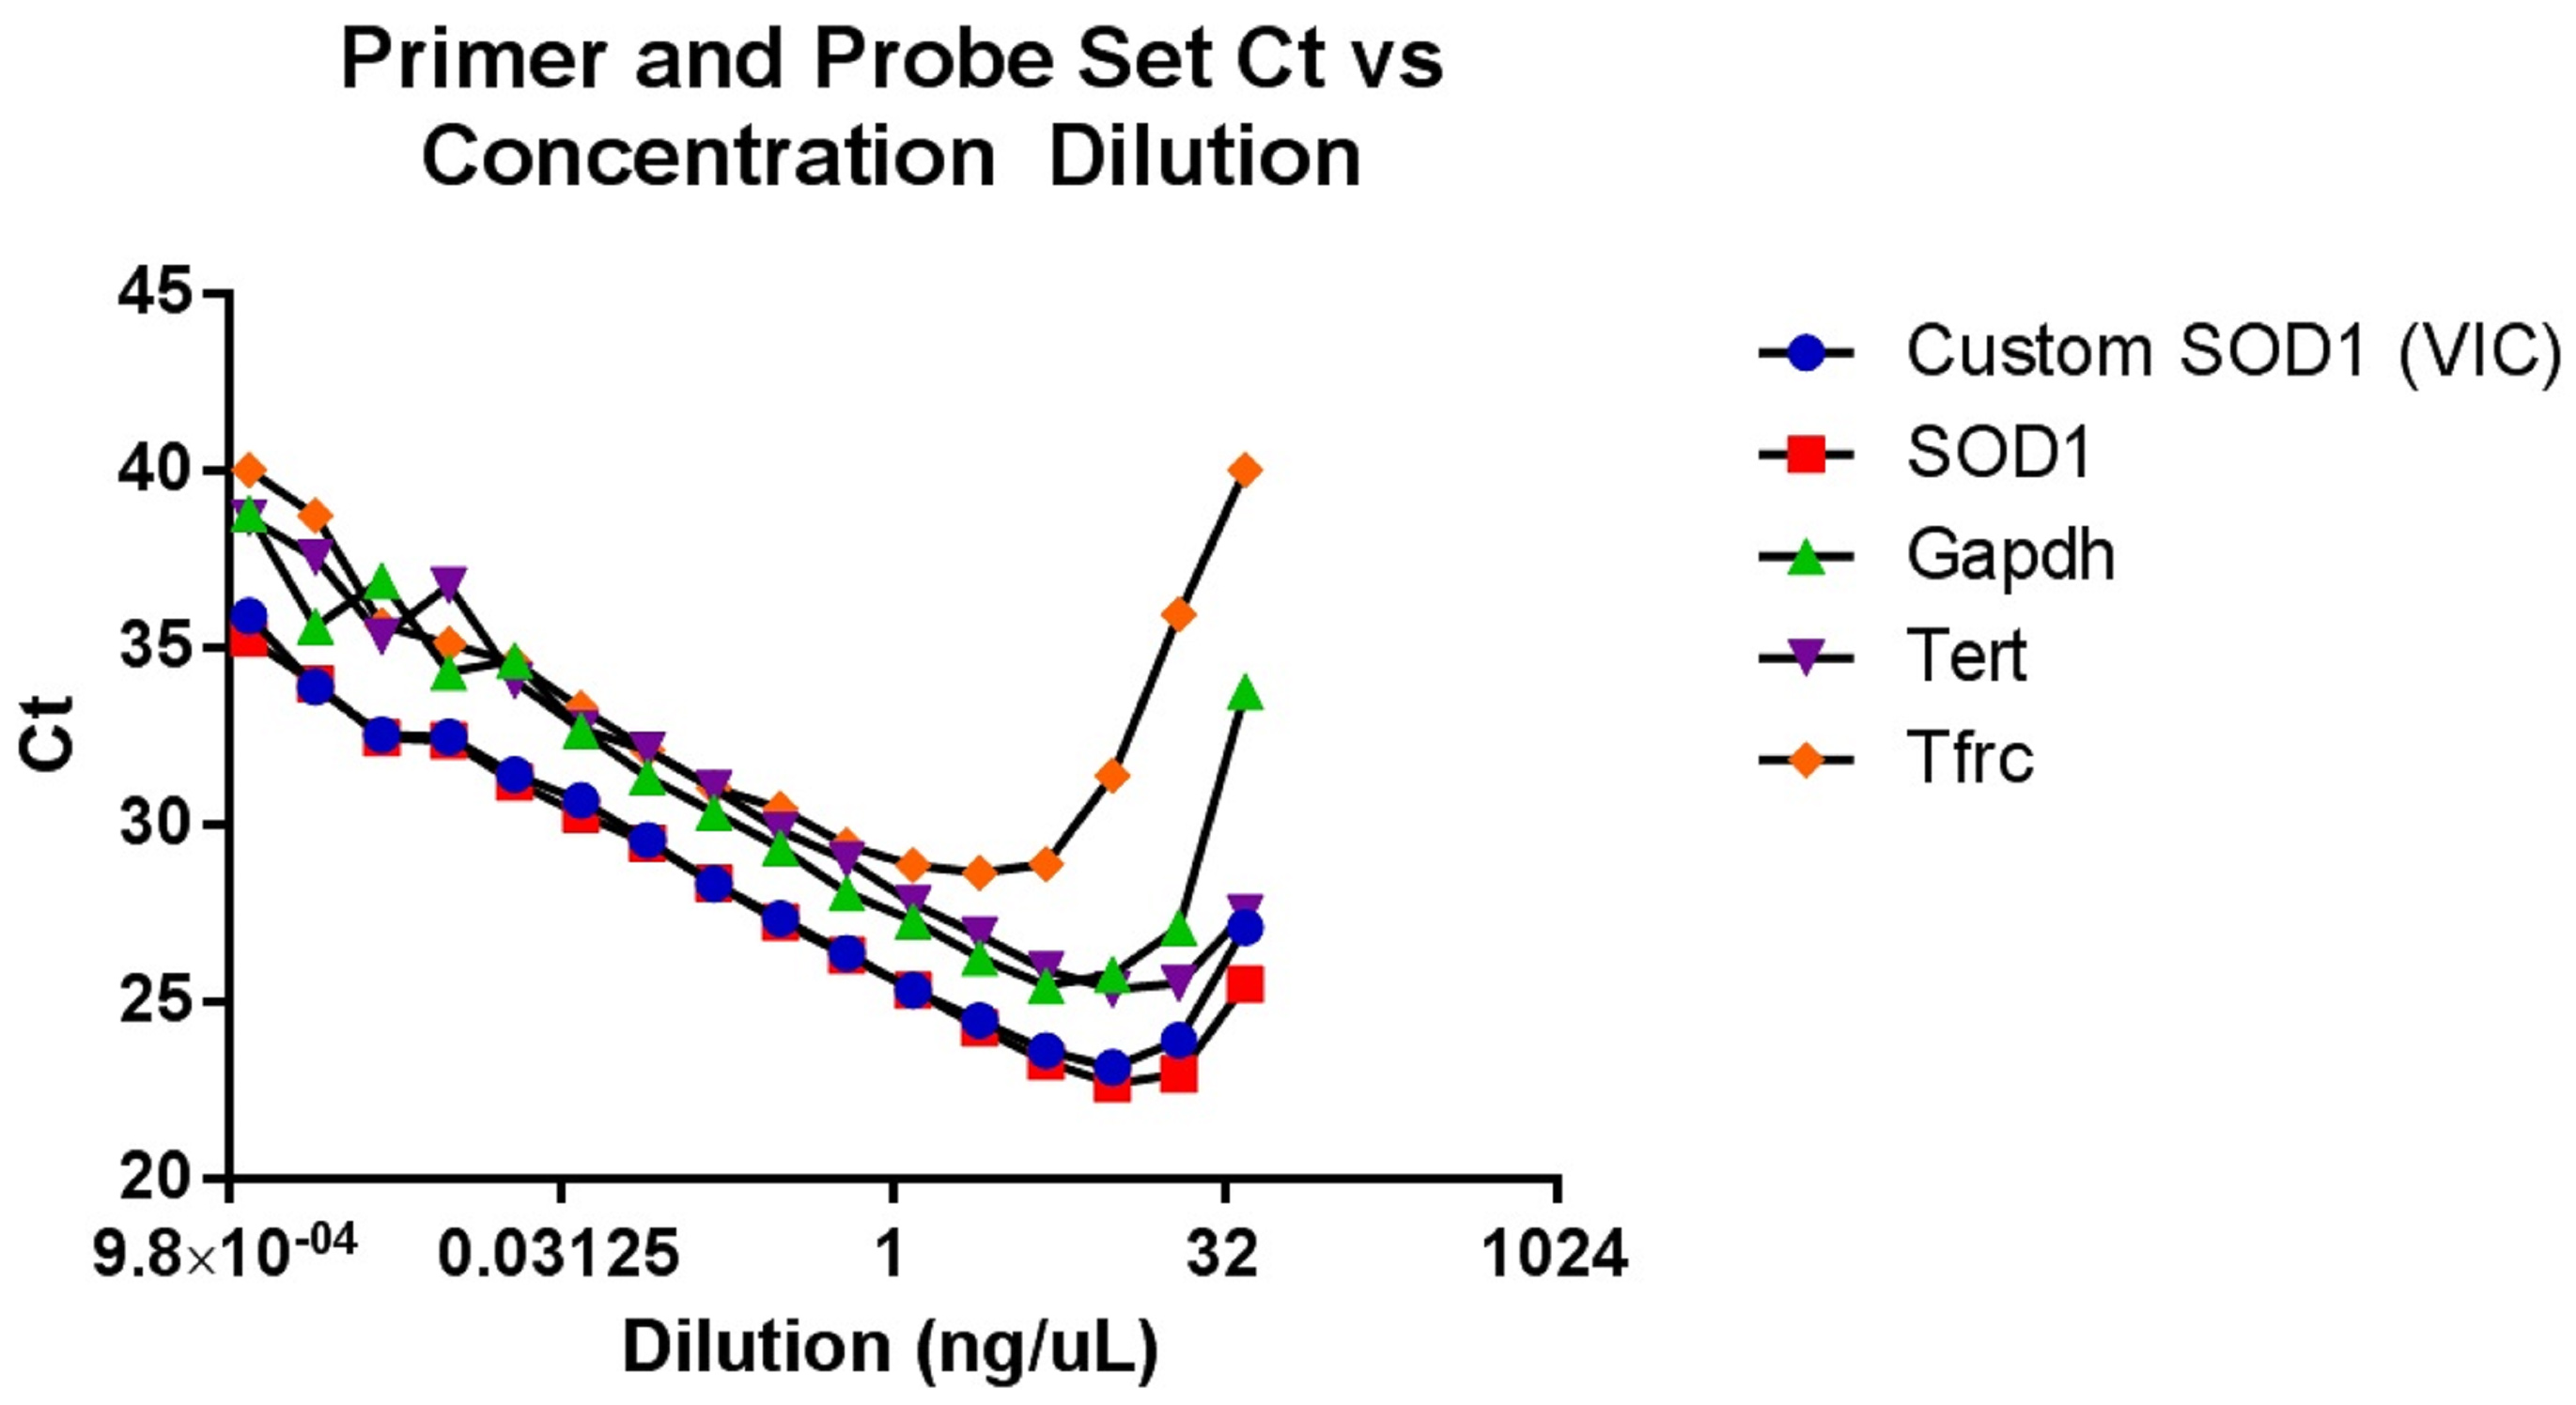
Figure 2. A qPCR experiment performed with serial two-fold dilutions of SOD1G93A genomic DNA from mouse ear tissue, probed with our custom SOD1 primer/probe set as well as several off-the-shelf primer/probe assays from Thermo Fisher. Our custom SOD1 primer/probe set compares well with the off-the-shelf SOD1 assay, and the Gapdh reference assay is closest to the SOD1 target assays in both Ct and in slope of the linear region. The graph is most linear between 0.07 and 2.5 ng/μl of genomic DNA, which gave us the optimal range for our experimental standard curve.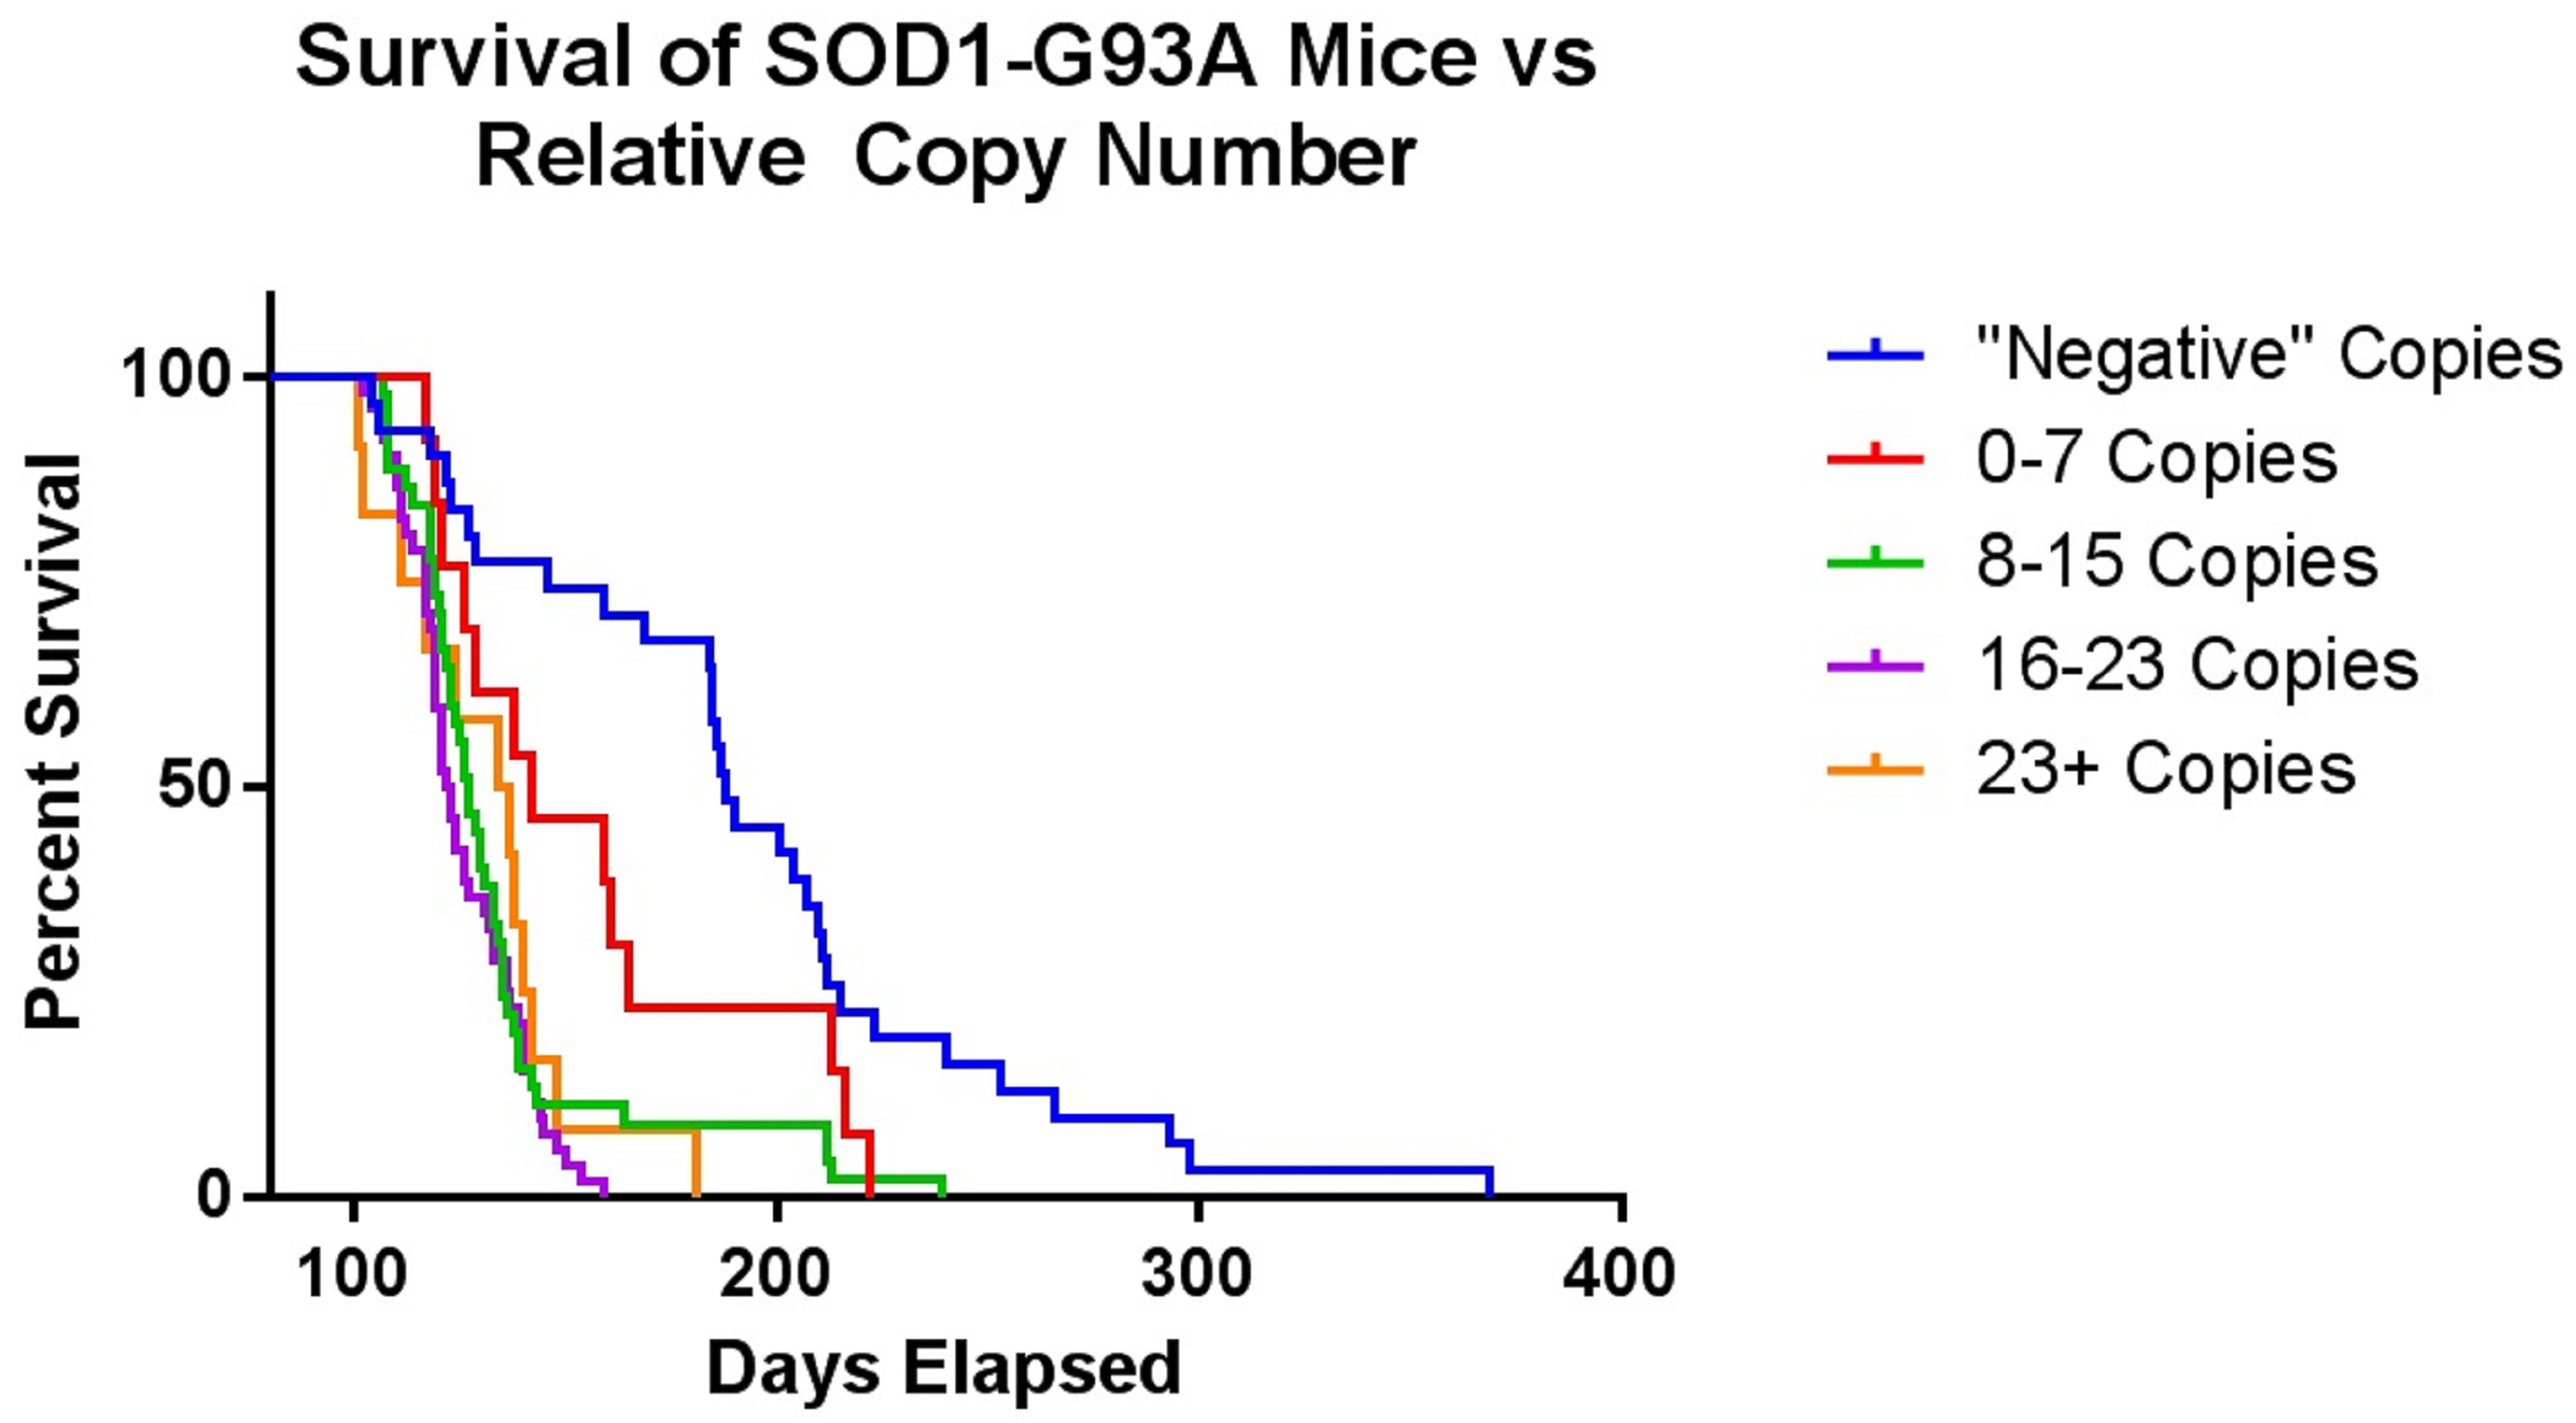
Figure 3. This graph shows the survival of SOD1G93A mice compared to their relative copy number as assigned by the genotyping protocol. The mice within a tolerable range of death ages were those in the 16-23+ copy number groups. Therefore, we selected 15 as the cutoff for relative copy number.
Materials and Reagents
Note: All storage is at room temperature unless otherwise specified.
- QIAcube HT Plasticware (QIAGEN, catalog number: 950067)
- Adhesive PCR Plate Seals (Thermo Fisher, Thermo Scientific, catalog number: AB0558)
- Sterile Alcohol Prep Pads (Fisher Scientific, Fisherbrand, catalog number: 22-363-750)
- 15 ml Centrifuge Tube (Corning, catalog number: 430766)
- 96-well UV-Transparent Microplates (Corning, catalog number: 3635)
- 384-well qPCR plate (Thermo Fisher, Applied BioSystems, catalog number: 4309849)
- Custom SOD1 MGB probe and primers (Thermo Fisher, Custom Genomics, -20 °C)
- Probe: SOD1HumanV2-55T (VIC-ACTCTCTCCAACTTTG) with VIC fluorescent reporter chemistry, 6000 pmole (wet, desalt)
- Forward primer: SOD1HumanV2-27F (GTAAATCAGCTGTTTTCTTTGTTCAGA), 80,000 pmole (dry, desalt)
- Reverse primer: SOD1HumanV2-104R (TTCACTGGTCCATTACTTTCCTTTAA), 80,000 pmole (dry, desalt)
- QIAamp 96 QIAcube HT Kit (QIAGEN, catalog number: 51331)
- PBS, Phosphate Buffered Saline, 10x Solution (Fisher BioReagents, Fisher Scientific, catalog number: BP3994)
- Alcohol, Reagent (Denatured Alcohol), 70% (v/v) Aqueous Solution (Ricca Chemical Company, Fisher Scientific, catalog number: 25467032, room temperature flammables cabinet)
- Neosporin First Aid Antibiotic Ointment (Hanna’s Pharm Supply Co, catalog number: 302-571-8761)
- Cotton-Tipped Applicators (Fisher Scientific, Puritan, catalog number: 22-029-571)
- 50 ml Reagent Reservoir (Corning, Costar, catalog number: 4870)
- DL-Dithiothreitol solution BioUltra for molecular biology, 1 M in H2O (Millipore Sigma, Sigma-Aldrich, catalog number: 43816), 4 °C
- Ethanol, Absolute (200 Proof), Molecular Biology Grade (Fisher Scientific, catalog number: BP2818100), room temperature flammables cabinet
- Nuclease-Free Water (Thermo Fisher, Invitrogen, catalog number: AM9932)
- TaqMan Genotyping Master Mix (Thermo Fisher, Applied Biosystems, catalog number: 4371355), 4 °C
- TaqMan Gapdh Copy Number Assay (Thermo Fisher Assay ID Mm00186822cn), -20 °C
- Sample Prep solution (see Recipes)
- Tissue Digestion solution (see Recipes)
- Primer Dilution solution (see Recipes)
- SOD1G93A Copy Number Genotyping qPCR Master Mix (see Recipes)
- Primer/Probe solution (see Recipes)
Equipment
- Two sterilized vessels for tissue harvest ethanol washes
- Surgery-quality tools to harvest ear tissue (forceps and scissors, or ear punch)
- Shaker capable of 18 h of 200 rpm and 56 °C incubation (Eppendorf, New Brunswick, catalog number: M1352-0010) (see Note 3)
- Qiagen QIAcube HT (QIAGEN, catalog number: 9001793) (see Note 3)
- SpectraMax M5 Multi-Mode Microplate Reader (Molecular Devices, catalog number: M5) (see Note 3)
- NanoDropTM 8000 Spectrophotometer (Thermo Fisher, Thermo Scientific, catalog number: ND-8000-GL) (see Note 3)
- Allegra X-22R Benchtop Centrifuge (Beckman Coulter, catalog number 392188) (see Note 3)
- QuantStudioTM 7 Flex Real-Time PCR System, 384-well, desktop (Thermo Fisher, catalog number: 4485701) (see Note 3)
Software
- Excel 2013 (Microsoft)
- Prism 6 (GraphPad, www.graphpad.com)
Procedure
文章信息
版权信息
© 2019 The Authors; exclusive licensee Bio-protocol LLC.
如何引用
Tassinari, V. R. and Vieira, F. G. (2019). A High-throughput qPCR-based Method to Genotype the SOD1G93A Mouse Model for Relative Copy Number. Bio-protocol 9(12): e3276. DOI: 10.21769/BioProtoc.3276.
分类
神经科学 > 感觉和运动系统 > 动物模型
分子生物学 > DNA > 基因分型
您对这篇实验方法有问题吗?
在此处发布您的问题,我们将邀请本文作者来回答。同时,我们会将您的问题发布到Bio-protocol Exchange,以便寻求社区成员的帮助。